Cumbria County Council election, 2017

Last updated
Cumbria County Council election, 2017
County Flag of Cumbria.png
  2013 4 May 20172021 

All 84 seats to Cumbria County Council
43 seats needed for a majority

  First party Second party Third party
 
Leader James Airey Stewart Young Patricia Anne Bell
Party Conservative Labour Liberal Democrat
Last election 25 35 16
Seats won 37 26 16
Seat changeIncrease2.svg12Decrease2.svg10Steady2.svg0
Popular vote 62696 37276 25308
Percentage 44.3% 26.3% 17.9%
SwingIncrease2.svg13.3%Decrease2.svg2.0%Decrease2.svg0.1%

Cumbria UK local election 2017 map.svg

Map showing the results of the 2017 Cumbria County Council elections.

Council control before election

No overall control

Council control after election

No overall control

The 2017 Cumbria County Council election took place on 4 May 2017 as part of the 2017 local elections in the United Kingdom. [1] All 84 councillors were elected from electoral divisions which return one county councillor each by first-past-the-post voting for a four-year term of office.

Cumbria County Council British administrative body

Cumbria County Council is the county council of Cumbria, a county in the North West of England. Established in 1974, following its first elections held a year before that, it is an elected local government body responsible for the most significant local services in the county, including county schools, county roads, and social services.

The wards and electoral divisions in the United Kingdom are electoral districts at sub-national level represented by one or more councillors. The ward is the primary unit of English electoral geography for civil parishes and borough and district councils, electoral ward is the unit used by Welsh principal councils, while the electoral division is the unit used by English county councils and some unitary authorities. Each ward/division has an average electorate of about 5,500 people, but ward-population counts can vary substantially. As at the end of 2014 there were 9,456 electoral wards/divisions in the UK.

Contents

Result summary

Cumbria County Council election, 2017 [2]
PartySeatsGainsLossesNet gain/lossSeats %Votes %Votes+/−
  Conservative 37 14 2 +12 44.0 44.3 62,696 +13.1
  Labour 26 2 12 -10 31.0 26.3 32,276 -2.0
  Liberal Democrat 16 3 2 +1 19.0 17.9 25,308 -0.1
  Independent 5 1 3 -2 6.0 5,5 7,797 -0.9
  Green 0 - - - - 4,0 5,632 +1.8
  UKIP 0 - - - - 2,0 2,791 -9.7

Results by electoral division

Allerdale District

(16 seats, 16 electoral divisions)

Allerdale District
CandidatesVotes
Party Stood Elected Gained UnseatedNet % of total % Net %
  Conservative 16 6 1 1 0 38.7 10,381
  Labour 15 6 1 2 -1 35.0 9,379
  Independent 4 3 1 0 1 10.0 2,689
  Liberal Democrat 5 1 1 0 1 6.6 1,767
  Green 14 0 0 0 0 6.4 1,724 -
  UKIP 3 0 0 0 0 3.6 969

Aspatria

Aspatria (1 seat)
PartyCandidateVotes%±
Conservative Jim Lister 593 39.3 +1.1
Liberal Democrat Phil Roberts 548 36.4 +33.5
Labour Gregory Peter Kendall 262 17.4 -6.7
UKIP David Wilson 211 6.7 n/a
Turnout 1,507 36.5 +6.5
Conservative hold Swing

Bothel and Wharrels

Bothel and Wharrels (1 seat)
PartyCandidateVotes%±
Conservative Alan Bowness 1,235 66.4 +5.8
Green Jill Perry 615 33.1 +12.2
Turnout 1,860 45.7 +8.1
Conservative hold Swing

Cockermouth North

Cockermouth North (1 seat)
PartyCandidateVotes%±
Liberal Democrat Rebecca Charlotte Hanson 811 39.8 +34.3
Conservative Peter Andrew Hardie Nicholson 609 29.9 -14.7
Labour Isabel Jeanette Burns 546 26.8 -12.2
Green Flic Crowley 70 3.4 -6.4
Turnout 2,040 40.4 +7.0
Liberal Democrat gain from Conservative Swing

Cockermouth South

Cockermouth South (1 seat)
PartyCandidateVotes%±
Conservative Alan Kennon 1,117 56.2 +22.7
Labour Andrew Irving Semple 579 29.1 +7.2
Liberal Democrat Roger Peck 204 10.3 -13.0
Green Jane Christine Roy 86 4.3 -1.8
Turnout 1,989 43.5 +5.4
Conservative hold Swing

Dearham and Broughton

Dearham and Broughton (1 seat)
PartyCandidateVotes%±
Conservative Hugo George Greenbank Graham 805 48.9 +17.0
Labour Alan Clark 641 38.9 +2.4
UKIP Richard Mawdsley 112 6.8 -14.6
Green Helen Hilda Smith 85 5.2 +1.9
Turnout 1,646 36.1 +1.0
Conservative gain from Labour Swing

Harrington

Harrington (1 seat)
PartyCandidateVotes%±
Independent Marjorie Rae 613 46.7 -4.8
Labour Janet Mary King 425 32.4 +7.7
Conservative Neville John Lishman 189 14.4 n/a
Liberal Democrat Reece Fleming 84 6.4 +4.5
Turnout 1,313 29.1 -2.3
Independent hold Swing

Keswick

Keswick (1 seat)
PartyCandidateVotes%±
Labour Tony Lywood 933 51.5 +39.0
Conservative Ronald Munby 608 33.6 +17.0
Green Jack Frederick Lenox 268 14.8 +7.7
Turnout 1,811 42.4 +8.1
Labour gain from Independent Swing

Maryport North

Maryport North (1 seat)
PartyCandidateVotes%±
Labour Carni McCarron-Holmes 663 38.6 +4.9
UKIP George Masterton Kemp 646 37.6 +27.7
Conservative Sarah Jane Pagan 318 18.5 +13.3
Green Clare Brown 86 5.0 +0.7
Turnout 1,719 35.1 -4.6
Labour hold Swing

Maryport South

Maryport South (1 seat)
PartyCandidateVotes%±
Labour Keith Anthony Little 983 72.7 +27.8
Conservative Antony Armstrong Todd 285 21.1 +18.0
Green Laura Rumney 84 6.2 +5.1
Turnout 1,353 29.5 -10.3
Labour hold Swing

Moss Bay and Moorclose

Moss Bay and Moorclose (1 seat)
PartyCandidateVotes%±
Independent Stephen Stoddart 847 55.1 +8.4
Labour Barbara Ann Cannon 484 31.5 -16.5
Conservative Louise Mary Donnelly 188 12.2 +7.5
Green Douglas Maw 17 1.1 n/a
Turnout 1,538 32.5 +2.1
Independent gain from Labour Swing

Seaton

Seaton (1 seat)
PartyCandidateVotes%±
Labour Celia Tibble 755 48.4 +1.6
Conservative Mark Ian Jenkinson 727 46.6 +38.6
Green Alistair John Grey 74 4.7 n/a
Turnout 1,560 33.5
Labour hold Swing

Solway Coast

Solway Coast (1 seat)
PartyCandidateVotes%±
Conservative Tony Markley 884 50.3 -3.2
Independent John Cook 525 29.9 n/a
Labour Caroline Richardson 274 15.6 -1.5
Green Richard Clive Rawson 70 4.0 -1.7
Turnout 1,758 41.2 +4.6
Conservative hold Swing

St John's and Great Clifton

St John's and Great Clifton (1 seat)
PartyCandidateVotes%±
Independent Joe Holliday 704 40.0 -3.3
Labour Anthony David McGuckin 635 36.1 +9.3
Conservative Ann Vipond McKerrell 369 21.0 n/a
Green Fliss Watts 52 3.0 +0.7
Turnout 1,761 34.7 +1.7
Independent hold Swing

St Michael's

St Michael's (1 seat)
PartyCandidateVotes%±
Labour Alan Lawrence Barry 798 64.4 +13.3
Conservative Gladys Wilson 277 22.3 +15.8
Liberal Democrat Margaret Bennett 120 9.8 n/a
Green Peter George Rowland Rigg 36 2.9 +0.4
Turnout 1,240 27.9 -0.6
Labour hold Swing

Thursby

Thursby (1 seat)
PartyCandidateVotes%±
Conservative Duncan Stewart Fairbairn 1,294 72.9 +4.9
Labour Bill Goldsmith 343 19.3 +1.7
Green Dianne Estelle Standen 128 7.2 +0.2
Turnout 1,776 42.4 +8.6
Conservative hold Swing

Wigton

Wigton (1 seat)
PartyCandidateVotes%±
Labour Roger John Liddle 1,058 53.0 +14.7
Conservative Malcolm Grainger 883 44.2 +14.1
Green Patricia Anne Ackred 53 2.7 -0.6
Turnout 1,998 38.3 +5.0
Labour hold Swing

Barrow-in-Furness

Barrow-in-Furness District
CandidatesVotes
Party Stood Elected Gained UnseatedNet % of total % Net %
  Labour 11 6 0 4 -4 39.5 5,712
  Conservative 11 5 4 0 4 46.5 6,715
  UKIP 6 0 0 0 0 5.1 739
  Independent 1 0 0 0 0 1.0 148
  Liberal Democrat 1 0 0 0 0 0.4 63

Dalton North

Dalton North (1 seat)
PartyCandidateVotes%±
Conservative Ben Shirley 884 55.2 +31.2
Labour Barry Doughty 569 35.5 -17.1
Independent Glen David Higgins 148 9.2 n/a
Turnout 1,602 32.3 +8.9
Conservative gain from Labour Swing

Dalton South

Dalton South (1 seat)
PartyCandidateVotes%±
Conservative Des English 683 49.7 +24.7
Labour Ernie Wilson 508 37.0 -10.9
UKIP Dick Young 115 8.4 -12.8
Liberal Democrat Raymond George Beecham 63 4.6 n/a
Turnout 1,373 28.4 +5.5
Conservative gain from Labour Swing

Hawcoat

Hawcoat (1 seat)
PartyCandidateVotes%±
Conservative Roy Worthington 1,245 74.1 +20.4
Labour Connor James Lambton 429 25.5 +2.4
Turnout 1,681 35.1 +7.0
Conservative hold Swing

Hindpool

Hindpool (1 seat)
PartyCandidateVotes%±
Labour Anne Burns 714 62.0 -5.8
Conservative Anne Denise English 300 26.0 +12.3
UKIP Dave Roberts 136 11.8 -5.8
Turnout 1,152 22.9 +3.5
Labour hold Swing

Newbarns and Parkside

Newbarns and Parkside (1 seat)
PartyCandidateVotes%±
Conservative Sol Wielkopolski 683 49.6 +24.9
Labour John Murphy 600 43.5 -3.1
UKIP Karl Darrell Hunt 90 6.5 -16.3
Turnout 1,378 26.7 +3.2
Conservative gain from Labour Swing

Old Barrow

Old Barrow (1 seat)
PartyCandidateVotes%±
Labour Helen Wall 577 60.0 -9.1
Conservative Brenda Joyce Lauderdale 290 30.1 n/a
UKIP Colin John Rudd 94 9.8 -20.2
Turnout 962 19.9 +1.9
Labour hold Swing

Ormsgill

Ormsgill (1 seat)
PartyCandidateVotes%±
Labour Bill McEwan 660 51.7 +2.1
Conservative Terri-Anne Gibney 398 31.2 +17.9
UKIP Theresa Marie McMeekin 216 16.9 +2.6
Turnout 1,277 25.2 +2.9
Labour hold Swing

Risedale

Risedale (1 seat)
PartyCandidateVotes%±
Labour Kevin Robert Hamilton 667 63.2 +1.4
Conservative Jamie Samson 382 36.2 +25.8
Turnout 1,055 23.0 +2.5
Labour hold Swing

Roosecote

Roosecote (1 seat)
PartyCandidateVotes%±
Conservative Derek Gawne 898 56.4 +21.3
Labour Fred Chatfield 606 38.0 -9.6
UKIP Pete Richards 88 5.5 -11.7
Turnout 1,593 30.6 -0.9
Conservative gain from Labour Swing

Walney North

Walney North (1 seat)
PartyCandidateVotes%±
Labour Mel Worth 720 63.4 -7.6
Conservative Martin David McLeavy 413 36.4 n/a
Turnout 1,135 26.0 0.0
Labour hold Swing

Walney South

Walney South (1 seat)
PartyCandidateVotes%±
Labour Frank Cassidy 739 57.7 -5.6
Conservative Rory McClure 539 42.1 +21.1
Turnout 1,280 30.5 +4.5
Labour hold Swing

Carlisle

Carlisle District
CandidatesVotes
Party Stood Elected Gained UnseatedNet % of total % Net %
  Labour 17 8 0 1 -1 32.1 9,106
  Conservative 18 7 2 0 2 44.9 12,733
  Independent 5 2 0 1 -1 8.4 2,384
  Liberal Democrat 8 1 0 0 0 7.6 2,168
  Green 13 0 0 0 0 3.8 1,084
  UKIP 9 0 0 0 0 3.1 868

Belah

Belah (1 seat)
PartyCandidateVotes%±
Conservative Gareth Michael Ellis 951 48.1 +2.1
Labour Paul Leslie Birks 538 27.2 +0.8
Independent Alan Toole 478 24.2 n/a
Turnout 1,978 41.5 +5.7
Conservative gain from Independent Swing

Belle Vue

Belle Vue (1 seat)
PartyCandidateVotes%±
Labour Christine Bowditch 742 46.0 -19.0
Conservative Geoffrey Osbourne 722 44.8 +11.2
UKIP Susan Riley 91 5.6 n/a
Green Helen Elizabeth Atkinson 52 3.2 n/a
Turnout 1,612 35.7 +11.2
Labour hold Swing

Botcherby

Botcherby (1 seat)
PartyCandidateVotes%±
Independent Robert William Betton 807 49.9 +11.3
Labour Helen Anne Fisher 431 26.7 -1.7
Conservative Paul Nedved 337 20.8 +1.5
Green Deb Brown 40 2.5 n/a
Turnout 1,617 37.0 +7.3
Independent hold Swing

Brampton

Brampton (1 seat)
PartyCandidateVotes%±
Conservative Lawrence Fisher 860 55.4 +7.0
Labour Lesley Begley 321 20.7 -3.1
Liberal Democrat Olwyn Doreen Luckley 135 8.7 +2.5
Green Colin Luhrs 126 8.1 n/a
UKIP John James Harding 107 6.9 -15.2
Turnout 1,553 37.1 +7.9
Conservative hold Swing

Castle

Castle (1 seat)
PartyCandidateVotes%±
Labour Alan Robert McGuckin 469 43.3 +2.8
Conservative James Bainbridge 364 33.6 +23.0
Liberal Democrat David John Wood 117 10.8 -12.3
UKIP Robbie Reid-Sinclair 77 7.1 -12.9
Green Richard Sebastian Hunt 53 4.9 +0.9
Turnout 1,084 28.0 +4.4
Labour hold Swing

Corby and Hayton

Corby and Hayton (1 seat)
PartyCandidateVotes%±
Independent William James Graham 830 47.6 -25.4
Conservative Keith Meller 608 34.9 +8.6
Liberal Democrat Alison Elizabeth Hobson 177 10.2 n/a
Green Charmian Jess McCutcheon 124 7.1 n/a
Turnout 1,742 46.3 +8.9
Independent hold Swing

Currock

Currock (1 seat)
PartyCandidateVotes%±
Labour Reg Watson 562 54.4 +1.4
Conservative Geoff Mitchell 309 29.9 +15.1
Independent Jeffrey Bomford 96 9.3 n/a
Green Sky Fiona Higgins 64 6.2 -2.8
Turnout 1,033 24.5 +3.5
Labour hold Swing

Dalston and Burgh

Dalston and Burgh (1 seat)
PartyCandidateVotes%±
Liberal Democrat Trevor Allison 1,048 46.8 +7.6
Conservative Katharine Oliver 936 41.8 +9.4
Labour Ray Warwick 248 11.1 -1.8
Turnout 2,239 42.8 +4.7
Liberal Democrat hold Swing

Denton Holme

Denton Holme (1 seat)
PartyCandidateVotes%±
Labour Hugh McDevitt 800 59.9 +3.4
Conservative Syed Ali 360 26.9 +15.2
Green Neil Boothman 93 7.0 -1.3
UKIP Kerryanne Mckay Wilde 80 6.0 -12.8
Turnout 1,336 29.9 +4.7
Labour hold Swing

Harraby North

Harraby North (1 seat)
PartyCandidateVotes%±
Labour Cyril Frederick Weber 737 66.5 +2.1
Conservative Barbara Eden 358 32.3 +20.4
Turnout 1,108 25.2 +1.5
Labour hold Swing

Harraby South

Harraby South (1 seat)
PartyCandidateVotes%±
Labour Deborah Anne Earl 671 44.7 +0.4
Conservative Michael Randall 655 43.6 +16.7
Independent Jack Paton 173 11.5 n/a
Turnout 1,501 36.8 +8.2
Labour hold Swing

Houghton and Irthington

Houghton and Irthington (1 seat)
PartyCandidateVotes%±
Conservative John Mallinson 1,112 65.5 +13.1
Labour Maggie Robinson 262 15.4 -3.7
Liberal Democrat Brendan Murphy 140 8.2 n/a
UKIP Fiona Rachel Mills 90 5.3 -22.7
Green Hazel Jane Graham 88 5.2 n/a
Turnout 1,697 39.7 +5.9
Conservative hold Swing

Longtown

Longtown (1 seat)
PartyCandidateVotes%±
Conservative Val Tarbitt 921 73.9 +26.8
Labour Stephen Ronald Sidgwick 215 17.3 -3.7
UKIP Graham Moore 109 8.7 -19.8
Turnout 1,246 33.2 +5.3
Conservative hold Swing

Morton

Morton (1 seat)
PartyCandidateVotes%±
Labour John Bell 804 58.7 +0.9
Conservative David Shepherd 477 34.8 +20.8
Green Rob Morrison 84 6.1 n/a
Turnout 1,369 31.3 -0.5
Labour hold Swing

Stanwix Urban

Stanwix Urban (1 seat)
PartyCandidateVotes%±
Conservative Elizabeth Mallinson 1,123 57.0 +16.3
Labour Tim Linford 548 27.8 -2.5
Green Helen Davison 216 11.0 +3.8
UKIP Phil Douglass 83 4.2 -13.3
Turnout 1,970 45.2 +5.0
Conservative hold Swing

Upperby

Upperby (1 seat)
PartyCandidateVotes%±
Labour Stewart Farries Young 703 52.4 -10.4
Conservative Fiona Robson 415 30.9 +14.6
UKIP John Gordon Denholm 120 8.9 n/a
Liberal Democrat James Ernest Osler 70 5.2 -4.2
Green Penelope Bothepa Foster 31 2.3 n/a
Turnout 1,341 30.2 +1.3
Labour hold Swing

Wetheral

Wetheral (1 seat)
PartyCandidateVotes%±
Conservative Nick Marriner 1,297 65.2 +25.9
Liberal Democrat Michael Anthony Gee 307 15.4 +5.3
Labour Stephen John William Bowditch 300 15.1 -5.2
Green Dallas Jane Brewis 85 4.3 +0.1
Turnout 1,990 45.3 +6.6
Conservative hold Swing

Yewdale

Yewdale (1 seat)
PartyCandidateVotes%±
Conservative Stephen Haraldsen 928 46.3 +20.9
Labour Beth Furneaux 755 37.6 -10.2
Liberal Democrat Jeff Coates 174 8.7 n/a
UKIP Malcolm Fraser Craik 111 5.5 -21.1
Green Henry Bryson Goodwin 28 1.4 n/a
Turnout 2,006 43.6 +8.7
Conservative gain from Labour Swing

Copeland

Copeland District
CandidatesVotes
Party Stood Elected Gained UnseatedNet % of total % Net %
  Conservative 12 8 5 0 6 48.9 8,377
  Labour 12 4 0 5 -5 40.2 6,887
  Independent 6 0 0 0 0 8.4 1,287
  Green 5 0 0 0 0 2.2 379
  UKIP 2 0 0 0 0 0.8 140
  Liberal Democrat 1 0 0 0 0 0.4 66


Bransty

Bransty (1 seat)
PartyCandidateVotes%±
Conservative Graham Robert Phillip Melville Roberts 607 42.6 -6.2
Labour Rachel Margaret Holliday 561 39.3 -10.6
Independent Charles Edward Maudling 220 15.4 n/a
Green Meggie Bedford 38 2.7 -n/a
Turnout 1,426 33.1 +7.4
Conservative gain from Labour Swing

Cleator Moor East and Frizington

Cleator Moor East and Frizington (1 seat)
PartyCandidateVotes%±
Conservative Arthur William Creighton Lamb 629 46.9 +17.9
Labour Tim Knowles 612 45.6 -3.0
Green Allan Franciscus Todd 93 6.9 +0.9
Turnout 1,341 30.7 +3.7
Conservative gain from Labour Swing

Cleator Moor West

Cleator Moor West (1 seat)
PartyCandidateVotes%±
Labour Frank Irving Morgan 567 50.6 -14.0
Conservative Genna Elaine Haraldsen 309 27.6 +12.4
Independent Christopher Patrick Ross 112 10.0 n/a
Liberal Democrat Mike Monigue 66 5.9 n/a
UKIP Nicholas Frederick Ford 65 5.8 n/a
Turnout 1,120 25.2 +2.7
Labour hold Swing

Egremont

Egremont (1 seat)
PartyCandidateVotes%±
Labour David Edward Southward 789 53.8 +3.2
Conservative Alistair William Millar Norwood 677 46.1 +28.1
Turnout 1,470 31.5 +4.9
Labour hold Swing

Egremont North and St Bees

Egremont North and St Bees (1 seat)
PartyCandidateVotes%±
Conservative Chris Whiteside 626 42.6 +7.1
Labour Henry Wormstrup 469 31.9 -4.8
Independent Wammo Walmsley 208 14.2 n/a
Independent Jayne Anne Laine 163 11.1 n/a
Turnout 1,469 33.8 +9.9
Conservative gain from Labour Swing

Gosforth

Gosforth (1 seat)
PartyCandidateVotes%±
Conservative Christopher Paul Turner 1,144 60.8 -11.4
Independent Sam Meteer 366 19.4 n/a
Labour Peter Kane 311 16.5 -9.3
Green Daniel James Nixon 57 3.0 n/a
Turnout 1,882 40.1 +6.7
Conservative hold Swing

Hillcrest and Hensingham

Hillcrest and Hensingham (1 seat)
PartyCandidateVotes%±
Conservative Andrew William Wonnacott 816 50.3 +5.5
Labour Christine Wharrier 801 49.4 -5.1
Turnout 1,623 36.7 +6.5
Conservative gain from Labour Swing

Howgate

Howgate (1 seat)
PartyCandidateVotes%±
Conservative Martin Steven Barbour 623 47.6 +17.0
Labour Gillian Ruth Troughton 566 43.2 -16.7
UKIP Eric William Atkinson 75 5.7 -n/a
Green Sharon Josephine Watson 44 3.4 -5.1
Turnout 1,309 29.3 +4.1
Conservative gain from Labour Swing

Kells and Sandwith

Kells and Sandwith (1 seat)
PartyCandidateVotes%±
Labour Emma Louise Williamson 684 51.7 -7.4
Conservative Brigid Anne Whiteside 419 31.7 +13.7
Independent Michael Patrick Anthony Guest 218 16.5 -n/a
Turnout 1,322 28.0 +2.1
Labour hold Swing

Millom

Millom (1 seat)
PartyCandidateVotes%±
Conservative Doug Wilson 967 68.4 +26.8
Labour Denise Barbara Burness 442 31.3 -1.7
Turnout 1,413 31.4 +3.2
Conservative hold Swing

Millom Without

Millom Without (1 seat)
PartyCandidateVotes%±
Conservative Keith Haigh Hitchen 1,150 72.7 +10.3
Labour Ryan Woods 281 17.8 -5.4
Green Sally Millar 147 9.3 -3.4
Turnout 1,582 39.6 +7.9
Conservative hold Swing

Mirehouse

Mirehouse (1 seat)
PartyCandidateVotes%±
Labour Mike Hawkins 804 66.0 +4.1
Conservative Jane Margaret Micklethwaite 410 33.6 +19.0
Turnout 1,219 28.5 +3.2
Labour hold Swing

Eden

Eden District
CandidatesVotes
Party Stood Elected Gained UnseatedNet % of total % Net %
  Conservative 9 5 0 1 -1 48.1 7,948
  Liberal Democrat 9 3 1 0 1 30.0 4,954
  Labour 6 1 1 0 1 8.9 1,476
  Independent 3 0 0 1 -1 7.8 1,289
  Green 6 0 0 0 0 3.1 510
  UKIP 2 0 0 0 0 0.9 142

Alston and East Fellside

Alston and East Fellside (1 seat)
PartyCandidateVotes%±
Labour Claire Susan Driver 836 35.1 +24.7
Conservative Walter Walker 688 28.9 +2.7
Independent Mary Robinson 624 26.2 -9.8
Liberal Democrat Deb Holden 116 4.9 n/a
Green Alan William Marsden 114 4.8 -8.6
Turnout 2,380 46.1 +14.0
Labour gain from Independent Swing

Appleby

Appleby (1 seat)
PartyCandidateVotes%±
Liberal Democrat Andy Connell 909 48.1 +19.4
Conservative John Mervyn Owen 844 44.7 -2.7
Labour John Potts 78 4.1 n/a
Green Kimberly Jane Lawson 56 3.0 n/a
Turnout 1,888 41.6 +8.6
Liberal Democrat gain from Conservative Swing

Eden Lakes

Eden Lakes (1 seat)
PartyCandidateVotes%±
Liberal Democrat Neil Hughes 1,129 54.6 +6.5
Conservative Laura Elizabeth Kay 931 45.1 +2.1
Turnout 2,066 48.0 +8.5
Liberal Democrat hold Swing

Greystoke and Hesket

Greystoke and Hesket (1 seat)
PartyCandidateVotes%±
Conservative Tom Wentworth Waites 1,009 57.2 +5.5
Liberal Democrat Roger Burgin 255 14.5 -7.8
Green Doug Lawson 205 11.6 n/a
Labour Ruth Ann Wood 201 11.4 n/a
UKIP David Benson Ryland 89 5.0 -18.7
Turnout 1,763 36.3 +7.2
Conservative hold Swing

Kirkby Stephen

Kirkby Stephen (1 seat)
PartyCandidateVotes%±
Conservative Phil Dew 1,605 70.1 +15.1
Liberal Democrat Kelvyn Justin Simon James 407 17.8 -8.3
Labour Ian Daniel Simkins 194 8.5 n/a
Green Richard Kevin O'Brien 77 3.4 n/a
Turnout 2,289 45.2 +9.4
Conservative hold Swing

Penrith East

Penrith East (1 seat)
PartyCandidateVotes%±
Liberal Democrat Patricia Ann Bell 955 60.8 +4.6
Conservative John Forrester 445 28.3 +10.3
Labour Hilary Jane Snell 85 5.4 -6.0
UKIP Mary Elizabeth Dixon 53 3.4 -8.8
Green Ali Ross 29 1.8 n/a
Turnout 1,570 34.3 +4.6
Liberal Democrat hold Swing

Penrith North

Penrith North (1 seat)
PartyCandidateVotes%±
Conservative Hilary Frances Carrick 1,031 63.8 +13.8
Liberal Democrat Virginia Christine Taylor 574 28.3 -5.6
Turnout 1,617 35.9 +1.3
Conservative hold Swing

Penrith Rural

Penrith Rural (1 seat)
PartyCandidateVotes%±
Conservative David Whipps 888 51.3 -22.6
Independent Michael Christopher Tonkin 405 23.4 n/a
Liberal Democrat Lorna Ann Baker 290 16.8 -6.8
Green Wade Tidbury 143 8.3
Turnout 1,731 37.9 +6.6
Conservative hold Swing

Penrith West

Penrith West (1 seat)
PartyCandidateVotes%±
Conservative Helen Jane Fearon 507 40.6 +7.8
Liberal Democrat Judith Margaret Derbyshire 319 25.6 -4.2
Independent Lee Quinn 260 16.8 n/a
Labour Dave Knaggs 160 12.8 +2.9
Turnout 1,248 28.9 +5.1
Conservative hold Swing

South Lakeland

Cartmel

Cartmel (1 seat)
PartyCandidateVotes%±
Liberal Democrat Sue Sanderson 1,111 53.4 -14.0
Conservative Steve Chambers 873 42.0 +9.9
Green Robin Smallwood Le Mare 94 4.5 n/a
Turnout 2,080 50.8 +7.7
Liberal Democrat hold Swing

Grange

Grange (1 seat)
PartyCandidateVotes%±
Conservative Bill Wearing 1,318 62.0 +3.1
Liberal Democrat Dave Khan 586 27.6 -11.9
Labour Nicola Kennedy 135 6.3 n/a
Green Laura Miller 83 3.9 n/a
Turnout 2,126 47.4 +7.1
Conservative hold Swing

High Furness

High Furness (1 seat)
PartyCandidateVotes%±
Conservative Matt Brereton 1,059 48.4 +11.9
Liberal Democrat David William Norman Fletcher 798 36.5 -2.8
Labour Gerry Scott 222 10.2 +1.6
Green Chris Loynes 103 4.7 n/a
Turnout 2,186 48.8 +5.9
Conservative gain from Liberal Democrat Swing

Kendal Castle

Kendal Castle (1 seat)
PartyCandidateVotes%±
Liberal Democrat Chris Hogg 1,267 57.9 -14.7
Conservative Harry James Albert Taylor 703 32.1 +14.6
Labour Jim Ring 133 6.1 -3.3
Green Gwen Harrison 83 3.8 n/a
Turnout 2,188 46.0 +7.9
Liberal Democrat hold Swing

Kendal Highgate

Kendal Highgate (1 seat)
PartyCandidateVotes%±
Liberal Democrat Geoff Cook 922 53.9 -4.9
Conservative Emma Therese Marie Hines 426 24.9 +15.9
Labour Paul Braithwaite 251 14.8 -5.2
Green Phil Whiting 107 6.3 n/a
Turnout 1,710 37.7 +6.6
Liberal Democrat hold Swing

Kendal Nether

Kendal Nether (1 seat)
PartyCandidateVotes%±
Liberal Democrat Shirley Amelia Evans 1,234 60.0 -4.7
Conservative Pamela Mary Flitcroft 531 25.8 +5.8
Labour Eli Aldridge 188 9.1 -5.6
Green Andy Mason 100 4.9 n/a
Turnout 2,056 43.2 +9.4
Liberal Democrat hold Swing

Kendal South

Kendal South (1 seat)
PartyCandidateVotes%±
Liberal Democrat Brenda Clare Gray 1,195 48.5 -14.6
Conservative Andrew John Lucas 1,025 41.6 +13.0
Labour Jackson Softley Stubbs 131 5.3 -2.5
Green Meg Hill 109 4.4 n/a
Turnout 2,463 52.0 +8.0
Liberal Democrat hold Swing

Kendal Strickland and Fell

Kendal Strickland and Fell (1 seat)
PartyCandidateVotes%±
Liberal Democrat Peter Carlyle Thornton 1,170 54.6 +2.5
Conservative Michael Patrick Nicholson 443 20.7 +10.5
Labour Virginia Elizabeth Branney 353 16.5 -13.4
Green Ian Rodham 167 7.8 n/a
Turnout 2,141 44.2 +6.0
Liberal Democrat hold Swing

Kent Estuary

Kent Estuary (1 seat)
PartyCandidateVotes%±
Liberal Democrat Ian Stewart 1,422 52.9 -10.9
Conservative Tom Harvey 995 37.0 +8.1
Green Jill Abel 162 6.0 n/a
Labour Lois Katherine Sparling 103 3.8 -3.0
Turnout 2,686 52.4 +7.6
Liberal Democrat hold Swing

Lakes

Lakes (1 seat)
PartyCandidateVotes%±
Liberal Democrat Will Clark 782 52.9 -1.8
Conservative Tim Brown 564 38.2 -0.2
Labour Alison Faith Gilchrist 79 5.3 -1.2
Green Chris Rowley 49 3.3 n/a
Turnout 1,477 46.3 +3.2
Liberal Democrat hold Swing

Lower Kentdale

Lower Kentdale (1 seat)
PartyCandidateVotes%±
Conservative Roger Kenneth Bingham 1,715 69.6 +10.1
Liberal Democrat Gordon Victor Higton 510 20.7 -7.3
Labour Paul John Casson 139 5.6 +0.0
Green Simon Blunden 97 3.9 n/a
Turnout 2,463 52.4 -4.3
Conservative hold Swing

Lyth Valley

Lyth Valley (1 seat)
PartyCandidateVotes%±
Conservative James Bland 1,247 65.0 +3.6
Liberal Democrat Bex Cooper 530 27.6 -0.2
Green Adam Mark Rubinstein 99 5.2 n/a
UKIP Stephen Willmott 43 2.2 -8.3
Turnout 1,919 47.5 +5.5
Conservative hold Swing

Sedbergh and Kirkby Lonsdale

Sedbergh and Kirkby Lonsdale (1 seat)
PartyCandidateVotes%±
Liberal Democrat Nick Cotton 1,253 48.7 -2.2
Conservative Kevin John Lancaster 1,163 45.2 -2.6
Labour Nick Cross 91 3.5 n/a
Green Daphne Mary Jackson 60 2.3 n/a
Turnout 2,571 55.1 +5.6
Liberal Democrat hold Swing

Ulverston East

Ulverston East (1 seat)
PartyCandidateVotes%±
Labour John Mark Wilson 758 46.0 -3.2
Conservative Helen Irving 620 37.6 -6.0
Liberal Democrat Andrew Hudson 168 10.2 -0.8
Green Bob Gerry 98 6.0 -2.8
Turnout 1,647 36.3 +10.0
Labour hold Swing

Ulverston West

Ulverston West (1 seat)
PartyCandidateVotes%±
Conservative James Airey 1,146 54.9 +8.6
Labour Co-op David John Webster 552 26.5 -4.4
Liberal Democrat Loraine Birchall 235 11.3 +7.9
Green Judy Filmore 149 7.1 +1.2
Turnout 2,086 45.9 +6.3
Conservative hold Swing

Upper Kent

Upper Kent (1 seat)
PartyCandidateVotes%±
Liberal Democrat Stan Collins 1,104 51.9 -15.7
Conservative Margaret Bond 756 35.5 +4.3
Green Adrian Robert Porter 158 7.4 n/a
Labour Andy Windsor 109 5.1 n/a
Turnout 2,129 46.1 +10.9
Liberal Democrat hold Swing

Windermere

Windermere (1 seat)
PartyCandidateVotes%±
Conservative Ben Berry 1,097 47.9 +29.3
Liberal Democrat Steve Rooke 1,009 44.1 -17.8
Labour Penny Henderson 124 5.4 +1.7
Green Kate Threadgold 58 2.5 n/a
Turnout 2,290 48.2 +8.1
Conservative gain from Liberal Democrat Swing

Related Research Articles

2009 Cumbria County Council election

An election to Cumbria County Council took place on 2 May 2013 as part of the United Kingdom local elections, 2009. All 84 councillors were elected from various electoral divisions, which returned one or two county councillors each by first-past-the-post voting for a four-year term of office. They coincided with an election for the European Parliament. All 84 seats in the Council were up for election, and a total of 301 candidates stood. The total number of people registered to vote was 392,931. Prior to the election local Conservatives were leading a coalition with the Liberal Democrats with the Labour party as the council's official opposition.

1981 United Kingdom local elections

Local elections were held in the United Kingdom in May 1981. The results were a mid-term setback for the Conservative government, which lost 1,193 seats, leaving them with 10,545 councillors. The projected share of the vote was more respectable for the government, however: Labour 41%, Conservatives 38%, Liberals 17%. This was in spite of opinion polls showing a much wider Labour lead over the Conservatives. These were the first elections to be contested by Labour under the leadership of Michael Foot, who had succeeded James Callaghan in late 1980.

2013 Cumbria County Council election

An election to Cumbria County Council took place on 2 May013 as part of the United Kingdom local elections, 2013. All 84 councillors were elected from electoral divisions which returned one county councillor each by first-past-the-post voting for a four-year term of office. Following an electoral review carried out by the Local Government Boundary Commission for England, newly drawn electoral divisions were used without change in the number of county councillors.

2017 Nottinghamshire County Council election

The 2017 Nottinghamshire County Council election took place on 4 May 2017 as part of the 2017 local elections in the United Kingdom. The whole council of 66 councillors was elected for a four-year term spanning 56 electoral divisions, a minority of which return two councillors. The voting system used is first-past-the-post.

2017 Derbyshire County Council election

An election to Derbyshire County Council took place on 4 May 2017 as part of the United Kingdom local elections, 2017. 64 councillors were elected from 61 electoral divisions which returned either one or two county councillors each by first-past-the-post voting for a four-year term of office. No elections were held in the City of Derby, which is a unitary authority outside the area covered by the County Council. The Conservative Party won back control of the council, taking thirty-seven of the authority's sixty-four seats.

2017 Dorset County Council election

The 2017 Dorset County Council election took place on 4 May 2017 as part of the 2017 local elections in the United Kingdom. All 46 councillors were elected from 40 electoral divisions, which returned either one or two county councillors each by first-past-the-post voting for a four-year term of office.

2017 Cambridgeshire County Council election

The 2017 Cambridgeshire County Council election was held on 4 May 2017 as part of the 2017 local elections in the United Kingdom. All 61 councillors were elected from 59 electoral divisions, which returned either one or two county councillors each by first-past-the-post voting for a four-year term of office.

2017 East Sussex County Council election

The 2017 East Sussex County Council election took place on 4 May 2017 as part of the 2017 local elections in the United Kingdom. All councillors were to be elected from electoral divisions by first-past-the-post voting for a four-year term of office.

2017 Hertfordshire County Council election

The 2017 Hertfordshire County Council election took place on 4 May 2017 as part of the 2017 local elections in the United Kingdom. All 78 councillors were elected from electoral divisions which returned one county councillor each by first-past-the-post voting for a four-year term of office.

2017 Kent County Council election

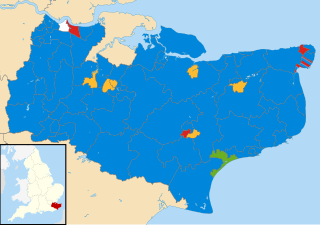
The 2017 Kent County Council election was held on 4 May 2017 as part of the 2017 local elections in the United Kingdom. All 81 councillors were elected, from 72 electoral divisions, each of which returned either one or two county councillors by first-past-the-post voting for a four-year term of office.

2017 Leicestershire County Council election

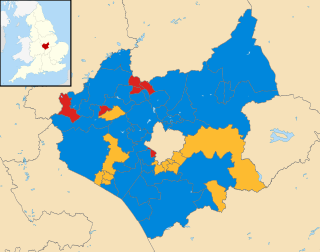
The 2017 Leicestershire County Council election took place on 4 May 2017 as part of the 2017 local elections in the United Kingdom. All councillors were elected from electoral divisions by first-past-the-post voting for a four-year term of office.

2017 Lincolnshire County Council election

The 2017 Lincolnshire County Council election took place in non-metropolitan Lincolnshire on 4 May 2017 as part of the 2017 local elections in the United Kingdom. A total of 70 councillors were elected from each of the seven district councils that make up non-metropolitan Lincolnshire from 70 one member electoral divisions by first-past-the-post voting for a four-year term of office. The election did not include North Lincolnshire and North East Lincolnshire as they are separate unitary authorities.

2017 Staffordshire County Council election

The 2017 Staffordshire County Council election took place on 4 May 2017 as part of 2017 local elections in the UK. All 62 councillors were elected from electoral divisions for a four-year term of office. The system used is first-past-the-post voting.

2017 Surrey County Council election

The 2017 Surrey County Council election took place as part of the 2017 local elections in the UK. All 81 councillors were elected for single-member electoral divisions for a four-year term. The electoral system used is first-past-the-post voting.

2017 Warwickshire County Council election

The 2017 Warwickshire County Council election took place as part of the 2017 local elections in the UK. All 57 councillors were elected for single-member electoral divisions for a four-year term. The voting system used was first-past-the-post.

2017 West Sussex County Council election

The 2017 West Sussex County Council election took place as part of the 2017 local elections in the UK. All councillors were elected for single-member electoral divisions for a four-year term. The voting system used was first-past-the-post.

2017 Worcestershire County Council election

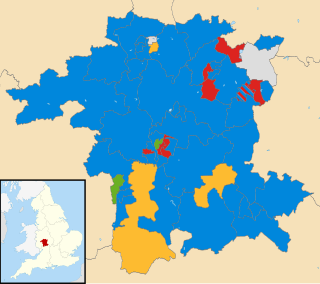
The 2017 Worcestershire County Council election took place on 4 May 2017 as part of the 2017 local elections in the United Kingdom. All 57 councillors were elected from 53 electoral divisions which returned either one or two county councillors each by first-past-the-post voting for a four-year term of office. The Conservatives extended their majority in the council, gaining ten seats, largely at the expense of Labour and UKIP, who lost six seats between them; the Conservative majority increased from one seat to eleven. The number of seats for the Liberal Democrats and Green remained the same, with the Conservatives gaining the remaining five seats from independent politicians and candidates from smaller parties. The Conservatives lost one seat, Alvechurch, to an independent. The Liberals lost their only seat, St Chads in the Wyre Forest district, after they decided not to field any candidates; the Liberal Democrats held the seat, however. UKIP lost all their seats in this election to the Conservatives.

2017 Cornwall Council election

The 2017 Cornwall Council election was held on 4 May 2017 as part of the 2017 local elections in the United Kingdom. 122 councillors were elected from the 121 electoral divisions of Cornwall Council, which returned either one or two councillors each by first-past-the-post voting for a four-year term of office. Although originally scheduled to take place on the same day, the election in the Bodmin St Petroc ward was countermanded following the death of Liberal Democrat candidate Steve Rogerson and was held on 8 June.

2017 Northumberland County Council election

The 2017 Northumberland County Council election took place on 4 May 2017 as part of the 2017 local elections in the United Kingdom. All 67 councillors were elected from 66 electoral divisions which will return either one or two county councillors each by first-past-the-post voting for a four-year term of office.

References

  1. "Upcoming elections & referendums". Electoral Commission. Retrieved 15 September 2016.
  2. "Cumbria County Council election results 2017". Cumbria County Council. 2017-05-05. Retrieved 2017-05-08.