The fifth election to the Powys County Council since local government reorganization in Wales in 1995 was held on 4 May 2017. [1] It was preceded by the 2012 election and will be followed by the 2022 election.
Powys County Council is the local authority for Powys, one of the administrative areas of Wales. County Hall is located in Llandrindod Wells.
Party | Seats | Gains | Losses | Net gain/loss | Seats % | Votes % | Votes | +/− | |
---|---|---|---|---|---|---|---|---|---|
Independent | 30 | –18 | 31.2 | 11974 | –20.7 | ||||
Conservative | 19 | +9 | 33.8 | 12971 | +15.0 | ||||
Liberal Democrat | 13 | +4 | 19.3 | 7398 | +0.2 | ||||
Labour | 7 | +1 | 6.2 | 2377 | –2.9 | ||||
Plaid Cymru | 2 | +2 | 4.5 | 1730 | +4.2 | ||||
Green | 1 | +1 | 4.5 | 1706 | +4.5 | ||||
Christian | 0 | n/a | 0.5 | 196 | +0.2 |
Sixteen seats were uncontested and, in one of these seats, Yscir, no one stood at all for the seat (the only ward in Wales where this happened). [2]
Party | Candidate | Votes | % | ± | |
---|---|---|---|---|---|
Labour | Sarah Louise Williams* | unopposed | |||
Labour hold | Swing |
Party | Candidate | Votes | % | ± | |
---|---|---|---|---|---|
Independent | Karen Elizabeth Laurie-Parr | 248 | 44.2 | ||
Independent | Stephen Davies* | 227 | 40.5 | ||
Liberal Democrat | Gareth Roberts | 84 | 15.0 | ||
Majority | 21 | 3.7 | |||
Turnout | 561 | 54% | |||
Independent gain from Independent | Swing | ||||
Party | Candidate | Votes | % | ± | |
---|---|---|---|---|---|
Independent | Jeremy David Pugh | 432 | 53.3 | ||
Labour | Ashley Vivian Offa | 375 | 46.2 | ||
Majority | 57 | 7.1 | |||
Turnout | 811 | 43% | |||
Independent gain from Independent | Swing | ||||
Party | Candidate | Votes | % | ± | |
---|---|---|---|---|---|
Liberal Democrat | Kathryn Susan Silk* | unopposed | |||
Liberal Democrat hold | Swing |
Party | Candidate | Votes | % | ± | |
---|---|---|---|---|---|
Liberal Democrat | John Gerwyn Morris* | 601 | 53.9 | ||
Independent | Sam Games | 507 | 45.5 | ||
Majority | 94 | 8.4 | |||
Turnout | 1114 | 48% | |||
Liberal Democrat hold | Swing |
Party | Candidate | Votes | % | ± | |
---|---|---|---|---|---|
Labour | Sandra Christine Davies* | unopposed | |||
Labour hold | Swing |
Party | Candidate | Votes | % | ± | |
---|---|---|---|---|---|
Liberal Democrat | Roger Hugh Williams | 377 | 58.7 | ||
Conservative | Martin Robert Like | 206 | 32.1 | ||
Independent | James Pryce | 58 | 9.0 | ||
Majority | 171 | 26.6 | |||
Turnout | 642 | 60% | |||
Liberal Democrat gain from Independent | Swing | ||||
Party | Candidate | Votes | % | ± | |
---|---|---|---|---|---|
Conservative | James Evans | 414 | 67.2 | ||
Independent | Geraint George Hopkins* | 193 | 31.3 | ||
Majority | 221 | 35.9 | |||
Turnout | 616 | 51% | |||
Conservative gain from Independent | Swing | ||||
The sitting member had previously stood as a Conservative.
Party | Candidate | Votes | % | ± | |
---|---|---|---|---|---|
Liberal Democrat | Gareth William Ratcliffe* | 488 | 71.1 | ||
Conservative | Robert Golesworthy | 196 | 28.6 | ||
Majority | 292 | 42.5 | |||
Turnout | 686 | 56% | |||
Liberal Democrat hold | Swing |
Party | Candidate | Votes | % | ± | |
---|---|---|---|---|---|
Independent | David Rowland Price* | unopposed | |||
Independent hold | Swing |
Party | Candidate | Votes | % | ± | |
---|---|---|---|---|---|
Liberal Democrat | Jackie Charlton | 230 | 51.8 | ||
Conservative | Harry Russell Legge-Bourke | 183 | 41.2 | ||
Independent | Nicolas Alan Shugar | 31 | 7.0 | ||
Majority | 47 | 10.6 | |||
Turnout | 444 | 58% | |||
Liberal Democrat hold | Swing |
Party | Candidate | Votes | % | ± | |
---|---|---|---|---|---|
Green | Emily Victoria Durrant | 173 | 35.7 | ||
Conservative | Clancy Jane Brett | 157 | 32.4 | ||
Independent | Melanie Jade Brookes Davies* | 155 | 32.0 | ||
Majority | 16 | 3.3 | |||
Turnout | 485 | 54% | |||
Green gain from Independent | Swing | ||||
Party | Candidate | Votes | % | ± | |
---|---|---|---|---|---|
Independent | Rosemarie Harris* | unopposed | |||
Independent hold | Swing |
Party | Candidate | Votes | % | ± | |
---|---|---|---|---|---|
Independent | Timothy John Van-Rees* | unopposed | |||
Independent hold | Swing |
Party | Candidate | Votes | % | ± | |
---|---|---|---|---|---|
Independent | Edwin Roderick | unopposed | |||
Independent hold | Swing |
Party | Candidate | Votes | % | ± | |
---|---|---|---|---|---|
Labour Co-op | David William Meredith* | 312 | 46.8 | ||
Independent | Martin Weale | 182 | 27.3 | ||
Independent | Steve Morgans | 153 | 23.0 | ||
Green | Frances Elizabeth Christley | 10 | 1.5 | ||
Majority | 130 | 19.5 | |||
Turnout | 666 | 52% | |||
Labour Co-op hold | Swing |
Party | Candidate | Votes | % | ± | |
---|---|---|---|---|---|
Labour Co-op | Matthew James Dorrance* | 1008 | 73.7 | ||
Conservative | Iain Charles McIntosh | 302 | 22.1 | ||
Green | Alexandra Helen Ham | 51 | 3.7 | ||
Majority | 706 | 51.6 | |||
Turnout | 1368 | 57% | |||
Labour Co-op hold | Swing |
Party | Candidate | Votes | % | ± | |
---|---|---|---|---|---|
Conservative | Sarah Rachel Lewis | 485 | 41.0 | ||
Liberal Democrat | Sam Bennett | 321 | 27.2 | ||
Labour | Ieuan Williams | 246 | 20.8 | ||
Green | Gren Ham | 119 | 10.1 | ||
Majority | 164 | 13.8 | |||
Turnout | 1182 | 54% | |||
Conservative gain from Liberal Democrat | Swing | ||||
Party | Candidate | Votes | % | ± | |
---|---|---|---|---|---|
Liberal Democrat | William Denston Powell* | 520 | 83.0 | ||
Labour | Ryan Dixon | 95 | 15.2 | ||
Majority | 425 | 67.8 | |||
Turnout | 627 | 47% | |||
Liberal Democrat hold | Swing |
Party | Candidate | Votes | % | ± | |
---|---|---|---|---|---|
Independent | Liam Fitzpatrick* | unopposed | |||
Independent hold | Swing |
Party | Candidate | Votes | % | ± | |
---|---|---|---|---|---|
Labour | David Arnold Thomas* | unopposed | |||
Labour hold | Swing |
Party | Candidate | Votes | % | ± | |
---|---|---|---|---|---|
Labour | Susan McNicholas* | unopposed | |||
Labour hold | Swing |
No nominations received. [3]
The postponed poll took place on 22 June 2017 and was won by the Conservative Iain McIntosh. [4]
Party | Candidate | Votes | % | ± | |
---|---|---|---|---|---|
Conservative | Iain McIntosh | 165 | 30.3 | ||
Independent | Chris Davies | 144 | 26.4 | ||
Plaid Cymru | Kate Heneghan | 101 | 18.5 | ||
Green | Bethan Irwin | 80 | 14.7 | ||
Independent | Daniel Evans | 2 | 11.3 | ||
Independent | Steve Davies | 2 | 0.3 | ||
Majority | 21 | 3.86 | |||
Turnout | 544 | ??% | |||
Conservative gain from Independent | Swing | ||||
Party | Candidate | Votes | % | ± | |
---|---|---|---|---|---|
Labour | David Huw Williams | unopposed | |||
Labour gain from Independent | Swing | ||||
*= sitting councillor prior to the election
Party | Candidate | Votes | % | ± | |
---|---|---|---|---|---|
Independent | Myfanwy Catherine Alexander* | 257 | 60.0 | ||
Plaid Cymru | Dafydd Morgan Lewis | 170 | 39.7 | ||
Majority | 37 | 20.3 | |||
Turnout | 428 | 52% | |||
Independent hold | Swing |
Party | Candidate | Votes | % | ± | |
---|---|---|---|---|---|
Independent | David Edward Davies* | 327 | 55.2 | ||
Conservative | Phil Bettley | 228 | 38.5 | ||
Liberal Democrat | Alan Roger Burch | 34 | 5.7 | ||
Majority | 99 | 16.7 | |||
Turnout | 592 | 53% | |||
Independent hold | Swing |
Party | Candidate | Votes | % | ± | |
---|---|---|---|---|---|
Conservative | Phyl Davies | 443 | 51.7 | ||
Liberal Democrat | Marion Ilyd Brench | 185 | 21.6 | ||
Independent | Andrew David Capel | 128 | 14.9 | ||
Green | Pam Williams | 86 | 10.0 | ||
Majority | 258 | 30.1 | |||
Turnout | 847 | 45% | |||
Conservative hold | Swing |
Party | Candidate | Votes | % | ± | |
---|---|---|---|---|---|
Conservative | Les George | 673 | 62.4 | ||
Green | Pippa Pemberton | 217 | 20.1 | ||
Liberal Democrat | David John Collington | 137 | 12.7 | ||
Majority | 456 | 42.3 | |||
Turnout | 1029 | 57% | |||
Conservative gain from Independent | Swing | ||||
Party | Candidate | Votes | % | ± | |
---|---|---|---|---|---|
Independent | Michael John Jones* | unopposed | |||
Independent hold | Swing |
Party | Candidate | Votes | % | ± | |
---|---|---|---|---|---|
Conservative | Gareth Michael Pugh | 553 | 69.0 | ||
Independent | Leon Karl Shearer | 243 | 30.3 | ||
Majority | 310 | 38.7 | |||
Turnout | 802 | 48% | |||
Conservative hold | Swing |
Party | Candidate | Votes | % | ± | |
---|---|---|---|---|---|
Independent | Linda Veronica Corfield* | 286 | 51.5 | ||
Conservative | Gwyneth Bird | 266 | 47.9 | ||
Majority | 20 | 3.6 | |||
Turnout | 555 | 48% | |||
Independent hold | Swing |
Party | Candidate | Votes | % | ± | |
---|---|---|---|---|---|
Plaid Cymru | Elwyn Graham Vaughan | 458 | 54.3 | ||
Conservative | Calum Tudor James Davies | 380 | 45.0 | ||
Majority | 78 | 9.2 | |||
Turnout | 844 | 52% | |||
Plaid Cymru gain from Independent | Swing | ||||
Party | Candidate | Votes | % | ± | |
---|---|---|---|---|---|
Independent | David Richard Jones* | 413 | 48.8 | ||
Conservative | Ian Harrison | 360 | 42.6 | ||
Liberal Democrat | Jennifer Susan Pratt | 71 | 8.4 | ||
Majority | 53 | 6.3 | |||
Turnout | 846 | 45% | |||
Independent hold | Swing |
Party | Candidate | Votes | % | ± | |
---|---|---|---|---|---|
Independent | Kathryn Mary Roberts-Jones* | 406 | 57.0 | ||
Conservative | Paul David Martin | 304 | 42.7 | ||
Majority | 102 | 12.1 | |||
Turnout | 712 | 45% | |||
Independent hold | Swing |
Party | Candidate | Votes | % | ± | |
---|---|---|---|---|---|
Conservative | Diane Jones-Poston | 218 | 47.7 | ||
Plaid Cymru | Angharad Mair Butler | 144 | 31.5 | ||
Independent | Dai Charles Jones* | 94 | 20.6 | ||
Majority | 74 | 16.2 | |||
Turnout | 457 | 59% | |||
Conservative hold | Swing |
Party | Candidate | Votes | % | ± | |
---|---|---|---|---|---|
Conservative | Robert Karl Lewis | 277 | 44.4 | ||
Independent | Mike Harris | 261 | 41.8 | ||
Green | David Christopher Williams | 43 | 6.9 | ||
Plaid Cymru | William Anthony McAllister-Lovatt | 41 | 6.6 | ||
Majority | 16 | 2.6 | |||
Turnout | 624 | 55% | |||
Conservative gain from Independent | Swing | ||||
Party | Candidate | Votes | % | ± | |
---|---|---|---|---|---|
Conservative | Lucy Margaret Roberts | 573 | 74.2 | ||
Liberal Democrat | Dave Edwards | 198 | 25.6 | ||
Majority | 375 | 48.6 | |||
Turnout | 772 | 45% | |||
Conservative gain from Independent | Swing | ||||
Party | Candidate | Votes | % | ± | |
---|---|---|---|---|---|
Independent | Evan Arwel Jones* | 367 | 65.2 | ||
Conservative | Mat Edwards | 198 | 35.2 | ||
Majority | 169 | 30.0 | |||
Turnout | 563 | 39% | |||
Independent hold | Swing |
Party | Candidate | Votes | % | ± | |
---|---|---|---|---|---|
Independent | Gareth David Jones | 502 | 88.5 | ||
Green | Jenifer Margaret Elizabeth Trythall | 64 | 11.3 | ||
Majority | 438 | 77.2 | |||
Turnout | 567 | 43% | |||
Independent gain from Independent | Swing | ||||
Party | Candidate | Votes | % | ± | |
---|---|---|---|---|---|
Independent | Emyr Jones | 228 | 42.1 | ||
Independent | Pamela Jane James | 130 | 24.0 | ||
Conservative | Nick Powell | 118 | 21.8 | ||
Plaid Cymru | Gary Adrian Northeast | 63 | 11.6 | ||
Majority | 98 | 18.1 | |||
Turnout | 541 | 60% | |||
Independent gain from Independent | Swing | ||||
Party | Candidate | Votes | % | ± | |
---|---|---|---|---|---|
Conservative | Peter Edward Lewis* | 312 | 66.1 | ||
Green | Richard Howard Chaloner | 159 | 33.7 | ||
Majority | 153 | 32.4 | |||
Turnout | 472 | 39% | |||
Conservative hold | Swing |
The sitting member had previously stood as an independent.
Party | Candidate | Votes | % | ± | |
---|---|---|---|---|---|
Liberal Democrat | Gareth Morgan* | 608 | 61.2 | ||
Conservative | Pam Smith | 229 | 23.1 | ||
Green | Graham Frederick Brand | 87 | 8.8 | ||
Independent | Graham John McArthur | 67 | 6.7 | ||
Majority | 379 | 38.2 | |||
Turnout | 993 | 45% | |||
Liberal Democrat gain from Independent | Swing | ||||
Party | Candidate | Votes | % | ± | |
---|---|---|---|---|---|
Conservative | Aled Wyn Davies* | 625 | 78.1 | ||
Green | Steve Jones | 173 | 21.6 | ||
Majority | 452 | 56.5 | |||
Turnout | 800 | 44% | |||
Conservative hold | Swing |
Party | Candidate | Votes | % | ± | |
---|---|---|---|---|---|
Conservative | Robert Gwynfor Thomas* | 476 | 61.4 | ||
Liberal Democrat | Christopher Richards | 180 | 23.2 | ||
Independent | Berwyn Davies | 116 | 15.0 | ||
Majority | 296 | 38.2 | |||
Turnout | 775 | 49% | |||
Conservative hold | Swing |
Party | Candidate | Votes | % | ± | |
---|---|---|---|---|---|
Plaid Cymru | Bryn Peryddon Davies | 192 | 47.9 | ||
Conservative | Simon Robert Maurice Baynes | 159 | 39.7 | ||
Green | Jenny Matthews | 31 | 7.7 | ||
Independent | Darren Mayor* | 17 | 4.2 | ||
Majority | 33 | 8.2 | |||
Turnout | 401 | 44% | |||
Plaid Cymru gain from Independent | Swing | ||||
Party | Candidate | Votes | % | ± | |
---|---|---|---|---|---|
Independent | John Michael Williams* | unopposed | |||
Independent hold | Swing |
Party | Candidate | Votes | % | ± | |
---|---|---|---|---|---|
Conservative | Jonathan Wilkinson | unopposed | |||
Conservative gain from Independent | Swing | ||||
Party | Candidate | Votes | % | ± | |
---|---|---|---|---|---|
Independent | Stephen Murray Hayes* | 327 | 70.3 | ||
Green | Jeremy David Thorp | 138 | 29.7 | ||
Majority | 189 | 40.6 | |||
Turnout | 465 | 42% | |||
Independent hold | Swing |
Party | Candidate | Votes | % | ± | |
---|---|---|---|---|---|
Conservative | Daniel Mark Rowlands | 449 | 59.7 | ||
Liberal Democrat | Derry Quinlan | 213 | 28.3 | ||
Plaid Cymru | Roy Allan Norris | 87 | 11.6 | ||
Majority | 236 | 31.4 | |||
Turnout | 752 | 42% | |||
Conservative gain from Liberal Democrat | Swing | ||||
Party | Candidate | Votes | % | ± | |
---|---|---|---|---|---|
Conservative | Mark Antony Barnes | 311 | 45.2 | ||
Liberal Democrat | Peter Leslie Hough | 247 | 35.9 | ||
Plaid Cymru | Emyr Sean Poole | 87 | 12.6 | ||
Independent | Richard John White | 39 | 5.7 | ||
Majority | 64 | 9.3 | |||
Turnout | 688 | 47% | |||
Conservative hold | Swing |
Party | Candidate | Votes | % | ± | |
---|---|---|---|---|---|
Liberal Democrat | David Mark Selby | 369 | 54.3 | ||
Conservative | Rupert James Taylor | 309 | 45.5 | ||
Majority | 60 | 8.8 | |||
Turnout | 679 | 30% | |||
Liberal Democrat gain from Conservative | Swing | ||||
The sitting member had previously stood as a Liberal Democrat.
Party | Candidate | Votes | % | ± | |
---|---|---|---|---|---|
Independent | Joy Rachel Jones* | unopposed | |||
Independent gain from Liberal Democrat | Swing | ||||
Party | Candidate | Votes | % | ± | |
---|---|---|---|---|---|
Conservative | Alan Neil Morrison | 203 | 54.7 | ||
Plaid Cymru | Richard Gerard Edwards | 109 | 29.4 | ||
Independent | Sharon Evans | 58 | 15.6 | ||
Majority | 94 | 25.3 | |||
Turnout | 371 | 29% | |||
Conservative gain from Independent | Swing | ||||
Party | Candidate | Votes | % | ± | |
---|---|---|---|---|---|
Independent | Heulwen Doreen Hulme | 343 | 34.8 | ||
Conservative | Ann Lewis | 324 | 33.1 | ||
Plaid Cymru | Stella Ann Jones | 313 | 32.8 | ||
Majority | 19 | 1.9 | |||
Turnout | 986 | 58% | |||
Independent gain from Independent | Swing | ||||
Party | Candidate | Votes | % | ± | |
---|---|---|---|---|---|
Conservative | Amanda Jenner | 227 | 54.3 | ||
Independent | Jessica Bradley | 185 | 44.3 | ||
Majority | 42 | 10.0 | |||
Turnout | 418 | 38% | |||
Conservative gain from Independent | Swing | ||||
Party | Candidate | Votes | % | ± | |
---|---|---|---|---|---|
Independent | Philip Charles Pritchard* | 160 | 41.8 | ||
Liberal Democrat | Richard Wilfred Church | 143 | 37.3 | ||
Conservative | Desmond Parkinson | 78 | 20.4 | ||
Majority | 17 | 4.4 | |||
Turnout | 383 | 36% | |||
Independent hold | Swing |
Party | Candidate | Votes | % | ± | |
---|---|---|---|---|---|
Liberal Democrat | Francesca Helen Jump* | 240 | 36.9 | ||
Conservative | Ruth Marian Canning | 197 | 30.3 | ||
Independent | Stephen Thomas Kaye | 144 | 22.2 | ||
Plaid Cymru | David Hugh Senior | 66 | 10.2 | ||
Majority | 43 | 6.6 | |||
Turnout | 650 | 33% | |||
Liberal Democrat hold | Swing |
Party | Candidate | Votes | % | ± | |
---|---|---|---|---|---|
Independent | Graham Charles Breeze* | 536 | 81.3 | ||
Liberal Democrat | Folkert Ferdinand Veenstra | 117 | 17.8 | ||
Majority | 419 | 63.6 | |||
Turnout | 659 | 37% | |||
Independent hold | Swing |
*= sitting councillor prior to the election
Party | Candidate | Votes | % | ± | |
---|---|---|---|---|---|
Independent | Rachel Powell | 353 | 58.3 | ||
Independent | Alan Cecil Watson | 252 | 41.7 | ||
Majority | 101 | 16.7 | |||
Turnout | 616 | 54 | |||
Independent gain from Independent | Swing | ||||
Party | Candidate | Votes | % | ± | |
---|---|---|---|---|---|
Conservative | Gwilym Ioan Snead Williams* | 377 | 64.6 | ||
Liberal Democrat | Chris Newton | 157 | 26.9 | ||
Green | Dorienne Julia Robinson | 50 | 8.7 | ||
Majority | 220 | 37.7 | |||
Turnout | 588 | 56 | |||
Conservative hold | Swing |
Party | Candidate | Votes | % | ± | |
---|---|---|---|---|---|
Liberal Democrat | James Gibson-Watt* | 725 | 66.9 | ||
Conservative | Alan Hood | 358 | 33.1 | ||
Majority | 367 | 33.9 | |||
Turnout | 1087 | 59 | |||
Liberal Democrat hold | Swing |
The sitting member had previously stood as an independent.
Party | Candidate | Votes | % | ± | |
---|---|---|---|---|---|
Independent | Ange Williams | 659 | 68.6 | ||
Conservative | Peter James Medlicott* | 302 | 31.4 | ||
Majority | 357 | 37.1 | |||
Turnout | 967 | 42 | |||
Independent gain from Independent | Swing | ||||
Party | Candidate | Votes | % | ± | |
---|---|---|---|---|---|
Independent | Martin Jonathan Weale | 274 | 52.9 | ||
Independent | John Powell* | 192 | 37.1 | ||
Labour | Mike Sivier | 52 | 10.0 | ||
Majority | 82 | 15.8 | |||
Turnout | 523 | 57 | |||
Independent gain from Independent | Swing | ||||
Party | Candidate | Votes | % | ± | |
---|---|---|---|---|---|
Independent | Jon Williams | 123 | 29.1 | ||
Independent | Keith Francis Tampin* | 95 | 22.5 | ||
Green | Chris Carmichael | 91 | 21.6 | ||
Conservative | Christopher John Hartley | 73 | 17.3 | ||
Independent | David Dennis Markinson | 21 | 5.0 | ||
Christian | Brian Makusha | 19 | 4.5 | ||
Majority | 28 | 6.6 | |||
Turnout | 424 | 44 | |||
Independent gain from Independent | Swing | ||||
The sitting member had previously stood as an independent.
Party | Candidate | Votes | % | ± | |
---|---|---|---|---|---|
Conservative | Gary David Price* | 360 | 53.8 | ||
Green | Benjamin Fredrick Webb | 177 | 26.5 | ||
Labour | John Francis Mason | 132 | 19.7 | ||
Majority | 183 | 27.4 | |||
Turnout | 676 | 44 | |||
Conservative gain from Independent | Swing | ||||
Party | Candidate | Votes | % | ± | |
---|---|---|---|---|---|
Liberal Democrat | Peter David Roberts | 272 | 34.1 | ||
Conservative | Tom Turner* | 248 | 31.1 | ||
Christian | Jeff Green | 177 | 22.2 | ||
Labour | Grace Kathleen Davis | 100 | 12.5 | ||
Majority | 24 | 3.0 | |||
Turnout | 802 | 50 | |||
Liberal Democrat gain from Conservative | Swing | ||||
Party | Candidate | Votes | % | ± | |
---|---|---|---|---|---|
Liberal Democrat | Maureen Mackenzie* | 326 | 66.5 | ||
Conservative | Andrew Charles Stuart Baker | 164 | 33.5 | ||
Majority | 162 | 33.1 | |||
Turnout | 491 | 50 | |||
Liberal Democrat hold | Swing |
Party | Candidate | Votes | % | ± | |
---|---|---|---|---|---|
Independent | Hywel Lewis* | 350 | 60.3 | ||
Conservative | Edmund Richard Hayward | 230 | 39.7 | ||
Majority | 120 | 20.1 | |||
Turnout | 586 | 54 | |||
Independent hold | Swing |
Party | Candidate | Votes | % | ± | |
---|---|---|---|---|---|
Conservative | Claire Victoria Mills | 291 | 53.6 | ||
Independent | Les Davies | 125 | 23.0 | ||
Labour | Elspeth Madeleine Parris | 57 | 10.5 | ||
Green | Jane Elizabeth Fey Cooke | 37 | 6.8 | ||
Independent | Geraint Evans | 33 | 6.1 | ||
Majority | 166 | 30.6 | |||
Turnout | 543 | 55 | |||
Conservative gain from Independent | Swing | ||||
Party | Candidate | Votes | % | ± | |
---|---|---|---|---|---|
Independent | David Owen Evans* | 434 | 75.7 | ||
Independent | Donald Wilfred Jenkins | 139 | 24.3 | ||
Majority | 295 | 51.5 | |||
Turnout | 578 | 48 | |||
Independent hold | Swing |
Party | Candidate | Votes | % | ± | |
---|---|---|---|---|---|
Independent | Evan Michael Jones* | unopposed | |||
Independent hold | Swing |
The sitting member had previously stood as a Liberal Democrat.
Party | Candidate | Votes | % | ± | |
---|---|---|---|---|---|
Independent | Beverley Jayne Baynham | 785 | 65.2 | ||
Independent | Wendy Anne Toomey | 219 | 18.2 | ||
Independent | Garry Richard Banks* | 200 | 16.6 | ||
Majority | 566 | 47.0 | |||
Turnout | 1227 | 56 | |||
Independent gain from Independent | Swing | ||||
Party | Candidate | Votes | % | ± | |
---|---|---|---|---|---|
Liberal Democrat | Kelvyn Watson Curry* | 555 | 80.4 | ||
Conservative | Catrin Minshull | 135 | 19.6 | ||
Majority | 420 | 60.9 | |||
Turnout | 693 | 43 | |||
Liberal Democrat hold | Swing |
*= sitting councillor prior to the election
The 2007 St Albans City and District Council election took place on 3 May 2007 to elect members of St Albans District Council in Hertfordshire, England. One third of the council was up for election and the Liberal Democrats lost overall control of the council to no overall control.
The Cardiff Council election in 2008 was held on 1 May, along with other local elections in the UK. All 75 seats of Cardiff Council were contested, with it remaining in no overall control. It was preceded by the 2004 election and followed by the 2012 election
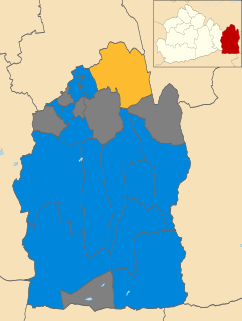
The 2010 Tandridge District Council election took place on 6 May 2010 to elect members of Tandridge District Council in Surrey, England. One third of the council was up for election and the Conservative party stayed in overall control of the council.
The Glamorgan County Council election, 1904 was the sixth contest for seats on this authority. It was preceded by the 1901 election and followed by the 1907 election. Glamorgan was by far the largest county in Wales in terms of population. Glamorgan County Council had been established by the 1888 Local Government Act, and the first elections held in early 1889. The county of Glamorgan was at this time becoming heavily industrialised, although some areas such as the Vale of Glamorgan remained essentially rural. The rise of nonconformist liberalism, especially since the 1860s, throughout Wales, had challenged the prevailing influence of the landed gentry. However, even in 1889, the traditional forces remained influential and no working men were elected to the Council.
The fifth election to the Carmarthenshire County Council was held on 1 May 2012. It was preceded by the 2008 election and was followed by the 2017 election. Plaid Cymru won 28 seats whilst Labour and the Independents won 23 each. The main feature of the election was a Labour recovery in the Llanelli area, and to some extent in the Gwendraeth and Ammanford area also, mainly at the expense of Independent candidates. Plaid Cymru lost ground to Labour in the Llanelli area but gained seats elsewhere, becoming the largest party. An Independent-Labour coalition was again formed, but with Labour as the leading partner. As a result, Kevin Madge replaced Meryl Gravell as the leader of the council.
The 2014 Craven District Council election took place on 22 May 2014 to elect members of Craven District Council in North Yorkshire, England. One third of the council was up for election and the Conservative party stayed in overall control of the council.
The 2003 West Oxfordshire District Council election took place on 1 May 2003 to elect members of West Oxfordshire District Council in Oxfordshire, England. One third of the council was up for election and the Conservative party stayed in overall control of the council.
The 2014 West Oxfordshire District Council election took place on 22 May 2014 to elect members of West Oxfordshire District Council in Oxfordshire, England. One third of the council was up for election and the Conservative party stayed in overall control of the council.
The fourth election to the Powys County Council since local government reorganization in Wales in 1995 was held on 1 May 2012. It was preceded by the 2008 election and will be followed by the 2017 election. The Independent group retained a majority on the authority
The 2016 Woking Borough Council election took place on 5 May 2016 to elect members of Woking Borough Council in England. This was on the same day as other elections across the UK and the Police and Crime Commissioner election for Surrey Police.
Local elections were held in Wales on Thursday 4 May 2017 to elect members of all 22 local authorities, including the Isle of Anglesey, which was last up for election in 2013 due to having its elections delayed for a year. These local elections were held alongside local elections in Scotland and parts of England.
The 2017 Highland Council election was held on 4 May 2017 to elect members of Highland Council. The election used the 21 wards created under the Local Governance (Scotland) Act 2004; each ward elected three or four councillors using the single transferable vote system. A total of 74 councillors were elected, six less than in 2012.
Jane Dodds is the Leader of the Welsh Liberal Democrats, having been elected in 2017. She is also the party's Westminster candidate for Brecon and Radnorshire.
Glasbury is the name of an electoral wards in central Powys, Wales. It covers the community of Glasbury as well as the neighbouring communities of Clyro and Painscastle. The ward elects a county councillor to Powys County Council.
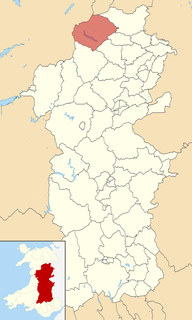
Llanwddyn is the name of an electoral wards in the far north of Powys, Wales. It covers the community of Llanwddyn as well as the neighbouring communities of Llangynog and Pen-y-Bont-Fawr. The ward elects a county councillor to Powys County Council.
The 2018 Sunderland City Council election took place on 3 May 2018 to elect members of Sunderland City Council in England. The election took place on the same day as other local elections.
Newtown Central is the name of an electoral ward in the town of Newtown, Powys, Wales.
Talybont-on-Usk is the name of an electoral ward in the south of Powys, Wales. It covers three local government communities and elects a councillor to Powys County Council.
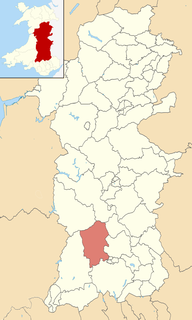
Yscir is the name of an electoral ward in southern Powys, Wales. It covers three local government communities and elects a councillor to Powys County Council.
The 2019 Breckland District Council election will take place on 2 May 2019 to elect members of Breckland District Council in England. This will be on the same day as other local elections. The boundaries for this election will be the same as those used in 2015.