Buckinghamshire County Council election, 2017

Last updated
Buckinghamshire County Council election, 2017

Flag of Buckinghamshire.svg


  2013 4 May 20172021 

All 49 seats to Buckinghamshire County Council
25 seats needed for a majority

 First partySecond party
 
Party Conservative Liberal Democrat
Last election41
Seats before3651
Seats won43
Seat change+5-1+2

Buckinghamshire UK local election 2017 map.svg

Map showing the results of the 2017 Buckinghamshire County Council elections.

Council control before election

Conservative

Council control after election

Conservative

The 2017 Buckinghamshire County Council election took place on 4 May 2017 as part of the 2017 local elections in the United Kingdom. [1] All 49 councillors were elected from electoral divisions which returned one county councillor each by first-past-the-post voting for a four-year term of office, due to expire in 2021.

Buckinghamshire County Council upper-tier local authority for the non-metropolitan county of Buckinghamshire, in England

Buckinghamshire County Council is the upper-tier local authority for the non-metropolitan county of Buckinghamshire, in England, the United Kingdom established in 1889 following the Local Government Act 1888. The county council's offices are in Aylesbury.

The wards and electoral divisions in the United Kingdom are electoral districts at sub-national level represented by one or more councillors. The ward is the primary unit of English electoral geography for civil parishes and borough and district councils, electoral ward is the unit used by Welsh principal councils, while the electoral division is the unit used by English county councils and some unitary authorities. Each ward/division has an average electorate of about 5,500 people, but ward-population counts can vary substantially. As at the end of 2014 there were 9,456 electoral wards/divisions in the UK.

Contents

The Conservative Party retained an overall control on the council, winning 41 of the 49 seats on the council. Of the remaining 9 councillors, there were four Liberal Democrats, three Independents and one Labour. UKIP lost all six of their seats.

Result

Buckinghamshire County Council Election Result 2017 [2]
PartySeatsGainsLossesNet gain/lossSeats %Votes %Votes+/−
  Conservative 4161+583.6853.1372,070+12.08%
  Liberal Democrat 423-18.1618.6325,276+3.72%
 East Wycombe Independents220+24.081.532,079+1.53%
  Labour 11102.0413.6118,469+2.16%
  Independent 10002.043.524,773+1.48%
  UKIP 006-60.006.058,204-20.94%
  Green 00000.003.534,794+1.82%

The overall turnout was 34.8% with a total of 135,665 valid votes cast.

Council Composition

Following the last election in 2013 the composition of the council was:

366511
ConservativesUKIPLib DemsLI


After the election, the composition of the council was:

414211
ConservativesLib DemsEWILI


Lib Dems - Liberal Democrats
L - Labour Party
I - Independent
EWI - East Wycombe Independents

Ward results

Asterisks denote incumbent Councillors seeking re-election. Councillors seeking re-election were elected in 2013, and results are compared to that year's polls on that basis. All results are listed below: [3]

Abbey

Abbey
PartyCandidateVotes%±
Conservative Lesley Mary Clarke*1,22450.6+3.3
Labour Mohammed Rafiq80133.1+9.2
Liberal Democrat Tasmin Nicola Holkham1988.2+1.9
UKIP Bob Harris1104.5-18.1
Green Neil James Denham873.6
Majority42317.5-5.9
Turnout 2,42032.6+8.5
Conservative hold Swing

Amersham & Chesham Bois

Amersham & Chesham Bois
PartyCandidateVotes%±
Conservative Gareth David Williams1,76358.9+7.4
Liberal Democrat Walid Marzouk84428.2+11.3
Labour Alexander Damien Rhys2598.6-1.0
UKIP Freda Margaret Stevens1294.3-17.7
Majority91930.7+1.2
Turnout 2,99539.3+8.5
Conservative hold Swing

Aston Clinton & Bierton

Aston Clinton & Bierton
PartyCandidateVotes%±
Conservative Bill Chapple*1,76559.7+20.5
Liberal Democrat Mark Frederick Willis37012.5-3.5
UKIP Geoff Baile32811.1-25.3
Labour Mike Butcher30710.4+2.0
Green Coral Simpson1886.4
Majority1,39547.2+44.5
Turnout 2,95838.9+3.7
Conservative hold Swing

Aylesbury East

Aylesbury East
PartyCandidateVotes%±
Conservative Julie Elizabeth Ward1,37443.7+13.5
Liberal Democrat Allison Jayne Harrison86227.4+6.8
UKIP Phil Gomm*43213.7-21.9
Labour Damien Marie Bishop35511.3-1.3
Green Andy Capjon1223.9
Majority51216.3+10.9
Turnout 3,14538.6+2.9
Conservative gain from UKIP Swing

Aylesbury North

Aylesbury North
PartyCandidateVotes%±
Liberal Democrat Raj Wali Khan*1,06640.6+7.0
Conservative Ammer Raheel57722.0+1.8
Labour Gary Paxton49218.7-2.2
UKIP Paul Hobbs31412.0-13.3
Green Colin Norman Bloxham1766.7
Majority48918.6+10.2
Turnout 2,62531.0+3.4
Liberal Democrat hold Swing

Aylesbury North West

Aylesbury North West
PartyCandidateVotes%±
Liberal Democrat Martin Paul Farrow65829.8+3.9
Conservative Graham Moore54224.5+10.1
Labour John Anthony Cowell50122.7+7.8
UKIP Andy Huxley*43619.7-25.1
Green Huseyin Caglayan723.3
Majority1165.3-13.6
Turnout 2,20925.3+0.7
Liberal Democrat gain from UKIP Swing

Aylesbury South East

Aylesbury South East
PartyCandidateVotes%±
Conservative Brian Keith Roberts*1,46853.5+13.6
Liberal Democrat Richard Gordon Lloyd49918.2+3.6
Labour Ansar Gulzar39414.4+1.3
UKIP Heather Adams2489.0-19.0
Green Nigel Antony Foster1354.9
Majority96935.3+23.4
Turnout 2,74432.0+3.3
Conservative hold Swing

Aylesbury South West

Aylesbury South West
PartyCandidateVotes%±
Liberal Democrat Niknam Hussain85134.7+2.1
Labour Mark Trevor Bateman68928.1+9.0
Conservative Sophie Elizabeth Vaughan-Evans52621.5+10.3
UKIP Brian Adams*33013.5-21.6
Green Mark Wheeler552.2
Majority1626.6+4.1
Turnout 2,45131.9+4.7
Liberal Democrat gain from UKIP Swing

Aylesbury West

Aylesbury West
PartyCandidateVotes%±
Liberal Democrat Steven Michale Lambert1,36255.8+14.2
Conservative Peter William Ward52221.4+6.4
Labour Carmel Traynor32213.2+1.5
UKIP Debbie Huntley2379.7-22.0
Majority84034.4+24.5
Turnout 2,44331.4+4.1
Liberal Democrat hold Swing

Beaconsfield

Beaconsfield
PartyCandidateVotes%±
Conservative Alan Martin Walters1,82870.1+9.5
Liberal Democrat Peter Jeffrey Chapman42416.3+3.0
Labour Nigel Paul Vickery1796.9
UKIP Tim Scott1756.7-19.5
Majority1,40453.8+19.4
Turnout 2,60631.7+4.1
Conservative hold Swing

Bernwood

Bernwood
PartyCandidateVotes%±
Conservative Clive Harriss1,48247.4+3.4
Green David Richard Lyons96530.9+18.1
Labour Alison Duncan Watt49715.9+0.2
UKIP Colin Evered1845.9-15.8
Majority51716.5-5.8
Turnout 3,12839.9+4.8
Conservative hold Swing

Booker, Cressex & Castlefield

Booker, Cressex & Castlefield
PartyCandidateVotes%±
Labour Majid Hussain1,60844.9+16.6
Conservative Zahir Mohammed*1,59744.6-0.5
Liberal Democrat Jenese Jacquelyn Joseph2065.8-1.6
UKIP Maria Delores Busby1694.7-8.1
Majority110.3-18.5
Turnout 3,58041.6+4.3
Labour gain from Conservative Swing

Buckingham East

Buckingham East
PartyCandidateVotes%±
Conservative Warren Whyte*1,32655.9+11.7
Labour Jon Simon Harvey50621.3-2.4
Liberal Democrat Anja Schaefer2018.5+3.9
Green Nicola Smith1205.1
UKIP Nick Shipp1195.0-22.5
Independent Leah Yeoman994.2
Majority82024.6+7.8
Turnout 2,37133.2+8.8
Conservative hold Swing

Buckingham West

Buckingham West
PartyCandidateVotes%±
Conservative Charlie Clare1,59350.0+11.8
Labour Robin Stuchbury*1,36642.9+2.9
Liberal Democrat David George Evershed1243.9-1.2
Green Elliot John Settle1033.2
Majority2277.1+5.2
Turnout 3,18639.4+7.4
Conservative gain from Labour Swing

Chalfont St Giles

Chalfont St Giles
PartyCandidateVotes%±
Conservative Timothy Richard Butcher1,77860.9+15.3
Liberal Democrat Sally Elizabeth Ash62321.3+13.2
UKIP David George Meacock2307.9-29.7
Labour Tim Starkey1695.8-3.0
Green Philip John Wall1214.1
Majority1,15539.6+31.6
Turnout 2,92134.9+5.2
Conservative hold Swing

Chalfont St Peter

Chalfont St Peter
PartyCandidateVotes%±
Conservative David John Francis Martin2,00970.5+15.1
Liberal Democrat Daniel Paul Gallagher55519.5+13.4
Labour Julian Darley1495.2-1.3
UKIP Andrew John Glen1384.8-27.2
Majority1,45451.0+27.6
Turnout 2,85134.6+1.7
Conservative hold Swing

Chesham

Chesham
PartyCandidateVotes%±
Conservative Mark Wayne Shaw*1,70456.4+19.7
Labour Graham Simon Gardner66822.1-5.1
Liberal Democrat Frances Catherine Van Ijzendoorn52617.4+5.8
UKIP Richard George Ness1214.0-15.0
Majority1,03634.3+24.8
Turnout 3,01940.9+4.3
Conservative hold Swing

Chess Valley

Chess Valley
PartyCandidateVotes%±
Conservative Noel Lawrence Brown*1,55752.3+4.8
Liberal Democrat Davina Joy Kirby68222.9+7.5
Labour North Pyper38813.0+2.7
Green Gillian Walker2217.4-0.2
UKIP Timothy James Matthews1304.4-14.7
Majority87529.4+1.0
Turnout 2,97839.0+7.5
Conservative hold Swing

Chiltern Ridges

Chiltern Ridges
PartyCandidateVotes%±
Conservative Patricia Mary Birchley*1,81549.8+13.0
Liberal Democrat Mohammad Fayyaz1,23233.8+17.0
Labour Barbara Ann Hunter2446.7+2.0
Green Alan John Gray Booth1754.8-2.7
UKIP Richard Neal Phoenix1754.8-29.4
Majority58316.0+13.4
Turnout 3,64144.4+4.1
Conservative hold Swing

Chiltern Villages

Chiltern Villages
PartyCandidateVotes%±
Conservative Jean Elizabeth Teesdale*2,31874.9+17.3
Green Peter James Sims47615.4
Labour Jacqui Jacques2999.7+0.1
Majority1,84259.5+25.8
Turnout 3,09335.9+7.7
Conservative hold Swing

Cliveden

Cliveden
PartyCandidateVotes%±
Conservative Dev Dhillon*1,21553.8+13.1
Liberal Democrat Jane Wallis32514.4+6.6
Labour Alexa Anne Collins30913.7+0.7
Independent Edwina Jane Glover24911.0
UKIP Graham Geoffrey Smith1607.1-31.4
Majority89039.4+37.2
Turnout 2,25830.0+2.7
Conservative hold Swing

Denham

Denham
PartyCandidateVotes%±
Conservative Roger William Reed*1,20858.2+4.8
Liberal Democrat Andy Milburn29214.1+4.7
UKIP John Shearme26712.9-24.3
Labour Charlotte Louise Hall1567.5
Green Robert Michael Smith1517.3
Majority91644.1+27.9
Turnout 2,07428.2+3.4
Conservative hold Swing

Downley

Downley
PartyCandidateVotes%±
Conservative Wendy Janet Mallen1,31450.7+7.9
Labour Mohammed Hanif75729.2-1.3
Liberal Democrat Ray Farmer40915.8+6.3
UKIP John Gregory McCollough1124.3-13.0
Majority55721.5+9.2
Turnout 2,59232.2+0.5
Conservative hold Swing

Farnham Common & Burnham Beeches

Farnham Common & Burnham Beeches
PartyCandidateVotes%±
Conservative Lin Hazell*1,47666.2+7.0
Liberal Democrat Carol Lesley Linton46320.8+8.7
Labour Janet Violet Sjogren1496.7
UKIP Susan Ann Fagan1406.3-22.4
Majority1,01345.4+14.9
Turnout 2,22830.9+4.0
Conservative hold Swing

Flackwell Heath, Little Marlow & Marlow South East

Flackwell Heath, Little Marlow & Marlow South East
PartyCandidateVotes%±
Conservative David Martyn Watson*1,76567.2+16.8
Liberal Democrat Paul Michael Anthony Burden40915.6+6.9
Labour Helen Elizabeth Ingram27210.4+1.8
UKIP John Albert Gooding1806.9-15.5
Majority1,35651.6+23.6
Turnout 2,62631.3+5.8
Conservative hold Swing

Gerrards Cross

Gerrards Cross
PartyCandidateVotes%±
Conservative Barbara Lynn Gibbs1,22157.3+10.1
Independent Christopher Stuart Brown58427.4+4.0
Liberal Democrat Diane Margaret Holden2019.4+4.2
Labour Michael Anthony Kavanagh1265.9
Majority63729.9+14.1
Turnout 2,13231.5+3.8
Conservative hold Swing

Great Brickhill

Great Brickhill
PartyCandidateVotes%±
Conservative Janet Blake*1,94962.5+12.1
Liberal Democrat Dave Frearson46915.0+3.2
Labour Maxine Myatt2999.6
UKIP Amy Howitt2187.0-30.7
Green Deborah Lovatt1825.8
Majority1,48047.5+34.8
Turnout 3,11735.2+2.4
Conservative hold Swing

Great Missenden

Great Missenden
PartyCandidateVotes%±
Conservative Peter Ernest Charles Martin1,97462.8+25.1
Liberal Democrat Ruth Juett51216.3+12.2
Green Jennifer Sarah Brazil2758.7
Labour Benjamin Thomas Davies2317.3+1.2
UKIP Alan Peter Stevens*1514.8-35.9
Majority1,46246.5+43.5
Turnout 3,14340.1+2.8
Conservative gain from UKIP Swing

Grendon Underwood

Grendon Underwood
PartyCandidateVotes%±
Conservative Angela MacPherson*1,90965.4+23.5
Liberal Democrat Jules Newman40213.8+5.0
Labour Jennifer Ann Tuffley2478.5-1.5
Green Clare Elisabeth Butler1916.5-0.8
UKIP Jason Wise1705.8-27.3
Majority1,50751.6+42.8
Turnout 2,91934.8+3.8
Conservative hold Swing

Hazlemere

Hazlemere
PartyCandidateVotes%±
Conservative Katrina Suzanne Atkins Wood*1,63268.0+22.0
Liberal Democrat Ian Forbes32413.5+5.4
Labour Rosie Paola Greco25410.6+1.6
UKIP Philip John Whitehead1907.9-29.0
Majority1,30854.5+45.4
Turnout 2,40032.6+3.7
Conservative hold Swing

Iver

Iver
PartyCandidateVotes%±
Conservative Luisa Katherine Sullivan1,35762.0+16.9
Green Leigh Martin Tugwood35316.1
Labour Richard James Griggs24611.2
UKIP Paul Dreelan1265.8-18.4
Liberal Democrat Jeff Herschel1084.9-25.8
Majority1,00445.9+11.5
Turnout 2,19026.8+0.3
Conservative hold Swing

Ivinghoe

Ivinghoe
PartyCandidateVotes%±
Conservative Anne Wight1,54848.1+13.1
Liberal Democrat Avril Cutland Davies*1,31440.8+2.7
Green Johanna Wheeler2016.2
Labour Nina Dluzewska1554.8-2.3
Majority2347.3+4.2
Turnout 3,21839.5+6.2
Conservative gain from Liberal Democrat Swing

Little Chalfont & Amersham Common

Little Chalfont & Amersham Common
PartyCandidateVotes%±
Conservative Martin Anthony Tett*1,76260.4+7.2
Liberal Democrat Sue Jordan67523.1+10.0
Labour Susan Procter30210.4+1.4
UKIP Christopher Worley Radcliffe Cooke1776.1-18.5
Majority1,09737.3+8.7
Turnout 2,91638.5+9.3
Conservative hold Swing

Marlow

Marlow
PartyCandidateVotes%±
Conservative Alex Collingwood2,10763.7+6.2
Liberal Democrat Mark Andrew Skoyles83225.2+12.6
Labour George William Alderman2236.7-2.5
UKIP Paddy Gallaugher1464.4-16.2
Majority1,27538.51.6
Turnout 3,30840.1+8.8
Conservative hold Swing

Penn Wood & Old Amersham

Penn Wood & Old Amersham
PartyCandidateVotes%±
Conservative Isobel Anne Darby2,24769.7+14.8
Liberal Democrat Richard Neil Williams57017.7+7.1
Labour Ruth Werbiski Dutton2297.1-0.7
UKIP Liam David Noble1785.5-21.2
Majority1,67752.0+19.6
Turnout 3,22438.6+6.2
Conservative hold Swing

Ridgeway East

Ridgeway East
PartyCandidateVotes%±
Conservative David James Carroll*2,23868.8+19.6
Liberal Democrat Graeme Peter Card56217.3+11.5
Labour Linda Mary Ruth Derrick3139.6+2.8
UKIP Vijay Singh Srao1404.3-33.9
Majority1,67651.5+41.5
Turnout 3,25338.7+6.5
Conservative hold Swing

Ridgeway West

Ridgeway West
PartyCandidateVotes%±
Conservative Carl Alexander Arvid Etholen*1,91369.5+14.2
Liberal Democrat Candy Piercy49618.0+12.9
Labour Shaharyan Khan1816.6+0.2
UKIP Jonathan Mark Evered1646.0-18.2
Majority1,41751.5+20.4
Turnout 2,75435.2+4.1
Conservative hold Swing

Ryemead & Micklefield

Ryemead & Micklefield
PartyCandidateVotes%±
East Wycombe IndependentJulia Denise Wassell*1,14943.0
Liberal Democrat Trevor Snaith89433.4-20.8
Conservative Neil Stephen Mockley36513.6-2.1
Labour Naveed Javed Akhtar2077.7-7.1
Independent Scott Gavin Ridley602.2
Majority2559.628.9
Turnout 2,67535.0+11.9
East Wycombe Independent gain from Liberal Democrat Swing

Julie Wassell was previously elected as a Liberal Democrat councillor for this ward at the last election.

Stoke Poges & Wexham

Stoke Poges & Wexham
PartyCandidateVotes%±
Conservative Ralph Bagge1,51268.4+15.1
UKIP Karen Perez27812.6-18.0
Labour Rory Andrew Nosworthy2169.8+0.2
Liberal Democrat Christopher Francis Woolley2059.3+2.8
Majority1,23455.8+33.1
Turnout 2,21128.2+3.6
Conservative hold Swing

Stone and Waddesdon

Stone and Waddesdon
PartyCandidateVotes%±
Conservative Paul Irwin*1,62561.9+36.2
Liberal Democrat Rebecca Halifax Beswick38814.8-11.3
Labour Mike Padmore26610.1
UKIP Gary Good1947.4-20.0
Green Greg Smith1535.8
Majority1,23747.1+45.7
Turnout 2,62630.8-5.6
Conservative gain from UKIP Swing

Terriers & Amersham Hill

Terriers & Amersham Hill
PartyCandidateVotes%±
Conservative Arif Hussain1,15749.5-2.2
Liberal Democrat Steve Guy53322.8+10.7
Labour Adam James Coulthard51121.9+3.0
UKIP Linda Rosemary Ann Harris1355.8-11.6
Majority62426.7-6.1
Turnout 2,33630.9+5.8
Conservative hold Swing

The Risboroughs

The Risboroughs
PartyCandidateVotes%±
Conservative Bill Bendyshe-Brown*1,56955.0+18.1
Independent Andy Ball88631.1
Liberal Democrat Ian Patrick Metherell2498.7+6.1
Labour Brian Huw Gammage1485.2-0.6
Majority68323.9+18.2
Turnout 2,85238.1+5.6
Conservative hold Swing

The Wooburns, Bourne End & Hedsor

The Wooburns, Bourne End & Hedsor
PartyCandidateVotes%±
Conservative Mike Appleyard*1,26547.6+1.6
Independent Geoff Howard60622.8
Liberal Democrat Mark Jolliffe40915.4-6.1
Labour Wendy Byrne28710.8-1.0
UKIP John Willoughby Feltrim Fagan933.5-19.2
Majority65924.8+1.5
Turnout 2,66032.3+5.9
Conservative hold Swing

Totteridge & Bowerdean

Totteridge & Bowerdean
PartyCandidateVotes%±
East Wycombe IndependentChaudhary Allah Ditta*93039.9+1.2
Labour Sebert Headley Graham58825.3-2.0
Conservative Alexander James Shayler46620.0+0.4
Liberal Democrat Ben James Holkham34414.8+0.4
Majority34214.6+3.2
Turnout 2,32829.8-2.3
East Wycombe Independent gain from Liberal Democrat Swing

Tylers Green & Loudwater

Tylers Green & Loudwater
PartyCandidateVotes%±
Conservative David Alastair Clifton Shakespeare*1,43860.9+17.4
Liberal Democrat Paula Louise Lee53922.8+4.1
Labour Fariha Khan2078.8-0.8
UKIP Brian James Mapletoft1797.6-20.6
Majority89938.1+22.8
Turnout 2,36328.7+3.0
Conservative hold Swing

Wendover, Halton & Stoke Mandeville

Wendover, Halton & Stoke Mandeville
PartyCandidateVotes%±
Conservative Steve Bowles1,68755.5+31.4
Liberal Democrat Anders Carl Christensen39713.1+9.9
Labour Martin Ian Abel37212.2+6.3
UKIP Chris Adams32610.7-25.6
Green Tom Peter Hodge2568.4+3.5
Majority1,29041.4+30.8
Turnout 3,03837.4+0.8
Conservative gain from UKIP Swing

West Wycombe

West Wycombe
PartyCandidateVotes%±
Independent Darren John Hayday*1,40951.1+20.8
Conservative Tony Green62822.8-1.9
Labour Ghulam Rabani55520.1+4.1
Liberal Democrat Neil Christopher1635.9-2.7
Majority1,18128.3+22.7
Turnout 2,75537.4+9.2
Independent hold Swing

Wing

Wing
PartyCandidateVotes%±
Conservative Netta Glover*1,36643.8+9.4
Independent Peter Aiden Cooper88028.2-1.6
Labour David Christopher Hancock2869.2+2.1
Liberal Democrat Sheila De Rosa2568.2+0.1
UKIP Roger Huntley2096.7-13.9
Green Kumar Bala1193.8
Majority48615.6+11.0
Turnout 3,11635.0+3.5
Conservative hold Swing

Winslow

Winslow
PartyCandidateVotes%±
Conservative John Chilver*1,38946.4+9.3
Liberal Democrat Llew Monger1,25642.0+9.3
Labour Philip Christian Jacques1846.1-0.1
UKIP Niki Adams1635.4-12.5
Majority1334.40.0
Turnout 2,99239.95.3
Conservative hold Swing

Related Research Articles

2009 Suffolk County Council election

Elections to Suffolk County Council were held on 4 June 2009 as part of the 2009 United Kingdom local elections on the same day as the elections to the European Parliament. 75 councillors were elected from 63 electoral divisions, which returned either one or two county councillors each by first-past-the-post voting for a four-year term of office. The electoral divisions were the same as those used at the previous election in 2004.

2009 Buckinghamshire County Council election

Elections to Buckinghamshire County Council took place on 4 June 2009 as part of the United Kingdom local elections, 2009, having been delayed from 7 May, to coincide with elections to the European Parliament.

2012 Cambridge City Council election

Elections for Cambridge City Council were held on Thursday 3 May 2012. One third of the council was up for election and the Liberal Democrats lost overall control of the council, to No Overall Control.

Elections to Buckinghamshire County Council were held on 5 May 2005, alongside the 2005 UK General Election and other local elections in England and Northern Ireland. The entire council was up for election, with each successful candidate serving a four-year term of office, expiring in 2009.

2013 Kent County Council election

The Kent County Council election, 2013 was an election to all 84 seats on Kent County Council held on Thursday 2 May as part of the United Kingdom local elections, 2013. 84 councillors were elected from 72 electoral divisions, which returned either one or two county councillors each by first-past-the-post voting for a four-year term of office. The electoral divisions were the same as those used at the previous election in 2009. No elections were held in Medway, which is a unitary authority outside the area covered by the County Council. The election saw the Conservative Party narrowly retain overall control of the council.

2013 Buckinghamshire County Council election

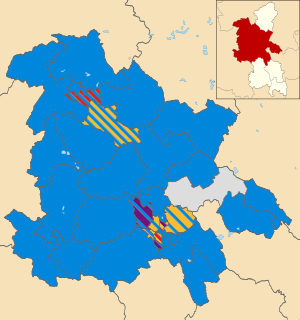
An election to Buckinghamshire County Council took place on 2 May 2013 as part of the United Kingdom local elections, 2013. 49 councillors were elected from electoral divisions which returned one county councillor each by first-past-the-post voting for a four-year term of office. Following a boundary review, the size of the council was reduced from 57 to 49 members for this election. No elections were held in Milton Keynes, which is a unitary authority outside the area covered by the County Council. The council continues to be administered on the Leader and Cabinet model. The Conservative Party won a reduced majority on the council.

2014 Lambeth London Borough Council election

The 2014 Lambeth Council election was held on 22 May 2014 to elect members of Lambeth Council in Greater London, England. This was on the same day as other local elections. The election saw the Labour Party further increase its majority on the council, winning all but four of the 63 council seats.

2014 Calderdale Metropolitan Borough Council election

The 2014 Calderdale Metropolitan Borough Council election took place on 22 May 2014 to elect members of Calderdale Metropolitan Borough Council in England. This was on the same day as local elections across the United Kingdom and a European election. One councillor was elected in each of the 17 wards for a four-year term. There are three councillors representing each ward elected on a staggered basis so one third of the councillor seats were up for re-election. The seats had previously been contested in 2010 which was held in conjunction with a general election. The turnout was significantly lower in 2014 than in 2010 which is not unusual when comparing local elections that coincide with general elections to ones that do not. Prior to the election Labour was the largest party in the council with 21 out of 51 seats, 5 seats short of an overall majority. After the election there was no overall control of the council. Labour had 25 seats, only one short of a majority and so Labour continued to operate a minority administration.

2015 Blackpool Borough Council election

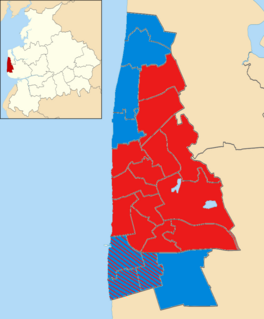
The 2015 Blackpool Borough Council election took place on 7 May 2015 to elect members of Blackpool Borough Council in England. All 21 wards of 2 seats each on the council were contested with newly elected members next due to serve a four-year term and next contest their seats in 2019. The council is made up oThis election took place on the same day as other local elections as well as the 2015 UK General Election.

2015 North East Lincolnshire Council election

The 2015 North East Lincolnshire Council election took place on 7 May 2015 to elect members of North East Lincolnshire Council in England. This was on the same day as other local elections and the general election for the House of Commons of the United Kingdom.


The 2015 Ashfield District Council election took place on 7 May 2015, to elect members of Ashfield District Council in England. This was on the same day as other local elections.

2015 Aylesbury Vale District Council election

The 2015 Aylesbury Vale District Council election took place on 7 May 2015 to elect members of Aylesbury Vale District Council in Buckinghamshire, England. The whole council was up for election with boundary changes since the last election in 2011. The Conservative party remained in overall control of the council.

2011 Thanet District Council election

Elections to elect all members (councillors) of Thanet District Council were held on 5 May 2011, as part of the United Kingdom local elections, 2011 taking place simultaneously with the Alternative Vote Referendum. No political party won an overall majority of seats, meaning that the council went into 'No Overall Control' status for the first time since 1991. The Conservative Party ran a minority administration until December that year, when a Conservative councillor defected to the Independents group, enabling The Labour Party to run a minority administration until 2015. The District has as its main towns the beach resort towns of Ramsgate, Margate and Broadstairs.

2014 West Oxfordshire District Council election

The 2014 West Oxfordshire District Council election took place on 22 May 2014 to elect members of West Oxfordshire District Council in Oxfordshire, England. One third of the council was up for election and the Conservative party stayed in overall control of the council.

2017 Kent County Council election

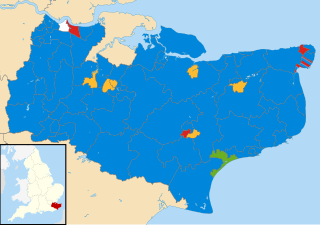
The 2017 Kent County Council election was held on 4 May 2017 as part of the 2017 local elections in the United Kingdom. All 81 councillors were elected, from 72 electoral divisions, each of which returned either one or two county councillors by first-past-the-post voting for a four-year term of office.

2017 Norfolk County Council election

The 2017 Norfolk County Council election took place on 4 May 2017 as part of the 2017 local elections in the United Kingdom.

2017 Northumberland County Council election

The 2017 Northumberland County Council election took place on 4 May 2017 as part of the 2017 local elections in the United Kingdom. All 67 councillors were elected from 66 electoral divisions which will return either one or two county councillors each by first-past-the-post voting for a four-year term of office.

An election to Ceredigion County Council were held on 4 May 2017 as part of wider local elections across Wales. It was preceded by the 2012 election and the next election is scheduled to take place in 2022.

2018 Plymouth City Council election

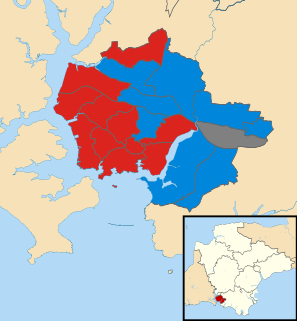
The 2018 Plymouth City Council election took place on 3 May 2018 to elect members of Plymouth City Council in England. The election was won by the Labour Party, who gained enough seats to achieve an overall majority and took control of the council.

References