Dorset County Council election, 2017

Last updated
Dorset County Council election, 2017
Flag of Dorset.svg
  2013 4 May 20172021 

All 46 seats to Dorset County Council
24 seats needed for a majority

  First party Second party
 
Party Conservative Liberal Democrat
Last election 27 seats, 38.9% 12 seats, 18.5%
Seats before 27 13
Seats won 32 11
Seat changeIncrease2.svg 5Decrease2.svg 1
Popular vote 66,959 33,082
Percentage 50.3% 24.9%

  Third party Fourth party
 
Party Green Labour
Last election 0 seats, 3.7% 5 seats, 12.3%
Seats before 1 4
Seats won 2 1
Seat changeIncrease2.svg 2Decrease2.svg 4
Popular vote 7,146 18,607
Percentage 5.4% 14.0%

Dorset UK local election 2017 map.svg

Map of the results of the 2017 Dorset council election.

Council control before election

Conservative

Council control after election

Conservative

The 2017 Dorset County Council election took place on 4 May 2017 as part of the 2017 local elections in the United Kingdom. [1] All 46 councillors were elected from 40 electoral divisions, which returned either one or two county councillors each by first-past-the-post voting for a four-year term of office.

Dorset County Council British administrative body

Dorset County Council (DCC) is the county council for the county of Dorset in England. It provides the upper tier of local government, below which are district councils, and town and parish councils. The county council has 46 elected councillors and is based at County Hall in Dorchester. The council is to be abolished on 31 March 2019 as part of structural changes to local government in Dorset.

The wards and electoral divisions in the United Kingdom are electoral districts at sub-national level represented by one or more councillors. The ward is the primary unit of English electoral geography for civil parishes and borough and district councils, electoral ward is the unit used by Welsh principal councils, while the electoral division is the unit used by English county councils and some unitary authorities. Each ward/division has an average electorate of about 5,500 people, but ward-population counts can vary substantially. As at the end of 2014 there were 9,456 electoral wards/divisions in the UK.

Contents

Boundary changes to the electoral divisions, saw an increase in councillors from 45 to 46 and decrease in electoral wards from 42 to 40, took effect at this election after a review of the county by the Local Government Boundary Commission for England. [2] [3]

The Local Government Boundary Commission for England (LGBCE) is a parliamentary body established by statute to conduct boundary, electoral and structural reviews of local government areas in England. The LGBCE is independent of government and political parties, and is directly accountable to the Speaker's Committee of the House of Commons.

Election result summary

Dorset County Council election, 2017
PartySeatsGainsLossesNet gain/lossSeats %Votes %Votes+/−
  Conservative 32 +5 69.6 50.3 66,959
  Liberal Democrat 11 -1 23.9 24.9 33,082
  Green 2 +2 4.3 5.4 7,146
  Labour 1 -4 2.2 14.0 18,607
  UKIP 0 -1 - 4.7 6,286
  Independent 0 0 - 0.8 1,006

Election result by division

Beaminster

Beaminster
PartyCandidateVotes%±
Conservative Rebecca Knox 2,018
Liberal Democrat Peter James Allen 848
Labour Mark Gage 178
Green Neil Antony Judd 170
Turnout 46.27
Conservative hold Swing

Blackmore Vale

Blackmore Vale
PartyCandidateVotes%±
Conservative Pauline Hannah Batstone 1,980
Liberal Democrat David Tibbles 405
UKIP Bill Woodhouse 209
Labour Robert Zachary Taylor 185
Turnout 39.90
Conservative hold Swing

Blandford Forum

Blandford Forum
PartyCandidateVotes%±
Conservative Byron Robert Quayle 1,086
Liberal Democrat Barrie George Cooper 1,035
Labour Pat Osborne 291
UKIP Jane Mary Unwin 116
Turnout 35.10
Conservative gain from Liberal Democrat Swing

Bridport

Bridport (2 seats)
PartyCandidateVotes%±
Liberal Democrat Ros Kayes 2,490
Conservative Keith Day 2,415
Conservative Mark Roberts 2,244
Liberal Democrat Sarah Horniman 1,840
Green Kevin Clayton 810
Labour Phylida Culpin 783
Labour Bill Mellish 690
Green Robert Casey 490
Turnout 42.69
Liberal Democrat hold Swing
Conservative win (new seat)

Broadwey

Broadwey
PartyCandidateVotes%±
Conservative Kevin Brookes 1,128
Labour Mark Richard Tewkesbury 904
Liberal Democrat Ryan Dean Hope 283
Green David Howard Smith 168
Turnout 35.30
Conservative gain from Labour Swing

Burton Grange

Burton Grange
PartyCandidateVotes%±
Conservative David Charles Jones 1,374
Liberal Democrat Jade Bailey 366
Labour Antoinette Pearce 353
Turnout 27.95
Conservative hold Swing

Chickerell and Chesil Bank

Chickerell and Chesil Bank
PartyCandidateVotes%±
Conservative Jean Dunseith 1,624
Liberal Democrat James Alexander Lane Canning 348
Labour Lynda Ann Kiss 283
Green Carol Rosemary Byrom 226
Turnout 35.30
Conservative hold Swing

Christchurch Central

Christchurch Central
PartyCandidateVotes%±
Conservative Peter Roger Alexander Hall 1,707
Labour Julian Spurr 578
Turnout 30.58
Conservative hold Swing

Colehill East and Stapehill

Colehill East and Stapehill
PartyCandidateVotes%±
Liberal Democrat Janet Dover 1,342
Conservative KD Johnson 1,100
UKIP Paul Graham 217
Labour Ashley Wynne Rowlands 146
Turnout
Liberal Democrat hold Swing

Colehill West and Wimborne Minster

Colehill West and Wimborne Minster
PartyCandidateVotes%±
Liberal Democrat Shane Bartlett 1,190
Conservative Robin David Cook 1,154
Labour Chris Brown 574
UKIP Nick Wellstead 147
Turnout 42.38
Liberal Democrat win (new seat)

Commons

Commons
PartyCandidateVotes%±
Conservative Margaret Phipps 1,789
Liberal Democrat Fiona Cox 467
Labour Peter Stokes 389
Turnout 32.03
Conservative hold Swing

Corfe Mullen

Corfe Mullen
PartyCandidateVotes%±
Liberal Democrat Susan Jefferies 1,603
Conservative Paul Ronald Harrison 1,300
Labour David Peden 127
UKIP David Ewart Mattocks 106
Turnout 39.32
Liberal Democrat hold Swing

Cranborne Chase

Cranborne Chase
PartyCandidateVotes%±
Conservative Steve Butler 1,773
Labour Joanne Margaret Scotton 442
UKIP Cyril John Barnes 148
Turnout 35.58
Conservative hold Swing

Dorchester

Dorchester (2 seats)
PartyCandidateVotes%±
Liberal Democrat Andy Canning 2,871
Liberal Democrat Richard Martin Biggs 2,799
Conservative Gerald Duke 1,781
Conservative Ian Francois Bernard Gosling 1,730
Labour Claudia Catherine Sorin 983
Labour Barry Thompson 775
Green Vicki Black 581
UKIP Geoffrey Robin Markham 311
Green Ken Huggins 265
Turnout 39.24
Liberal Democrat hold Swing

Ferndown

Ferndown (2 seats)
PartyCandidateVotes%±
Conservative Steven Michael Lugg 3,090
Conservative Andrew Charles Parry 2,950
UKIP Lawrence Leslie Ralph Wilson 795
UKIP Peter Jonathan Lucas 657
Liberal Democrat Michael Francis Cox 508
Liberal Democrat Jason Jones 429
Labour David Munnik 244
Labour Ian R Wands 203
Turnout 32.52
Conservative hold Swing

Gillingham

Gillingham (2 seats)
PartyCandidateVotes%±
Conservative David Walsh 2,675
Conservative Andrew Ronald Cattaway 2,368
Liberal Democrat Barry Von Clemens 1,252
Liberal Democrat Graeme Henry Hole 802
Labour Geoff Longcroft 414
UKIP Peter Caulfield 409
UKIP Steve Unwin 348
Labour Clive Edward Struver 344
Turnout 37.50
Conservative hold Swing
Conservative win (new seat)

Hambledon

Hambledon
PartyCandidateVotes%±
Conservative Deborah Croney 1,841
Liberal Democrat Martin Thomas Strange 488
Labour Keith Yarwood 221
UKIP Robert Michael Snow 178
Turnout 35.48
Conservative hold Swing

Linden Lea

Linden Lea
PartyCandidateVotes%±
Liberal Democrat Nick Ireland 1,317
Conservative Peter Jonathon Stein 1,299
Labour Richard Michael Shrubb 198
Green Rebekah Webb 127
Turnout 41.60
Liberal Democrat hold Swing

Lodmoor

Lodmoor
PartyCandidateVotes%±
Conservative Anthony Ferrari 1,702
Liberal Democrat David George Mannings 1,083
Labour Thomas Taylor 392
Green Brian Heatley 183
Turnout 46.20
Conservative gain from Liberal Democrat Swing

Lytchett Minster and Upton

Lytchett Minster and Upton
PartyCandidateVotes%±
Conservative Bill Pipe 1,049
Liberal Democrat Fred Drane 944
UKIP Mike Fry 237
Labour Richard Douglas Jordan 154
Turnout 35.70
Conservative win (new seat)

Marshwood Vale

Marshwood Vale
PartyCandidateVotes%±
Conservative Daryl Turner 1,730
Liberal Democrat Steve Trevethan 538
Labour Joy Everington 284
Green Chit Chong 263
Turnout 40.83
Conservative hold Swing

Moors

Moors (2 seats)
PartyCandidateVotes%±
Conservative Bray Ryan 3,743
Conservative David William Shortell 3,662
UKIP Robin Grey 776
Liberal Democrat Lily Cox 657
Labour Sandra Joy Turner 460
Labour Heather Jean Snow 367
Turnout
Conservative win (new seat)

Mudeford and Highcliffe

Mudeford and Highcliffe
PartyCandidateVotes%±
Conservative Lesley Margaret Dedman 2,582
Labour Carol Ann Wilcox 557
Turnout 40.04
Conservative hold Swing

North West Purbeck

North West Purbeck
PartyCandidateVotes%±
Conservative Peter Kendrick Wharf 1,654
Liberal Democrat John Brian Taylor 890
Labour Stewart Bullen 141
UKIP Josephine Marie Evans 123
Turnout 40.40
Conservative win (new seat)

Portland Harbour

Portland Harbour
PartyCandidateVotes%±
Labour Co-op Kate Wheller 1,282
Conservative Kerry Leanne Baker 879
Green Len Herbert 145
Turnout 33.50
Labour Co-op hold Swing

Portland Tophill

Portland Tophill
PartyCandidateVotes%±
Conservative Katherine Muriel Garcia 995
Labour Co-op Paul Ralph Kimber 923
Green Claudia Lucienne Moore 149
Turnout 32.20
Conservative gain from Labour Co-op Swing

Rodwell

Rodwell
PartyCandidateVotes%±
Green Clare Sutton 1,474
Conservative David Leslie Hastings 901
Labour Matthew John Hall 514
UKIP Jill Ann Hordle 195
Turnout 41.00
Green hold Swing

Shaftesbury

Shaftesbury
PartyCandidateVotes%±
Liberal Democrat Derek Leslie Beer 1,231
Conservative Piers Brown 863
UKIP Lester Geoffrey Taylor 181
Labour Ursula Louise Ann Osborne 114
Independent Lester Mark Dibben 100
Turnout 38.65
Liberal Democrat hold Swing

Sherborne Rural

Sherborne Rural
PartyCandidateVotes%±
Conservative Mary Penfold 1,657
Liberal Democrat Matt Hall 1,535
Green Andrew Martin Spring 130
Turnout 47.25
Conservative gain from Liberal Democrat Swing

Sherborne Town

Sherborne Town
PartyCandidateVotes%±
Liberal Democrat Jon Andrews 1,493
Conservative Robert Andrew Gould 1,471
Labour Nick Boothroyd 126
Green Pam Rosling 103
Turnout 45.57
Liberal Democrat gain from Conservative Swing

South Purbeck

South Purbeck
PartyCandidateVotes%±
Conservative Cherry Louise Brooks 1,135
Independent Nigel Dragon 766
Liberal Democrat Graham Holmes 666
Labour Leigh Van De Zande 205
Turnout 40.90
Conservative win (new seat)

Stalbridge and The Beacon

Stalbridge and The Beacon
PartyCandidateVotes%±
Conservative Graham Carr-Jones 1,879
Liberal Democrat Dorothy Jane Webb 424
UKIP Rory Herbert 235
Labour Richard George Harvey 203
Turnout 39.68
Conservative win (new seat)

Swanage

Swanage
PartyCandidateVotes%±
Conservative William Stanley Trite 1,856
Labour Cherry Ann Bartlett 679
Liberal Democrat Gill Calvin–Thomas 540
Independent Jason Paul Haiselden 140
Turnout 40.60
Conservative hold Swing

Three Valleys

Three Valleys
PartyCandidateVotes%±
Conservative Jill Haynes 1,853
Liberal Democrat David Taylor 720
Green Peter John Barton 349
Labour Janine Miller 301
Turnout 39.28
Conservative hold Swing

Verwood

Verwood (2 seats)
PartyCandidateVotes%±
Conservative Toni Bartley Coombs 3,160
Conservative Spencer Grant Flower 2,878
Liberal Democrat David Lawrence Tooke 820
Green Kate Bisson 545
UKIP John Baxter 527
Labour Christopher John Archibold 387
Labour Peter Thomas Parsons 276
Turnout 33.15
Conservative hold Swing

Walkford

Walkford
PartyCandidateVotes%±
Conservative Colin Jamieson 2,186
Labour Lindsay Turner 516
Turnout 34.81
Conservative win (new seat)

Wareham

Wareham
PartyCandidateVotes%±
Liberal Democrat Beryl Rita Ezzard 1,778
Conservative Laura Jane Miller 1,234
Labour Roy Holliday 185
UKIP Keith Allen Simpson 165
Turnout 44.80
Liberal Democrat hold Swing

Westham

Westham
PartyCandidateVotes%±
Liberal Democrat David Best Harris 1,155
Conservative Shenis Cant 791
Labour Kieron Womble 488
Green James Robert Askew 158
Turnout 35.80
Liberal Democrat hold Swing

Weymouth Town

Weymouth Town
PartyCandidateVotes%±
Green Jon Orrell 810
Conservative Jason Louis Osborne 698
Labour Ann Linda Rosina Weaving 464
Liberal Democrat Christine Mary James 387
UKIP Francis George Drake 206
Turnout 35.40
Green gain from Labour Swing

Winterborne

Winterbourne
PartyCandidateVotes%±
Conservative Hilary Ann Cox 1,527
Liberal Democrat David Charles Thomas Fox 506
Labour Haydn Roger White 284
Turnout 36.01
Conservative hold Swing

Related Research Articles

One-third of Weymouth and Portland District Council in Dorset, England, is elected each year, followed by one year where there is an election to Dorset County Council instead.

East Dorset District Council elections

East Dorset District Council in Dorset, England is elected every four years. Since the last boundary changes in 2015, 29 councillors have been elected from 16 wards.

Milton Keynes is a unitary authority in Buckinghamshire, England. Until 1 April 1997 it was a non-metropolitan district.

2013 Cumbria County Council election

An election to Cumbria County Council took place on 2 May013 as part of the United Kingdom local elections, 2013. All 84 councillors were elected from electoral divisions which returned one county councillor each by first-past-the-post voting for a four-year term of office. Following an electoral review carried out by the Local Government Boundary Commission for England, newly drawn electoral divisions were used without change in the number of county councillors.

2013 Dorset County Council election

An election to Dorset County Council took place on 2 May 2013 as part of the United Kingdom local elections. 45 councillors were elected from 42 electoral divisions, which returned either one or two county councillors each by first-past-the-post voting for a four-year term of office. The electoral divisions were the same as those used at the previous election in 2009. No elections were held in Bournemouth or Poole, which are unitary authorities outside the area covered by the County Council. The election saw the Conservative Party maintain overall control of the council.

2015 West Dorset District Council election

The 2015 West Dorset District Council election took take place on 7 May 2015 to elect members of West Dorset District Council in England. This was on the same day as the general election and other local elections.

West Dorset District Council elections

West Dorset District Council is elected every four years by the first past the post system of election. The council currently consists of 44 councillors, representing 24 electoral divisions. The Conservative Party is currently the largest party on the council, having gained overall control in the 2003 local elections. The council meets at South Walks House in Dorchester, having moved to the new council headquarters in 2014.

2017 Lancashire County Council election

An election to Lancashire County Council took place on 4 May 2017 as part of the 2017 local elections across the UK. All 84 councillors were elected for single-member and dual-member divisions for a four-year term of office. The system of voting used is first-past-the-post. Elections are held in all electoral divisions across the present ceremonial county, excepting Blackpool and Blackburn with Darwen which are unitary authorities.

2017 United Kingdom local elections

The 2017 United Kingdom local elections were held on Thursday 4 May 2017. Local elections were held across Great Britain, with elections to 35 English local authorities and all councils in Scotland and Wales.

2017 Nottinghamshire County Council election

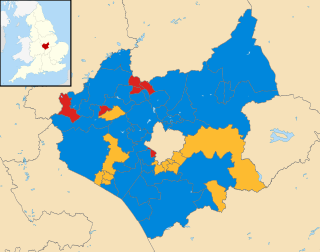
The 2017 Nottinghamshire County Council election took place on 4 May 2017 as part of the 2017 local elections in the United Kingdom. The whole council of 66 councillors was elected for a four-year term spanning 56 electoral divisions, a minority of which return two councillors. The voting system used is first-past-the-post.

2017 Cambridgeshire County Council election

The 2017 Cambridgeshire County Council election was held on 4 May 2017 as part of the 2017 local elections in the United Kingdom. All 61 councillors were elected from 59 electoral divisions, which returned either one or two county councillors each by first-past-the-post voting for a four-year term of office.

2017 East Sussex County Council election

The 2017 East Sussex County Council election took place on 4 May 2017 as part of the 2017 local elections in the United Kingdom. All councillors were to be elected from electoral divisions by first-past-the-post voting for a four-year term of office.

2017 Hampshire County Council election

The 2017 Hampshire County Council election took place on 4 May 2017 as part of the 2017 local elections in the United Kingdom. All councillors were elected from electoral divisions by first-past-the-post voting for a four-year term of office.

2017 Hertfordshire County Council election

The 2017 Hertfordshire County Council election took place on 4 May 2017 as part of the 2017 local elections in the United Kingdom. All 78 councillors were elected from electoral divisions which returned one county councillor each by first-past-the-post voting for a four-year term of office.

2017 Kent County Council election

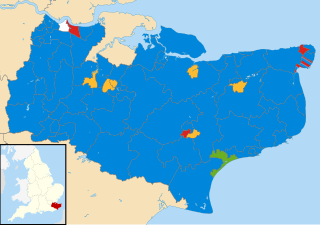
The 2017 Kent County Council election was held on 4 May 2017 as part of the 2017 local elections in the United Kingdom. All 81 councillors were elected, from 72 electoral divisions, each of which returned either one or two county councillors by first-past-the-post voting for a four-year term of office.

2017 Leicestershire County Council election

The 2017 Leicestershire County Council election took place on 4 May 2017 as part of the 2017 local elections in the United Kingdom. All councillors were elected from electoral divisions by first-past-the-post voting for a four-year term of office.

2017 Lincolnshire County Council election

The 2017 Lincolnshire County Council election took place in non-metropolitan Lincolnshire on 4 May 2017 as part of the 2017 local elections in the United Kingdom. A total of 70 councillors were elected from each of the seven district councils that make up non-metropolitan Lincolnshire from 70 one member electoral divisions by first-past-the-post voting for a four-year term of office. The election did not include North Lincolnshire and North East Lincolnshire as they are separate unitary authorities.

2017 Warwickshire County Council election

The 2017 Warwickshire County Council election took place as part of the 2017 local elections in the UK. All 57 councillors were elected for single-member electoral divisions for a four-year term. The voting system used was first-past-the-post.

2017 West Sussex County Council election

The 2017 West Sussex County Council election took place as part of the 2017 local elections in the UK. All councillors were elected for single-member electoral divisions for a four-year term. The voting system used was first-past-the-post.

References

  1. "Upcoming elections & referendums". Electoral Commission. Retrieved 16 September 2016.
  2. "The Dorset (Electoral Changes) Order 2016". legislation.gov.uk. Retrieved 16 September 2016.
  3. "Dorset County Council". Local Government Boundary Commission for England. Retrieved 16 September 2016.