Dorset County Council election, 1977

Last updated

Dorset County Council election, 1977

Flag of Dorset.svg


 19735 May 1977 1981  

 
Party Conservative Independent Labour

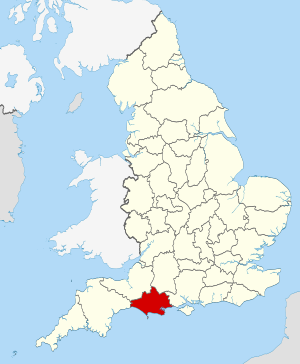
Dorset UK locator map 2010.svg

The County of Dorset within England

Council control before election

Conservative

Council control after election

Conservative

Elections to Dorset County Council were held on Thursday, 5 May 1977. The whole council of ninety-one members was up for election and the result was that the Conservatives comfortably retained their control, winning seventy-nine seats, a gain of nineteen, of which nine were from Labour and seven from the Liberals. Labour, the Liberals, and the Independents ended with only four county councillors each. [1]

Dorset County Council British administrative body

Dorset County Council (DCC) is the county council for the county of Dorset in England. It provides the upper tier of local government, below which are district councils, and town and parish councils. The county council has 46 elected councillors and is based at County Hall in Dorchester. The council is to be abolished on 31 March 2019 as part of structural changes to local government in Dorset.

Conservative Party (UK) Political party in the United Kingdom

The Conservative Party, officially the Conservative and Unionist Party, is a centre-right political party in the United Kingdom. Presently led by Theresa May, it has been the governing party since 2010. It presently has 314 Members of Parliament in the House of Commons, 249 members of the House of Lords, and 18 members of the European Parliament. It also has 31 Members of the Scottish Parliament, 12 members of the Welsh Assembly, eight members of the London Assembly and 9,008 local councillors. One of the major parties of UK politics, it has formed the government on 45 occasions, more than any other party.

The Labour Party is a centre-left political party in the United Kingdom which has been described as an alliance of social democrats, democratic socialists and trade unionists. The party's platform emphasises greater state intervention, social justice and strengthening workers' rights.

Contents

Results

Result of Dorset County Council election, 1977 [1]
PartySeatsGainsLossesNet gain/lossSeats %Votes %Votes+/−
  Conservative 79 19 0 + 19 86.8
  Independent 4 0 3 – 3 4.4
  Labour 4 0 9 – 9 4.4
  Liberal 4 0 7 – 7 4.4

Election result by division

Bournemouth (25 seats)

Bournemouth (Boscombe East)
PartyCandidateVotes%±
Conservative M Green 1,187 85.0
Labour E Hourihane 210 15.0
Turnout 1,397 29.6
Conservative hold Swing
Bournemouth (Boscombe West)
PartyCandidateVotes%±
Conservative R Wotton 1,390 68.3
Independent Conservative H Mears 483 23.7
Labour I Evison 162 8.0
Turnout 2,035 31.5
Conservative hold Swing
Bournemouth (Central)
PartyCandidateVotes%±
Conservative J Williams 1,214 77.2
Liberal J Stone 227 14.4
Labour J Reidy 131 8.3
Turnout 1,572 27.4
Conservative hold Swing
Bournemouth (East Cliff)
PartyCandidateVotes%±
Conservative J Curtis 1,575 87.7
Labour N Howard 220 12.3
Turnout 1,795 30.1
Conservative hold Swing
Bournemouth (Kings Park) (2 seats)
PartyCandidateVotes%±
Conservative E Hollies-Smith 1,748
Conservative D Jenkinson 1,616
Liberal R Beale 498
Liberal B Leake 405
Labour N Copage 311
Turnout 38.2
Conservative hold Swing
Conservative gain from Independent Liberal Swing
Bournemouth (Kinson North) (2 seats)
PartyCandidateVotes%±
Conservative L Cade 1,852
Conservative L Cox 1,609
Residents R Haskell 1,467
Labour R Bennett 1,129
Labour L Bennett 1,124
Liberal D Cobb 619
Turnout 42.4
Conservative gain from Labour Swing
Bournemouth (Kinson South) (2 seats)
PartyCandidateVotes%±
Conservative K Baily 2,188
Conservative G Graham 1,878
Labour G Spicer 1,551
Labour P Brushett 1,377
Turnout 35.7
Conservative gain from Labour Swing
Bournemouth (Moordown North) (2 seats)
PartyCandidateVotes%±
Independent R Whittaker 2,539
Conservative S McQueen 2,122
Labour A Tankard 656
Turnout 46.2
Independent gain from Labour Swing
Conservative hold Swing
Bournemouth (Moordown South)
PartyCandidateVotes%±
Conservative W Sayers 753 46.9
Liberal P Bamborough 643 40.0
Labour N Pankhurst 211 13.1
Turnout 1,607 36.9
Conservative gain from Liberal Swing
Bournemouth (Queens Park) (2 seats)
PartyCandidateVotes%±
Conservative P Hogarth 2,032
Conservative G Knops 1,438
Residents C Dyer 1,270
Residents G Griffiths 683
Labour H Cutler 405
Turnout 33.3
Conservative hold Swing
Bournemouth (Redhill Park) (2 seats)
PartyCandidateVotes%±
Independent Conservative P Whitelegg 2,031
Conservative G Masters 1,762
Conservative B Wallace-Smith 704
Labour W Bishop 240
Labour V Williams 212
Turnout 38.9
Independent Conservative hold Swing
Conservative hold Swing
Bournemouth (Southbourne) (2 seats)
PartyCandidateVotes%±
Conservative E Day 1,971
Conservative B Beckett 1,954
Independent Conservative E Ruston 1,778
Labour D Dykes 390
Turnout 35.3
Conservative hold Swing
Bournemouth (West Cliff) (2 seats)
PartyCandidateVotes%±
Conservative R Judd 1,656
Conservative S Dunscombe 1,633
Residents H Nettleton-Walker 256
Labour A Shead 250
Turnout 30.2
Conservative hold Swing
Bournemouth (West Southbourne)
PartyCandidateVotes%±
Conservative D Scott 1,415 63.7
Liberal D Eyre 637 28.7
Labour W Gaskin 170 7.7
Turnout 2,222 36.8
Conservative hold Swing
Bournemouth (Westbourne) (2 seats)
PartyCandidateVotes%±
Conservative B Bicknell 3,093
Conservative L Pardy 2,891
Labour R Woodley 274
Turnout 37.3
Conservative hold Swing
Bournemouth (Winton)
PartyCandidateVotes%±
Conservative P Haley 1,180 57.2
Labour B Grower 882 42.8
Turnout 2,062 40.7
Conservative gain from Liberal Swing

Christchurch (6 seats)

Christchurch No. 1 (Central)
PartyCandidateVotes%±
Conservative J Richardson 1,041 61.3
Labour T Staniforth 656 38.7
Turnout 1,697 41.7
Conservative hold Swing
Christchurch No. 2 (Highcliffe East)
PartyCandidateVotes%±
Conservative J Beattie unopposed
Conservative hold Swing
Christchurch No. 3 (Highcliffe West)
PartyCandidateVotes%±
Conservative M Williams unopposed
Conservative hold Swing
Christchurch No. 4 (Mudeford)
PartyCandidateVotes%±
Conservative W Freestone unopposed
Conservative hold Swing
Christchurch No. 5
PartyCandidateVotes%±
Conservative D Fox 1,850 83.3
Labour H Blake 372 16.7
Turnout 2,222 30.7
Conservative hold Swing
Christchurch No. 6
PartyCandidateVotes%±
Conservative A Green 1,553 56.3
Labour R Holloway 799 29.0
Liberal B Toms 405 14.7
Turnout 2,757 44.6
Conservative gain from Labour Swing

East Dorset (9 seats)

Ringwood and Fordingbridge
PartyCandidateVotes%±
Conservative J Slater unopposed
Conservative hold Swing
Wimborne and Cranborne No. 1
PartyCandidateVotes%±
Conservative P Hargreaves 1,192 55.7
Residents J Williams 665 31.1
Liberal P Smith 283 13.2
Turnout 2,140 36.2
Conservative hold Swing
Wimborne and Cranborne No. 2
PartyCandidateVotes%±
Conservative W Iremonger 2,773 74.5
Liberal M Herridge 949 25.5
Turnout 3,722 38.4
Conservative hold Swing
Wimborne and Cranborne No. 3
PartyCandidateVotes%±
Conservative A Morgan 1,065 52.2
Residents G Hibbs 828 40.1
Liberal F Goater 149 7.3
Turnout 2,042 42.2
Conservative hold Swing
Wimborne and Cranborne No. 4
PartyCandidateVotes%±
Conservative J Guarella 1,489 68.6
Liberal F Beal 682 31.4
Turnout 2,171 35.4
Conservative gain from Independent Swing
Wimborne and Cranborne No. 5
PartyCandidateVotes%±
Liberal J Bingham unopposed
Liberal hold Swing
Wimborne and Cranborne No. 6
PartyCandidateVotes%±
Conservative M Wicken unopposed
Conservative hold Swing
Wimborne and Cranborne No. 7
PartyCandidateVotes%±
Conservative W Wells 1,236 63.5
Liberal D Bussey 710 36.5
Turnout 1,946 47.4
Conservative gain from Liberal Swing
Wimborne Minster
PartyCandidateVotes%±
Conservative W Tapper unopposed
Conservative hold Swing

North Dorset (7 seats)

Blandford
PartyCandidateVotes%±
Conservative D Trench 1,298 81.2
Labour P Cheater 300 18.8
Turnout 1,598 33.3
Conservative hold Swing
Blandford Rural No. 1
PartyCandidateVotes%±
Conservative C Mitchell unopposed
Conservative hold Swing
Blandford Rural No. 2
PartyCandidateVotes%±
Conservative D Jones unopposed
Conservative hold Swing
Shaftesbury
PartyCandidateVotes%±
Conservative D Newman 1,892 60.2
Liberal K Waights 1,252 39.8
Turnout 3,144 52.6
Conservative gain from Liberal Swing
Shaftesbury Rural
PartyCandidateVotes%±
Conservative N Scott 2,197 73.1
Liberal V Cane 809 26.9
Turnout 3,006 49.0
Conservative hold Swing
Sturminster Rural No. 1
PartyCandidateVotes%±
Conservative J Rose unopposed
Conservative hold Swing
Sturminster Rural No. 2
PartyCandidateVotes%±
Conservative R Rose unopposed
Conservative hold Swing

Poole (17 seats)

Poole No. 1
PartyCandidateVotes%±
Liberal E Weeks 1,034 39.0
Conservative J Gardner 983 37.0
Labour H Rosser 637 24.0
Turnout 2,654 36.2
Liberal hold Swing
Poole No. 2 (East)
PartyCandidateVotes%±
Conservative I Duncan 1,620 59.4
Liberal R Feltham 642 23.6
Labour M Knight 464 17.0
Turnout 2,726 42.0
Conservative hold Swing
Poole No. 2 (West)
PartyCandidateVotes%±
Conservative E Webster 1,454 66.2
Labour G Partington 376 17.1
Liberal B Clements 366 16.7
Turnout 2,196 41.1
Conservative hold Swing
Poole No. 3 (North)
PartyCandidateVotes%±
Conservative J Bradley 711 51.3
Independent Socialist M Pauley 332 24.0
Labour D Coleman 191 13.8
Liberal J Allen 152 11.0
Turnout 1,386 35.3
Conservative gain from Labour Swing
Poole No. 3 (South)
PartyCandidateVotes%±
Conservative K McIntyre 925 68.6
Labour R Ledwith 297 22.0
Liberal J Brown 126 9.3
Turnout 1,348 40.6
Conservative hold Swing
Poole No. 4 (North)
PartyCandidateVotes%±
Conservative A Watts 1,145 63.1
Liberal W Rigler 670 36.9
Turnout 1,815 46.1
Conservative gain from Liberal Swing
Poole No. 4 (South)
PartyCandidateVotes%±
Conservative V Braham 1,199 70.0
Residents D Ward 418 24.4
Liberal P Rowland 95 5.5
Turnout 1,712 36.1
Conservative hold Swing
Poole No. 5 (North)
PartyCandidateVotes%±
Conservative J Peters 960 69.6
Liberal M Churchill 419 30.4
Turnout 1,379 36.3
Conservative hold Swing
Poole No. 5 (South)
PartyCandidateVotes%±
Conservative B McIntyre 1,690 91.6
Liberal A Giles 154 8.4
Turnout 1,844 51.9
Conservative hold Swing
Poole No. 6
PartyCandidateVotes%±
Conservative J Bisgood 2,511 96.3
Liberal F Kara 96 3.7
Turnout 2,607 43.1
Conservative hold Swing
Poole No. 7
PartyCandidateVotes%±
Conservative F Rowe 1,684 63.8
Liberal G Goode 957 36.2
Turnout 2,641 38.9
Conservative gain from Liberal Swing
Poole No. 8 (North)
PartyCandidateVotes%±
Liberal R Buyers 641 57.0
Labour J Payne 483 43.0
Turnout 1,124 31.2
Liberal gain from Labour Swing
Poole No. 8 (South)
PartyCandidateVotes%±
Liberal H Ballam unopposed
Liberal hold Swing
Poole No. 9 (North)
PartyCandidateVotes%±
Labour S Hodge 385 37.5
Independent J Dyke 374 36.4
Liberal S Beauchamp 269 26.2
Turnout 1,028 25.4
Labour hold Swing
Poole No. 9 (South)
PartyCandidateVotes%±
Labour D Gooding 546 61.1
Liberal C Vincent 348 38.9
Turnout 894 24.6
Labour hold Swing
Poole No. 10 (North)
PartyCandidateVotes%±
Conservative E Adams 2,849 79.1
Liberal D James 754 20.9
Turnout 3,603 48.8
Conservative hold Swing
Poole No. 10 (South)
PartyCandidateVotes%±
Conservative R Hann 1,490 73.3
Liberal A Foster 542 26.7
Turnout 2,032 34.3
Conservative hold Swing

Purbeck (6 seats)

Swanage
PartyCandidateVotes%±
Conservative R Montague-Jones unopposed
Conservative hold Swing
Wareham
PartyCandidateVotes%±
Conservative C Hodge unopposed
Conservative gain from Independent Swing
Wareham and Purbeck No. 1
PartyCandidateVotes%±
Conservative K Ferguson unopposed
Conservative hold Swing
Wareham and Purbeck No. 2
PartyCandidateVotes%±
Conservative D Franklin 1,620 78.6
Labour S Shinn 440 21.4
Turnout 2,060 44.8
Conservative gain from Independent Swing
Wareham and Purbeck No. 3
PartyCandidateVotes%±
Conservative C Perkins 1,340 78.3
Liberal M Dawson 372 21.7
Turnout 1,712 38.1
Conservative hold Swing
Wareham and Purbeck No. 4
PartyCandidateVotes%±
Conservative M Bond 1,688 69.6
Labour W Bartlett 738 30.4
Turnout 2,426 46.2
Conservative gain from Independent Swing

West Dorset (12 seats)

Beaminster Rural No. 1
PartyCandidateVotes%±
Conservative G Best unopposed
Conservative hold Swing
Beaminster Rural No. 2
PartyCandidateVotes%±
Conservative R Earle 1,393 67.1
Independent K Macksey 682 32.9
Turnout 2,075 43.7
Conservative hold Swing
Bridport
PartyCandidateVotes%±
Conservative J Stickland 1,057 57.7
Independent J Booker 776 42.3
Turnout 1,833 36.0
Conservative hold Swing
Bridport Rural
PartyCandidateVotes%±
Conservative J Mallinson 2,383 87.7
Labour J McKenzie 333 12.3
Turnout 2,716 46.0
Conservative hold Swing
Dorchester No. 1 (West)
PartyCandidateVotes%±
Conservative C Lucas 1,200 54.6
Liberal R Brissenden 526 23.9
Labour R Wakely 473 21.5
Turnout 2,199 41.9
Conservative gain from Labour Swing
Dorchester No. 2
PartyCandidateVotes%±
Conservative P Seaton 1,476 63.5
Liberal D Smith 593 23.5
Labour G Standfield 254 10.9
Turnout 2,323 44.8
Conservative gain from Liberal Swing
Dorchester Rural No. 1
PartyCandidateVotes%±
Conservative H Bond unopposed
Conservative hold Swing
Dorchester Rural No. 2
PartyCandidateVotes%±
Conservative Lord Digby 1,641 75.4
Labour P Gregory 536 24.6
Turnout 2,177 49.5
Conservative hold Swing
Dorchester Rural No. 3
PartyCandidateVotes%±
Conservative P Meaden unopposed
Conservative hold Swing
Lyme Regis
PartyCandidateVotes%±
Conservative J Nuttall unopposed
Conservative hold Swing
Sherborne
PartyCandidateVotes%±
Conservative G Buchanan 1,620 48.5
Liberal P Winch 1,051 31.4
Labour E Noake 671 20.1
Turnout 3,342 59.0
Conservative gain from Liberal Swing
Sherborne Rural
PartyCandidateVotes%±
Conservative H Chapman unopposed
Conservative hold Swing

Weymouth and Portland (9 seats)

Portland (2 seats)
PartyCandidateVotes%±
Independent J Morris 1,401
Conservative E Wright 1,287
Residents J Neimer 1,075
Conservative W Perry 696
Labour F Morris 470
Labour J Bishop 404
Turnout 36.7
Independent hold Swing
Conservative hold Swing
Weymouth No. 1
PartyCandidateVotes%±
Conservative R Russell 1,172 70.6
Labour C Cousins 488 29.4
Turnout 1,660 40.9
Conservative hold Swing
Weymouth No. 2
PartyCandidateVotes%±
Conservative L Hill 1,069 74.2
Labour P Rendall 372 25.8
Turnout 1,441 33.1
Conservative hold Swing
Weymouth No. 3
PartyCandidateVotes%±
Conservative A Biles 1,721 80.5
Labour R Clayton 417 19.5
Turnout 2,138 40.2
Conservative hold Swing
Weymouth No. 4
PartyCandidateVotes%±
Conservative J O'Brien 1,879 85.9
Labour V McCarthy 309 14.1
Turnout 2,188 37.3
Conservative hold Swing
Weymouth No. 5
PartyCandidateVotes%±
Labour P Jevons unopposed
Labour hold Swing
Weymouth No. 6
PartyCandidateVotes%±
Conservative A Griffin 1,145 57.7
Labour M Jewkes 839 42.3
Turnout 1,984 46.1
Conservative gain from Labour Swing
Weymouth No. 7
PartyCandidateVotes%±
Labour R Gainey unopposed
Labour hold Swing

Related Research Articles

Croydon London Borough Council elections

Elections for the Council in the London Borough of Croydon are held every four years to elect 70 councillors. At the last elections, which were held in May 2014, 30 Conservative councillors and 40 Labour councillors, providing a Labour majority of ten seats.

1973 United Kingdom local elections

The first elections to the new local authorities established by the Local Government Act 1972 in England and Wales and the new Northern Ireland district councils created by the Local Government Act 1972 took place in 1973. Elections to the existing Greater London Council also took place.

As a result of the 2009 structural changes to local government in England, the former Wiltshire County Council and the four districts within its geographical area were replaced by the new Wiltshire Council, which is a unitary authority covering the same area, with elections continuing to be held every four years, beginning in June 2009. Previously, Wiltshire County Council had been elected between 1889 and 2005, initially every three years, later every four years.

2003 Harlow District Council election

The 2003 Harlow District Council election took place on 1 May 2003 to elect members of Harlow District Council in Essex, England. One third of the council was up for election and the council stayed under no overall control.

Cumbria County Council British administrative body

Cumbria County Council is the county council of Cumbria, a county in the North West of England. Established in 1974, following its first elections held a year before that, it is an elected local government body responsible for the most significant local services in the county, including county schools, county roads, and social services.

1949 United Kingdom local elections

Elections in England and Wales, 1949 held during the week April 4–9 for County Council positions resulted in sweeping Conservative gains and correspondingly heavy Labour losses. A remarkable feature of the elections was the "dead heat" in the London County Council between Labour and the Conservatives, who each won 64 seats, with the Liberals retaining one seat, that of Sir Percy Harris in Bethnal Green. Outside London, Labour lost its former control of Middlesex, Essex, Northumberland, and the West Riding of Yorkshire; retained control of Derbyshire, Durham, Glamorgan, Monmouthshire, and Nottinghamshire, but won Carmarthenshire, the only county gained by Labour.

1977 United Kingdom local elections

Local elections were held in the United Kingdom in 1977. The results were a major mid-term setback for the Labour government, and the Conservatives, the main opposition, comprehensively regained control of the Greater London Council with 64 seats against Labour's 28. Elections were also held in the county councils and in Northern Ireland.

1981 United Kingdom local elections

Local elections were held in the United Kingdom in May 1981. The results were a mid-term setback for the Conservative government, which lost 1,193 seats, leaving them with 10,545 councillors. The projected share of the vote was more respectable for the government, however: Labour 41%, Conservatives 38%, Liberals 17%. This was in spite of opinion polls showing a much wider Labour lead over the Conservatives. These were the first elections to be contested by Labour under the leadership of Michael Foot, who had succeeded James Callaghan in late 1980.

1977 Wiltshire County Council election

Elections to Wiltshire County Council were held on Thursday, 5 May 1977. The whole council of seventy-nine members was up for election and the result was that the Conservatives retained their control, winning fifty-seven seats, a gain of seventeen. Labour ended with fourteen county councillors, the Liberals and Independents four each.
1977 Somerset County Council election

Elections to Somerset County Council were held on Thursday, 5 May 1977, when the whole council of fifty-six members was up for election.
1977 Oxfordshire County Council election

Elections to Oxfordshire County Council were held on Thursday, 5 May 1977, when the whole council of sixty-nine members was up for election.

1977 Cornwall County Council election

Elections to Cornwall County Council were held on 5 May 1977. The whole council of seventy-nine members was up for election and the result was that the Independents, despite losing nine seats, comfortably retained control, winning sixty-four seats. The Conservatives gained eight seats, ending as the second largest political group with thirteen, while Labour remained with only one member, the Ecology Party also won one, and no one was elected as a representative of the Liberal Party.

1977 Surrey County Council election


Elections to Surrey County Council were held on Thursday, 5 May 1977. The whole council of seventy-three members was up for election and the result was that the Conservatives comfortably retained their control, winning sixty-eight seats, gaining ten from Labour, nine from the Liberals, and two from Independents. Labour ended with only two county councillors and the Independents with three, including one who stood as a "Resident" and another who stood as a "Ratepayer".

1977 Devon County Council election

Elections to Devon County Council were held on Thursday, 5 May 1977. The whole council of ninety-eight members was up for election and the result was that the Conservatives comfortably retained their control, winning eighty-five seats, a gain of twenty-eight, of which seventeen were from Labour and eight from the Liberals. Labour ended with only three county councillors, the Liberals with two, and eight Independents were elected, down from eleven.

2006 Brent London Borough Council election

The 2006 Brent London Borough Council election took place on 4 May 2006 to elect members of Brent London Borough Council in London, England. The whole council was up for election and the Labour Party lost overall control of the council to no overall control.

Elections for the London Borough of Merton were held on 4 May 1978 to elect members of Merton London Borough Council in London, England. This was on the same day as other local elections in England and Scotland.

2003 West Oxfordshire District Council election

The 2003 West Oxfordshire District Council election took place on 1 May 2003 to elect members of West Oxfordshire District Council in Oxfordshire, England. One third of the council was up for election and the Conservative party stayed in overall control of the council.

2006 West Oxfordshire District Council election

The 2006 West Oxfordshire District Council election took place on 4 May 2006 to elect members of West Oxfordshire District Council in Oxfordshire, England. One third of the council was up for election and the Conservative party stayed in overall control of the council.

2007 West Oxfordshire District Council election

The 2007 West Oxfordshire District Council election took place on 3 May 2007 to elect members of West Oxfordshire District Council in Oxfordshire, England. One third of the council was up for election and the Conservative party stayed in overall control of the council.

2012 West Oxfordshire District Council election

The 2012 West Oxfordshire District Council election took place on 3 May 2012 to elect members of West Oxfordshire District Council in Oxfordshire, England. One third of the council was up for election and the Conservative party stayed in overall control of the council.

References

  1. 1 2 'Conservatives triumph in Greater London and metropolitan counties' in The Times of London, issue 59997 dated 7 May 1977, p. 3