Suffolk County Council election, 2017

Last updated
Suffolk County Council election, 2017
County Flag of Suffolk.svg
  2013 4 May 20172021 

All 75 seats to Suffolk County Council
38 seats needed for a majority

 First partySecond partyThird party
 
Party Conservative Labour Liberal Democrat
Last election39157
Seats won52115
Seat changeIncrease2.svg15Decrease2.svg 4Decrease2.svg 3
Popular vote112,82856,13732,237
Percentage45.6%22.8%13.0
SwingIncrease2.svg16.2%Decrease2.svg1.8%Increase2.svg2.9%

 Fourth partyFifth partySixth party
  No image wide.svg
Party Independent Green UKIP
Last election329
Seats won430
Seat changeIncrease2.svg 1Increase2.svg 1Decrease2.svg10
Popular vote10,97719,51013,997
Percentage4.47.95.7
SwingIncrease2.svg1.8%Decrease2.svg0.1%Decrease2.svg12.7%

Suffolk UK local election 2017 map.svg
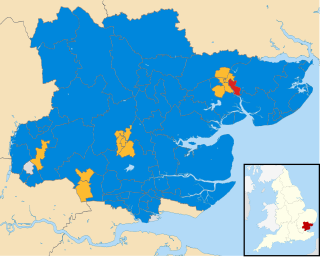
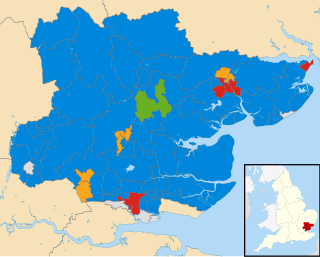
Map of the results of the 2017 Suffolk council election. Conservatives in blue, Liberal Democrats in yellow, Labour in red, Greens in green and independents in grey.

Council control before election

No overall control

Council control after election

Conservative

The 2017 Suffolk County Council election took place on 4 May 2017 as part of the 2017 local elections in the United Kingdom. [1] All 75 councillors were elected from 63 electoral divisions, which returned either one or two county councillors each, by first-past-the-post voting, for a four-year term of office.

Suffolk County Council British administrative body

Suffolk County Council is the administrative authority for the county of Suffolk, England. It is run by 75 elected county councillors representing 63 divisions. It is a member of the East of England Local Government Association.

The wards and electoral divisions in the United Kingdom are electoral districts at sub-national level represented by one or more councillors. The ward is the primary unit of English electoral geography for civil parishes and borough and district councils, electoral ward is the unit used by Welsh principal councils, while the electoral division is the unit used by English county councils and some unitary authorities. Each ward/division has an average electorate of about 5,500 people, but ward-population counts can vary substantially. As at the end of 2014 there were 9,456 electoral wards/divisions in the UK.

Contents

Voters who live in divisions which elected two councillors (12 divisions) were entitled to cast a maximum of two votes, while those living in divisions only electing one councillor (51 divisions) were only entitled to cast one vote.

Labour and the Conservatives were the only parties fielding candidates in all 63 electoral divisions. The Liberal Democrats had candidates standing in 58 divisions, while the Green Party stood candidates in 46 divisions and UKIP stood candidates in 43 divisions.

The Labour Party is a centre-left political party in the United Kingdom which has been described as an alliance of social democrats, democratic socialists and trade unionists. The party's platform emphasises greater state intervention, social justice and strengthening workers' rights. Labour is a full member of the Party of European Socialists and Progressive Alliance, and holds observer status in the Socialist International. As of 2017, the party was considered the "largest party in Western Europe" in terms of party membership, with more than half a million members.

Conservative Party (UK) Political party in the United Kingdom

The Conservative Party, officially the Conservative and Unionist Party, is a centre-right political party in the United Kingdom. Presently led by Theresa May, it has been the governing party since 2010. It presently has 314 Members of Parliament in the House of Commons, 249 members of the House of Lords, and 18 members of the European Parliament. It also has 31 Members of the Scottish Parliament, 12 members of the Welsh Assembly, eight members of the London Assembly and 9,008 local councillors. One of the major parties of UK politics, it has formed the government on 45 occasions, more than any other party.

Liberal Democrats (UK) Political party in the United Kingdom

The Liberal Democrats are a liberal, centrist political party in the United Kingdom. They presently have 11 Members of Parliament in the House of Commons, 96 members of the House of Lords, and one member of the European Parliament. They also have five Members of the Scottish Parliament and a member each in the Welsh Assembly and London Assembly. The party reached the height of its influence in the early 2010s, forming a junior partner in a coalition government from 2010 to 2015. It is presently led by Vince Cable.

Overall Result

Suffolk County Council election, 2017
PartySeatsGainsLossesNet gain/lossSeats %Votes %Votes+/−
  Conservative 52183Increase2.svg 1569.345.6112,828+9.5
  Labour 1115Decrease2.svg 414.722.856,137-1.8
  Liberal Democrat 503Decrease2.svg 36.713.032,237+2.9
  Green 321Increase2.svg 14.07.919,510-0.1
  Independent 300Steady2.svg5.34.410,977+1.8
 West Suffolk Independents110Increase2.svg 10.00.71,771N/A
  UKIP 0010Decrease2.svg 100.05.713,997-12.7

Division results

Babergh

District Summary

PartySeats+/-Votes%+/-
Conservative 6Decrease2.svg110,46339.5+3.7
Liberal Democrat 1Decrease2.svg15,88022.2+4.3
Labour 1Increase2.svg13,43913.0-1.6
Independent 1Steady2.svg3,00711.3+5.2
Green 1Increase2.svg12,4249.1-2.0
UKIP 0Steady2.svg1,2934.9-9.6

Forest Heath

District Summary

PartySeats+/-Votes%+/-
Conservative 4Increase2.svg 15,44147.0+11.0
West Suffolk Independents1Increase2.svg 11,77115.3N/A
Labour 0Steady2.svg1,83015.8+1.3
Independent 0Steady2.svg1,18510.2+3.9
UKIP 0Decrease2.svg 28307.2-28.4
Liberal Democrat 0Steady2.svg5134.4-3.1

Ipswich

District Summary

PartySeats+/-Votes%+/-
Labour 9Decrease2.svg 119,13040.9-1.5
Conservative 2Increase2.svg 117,18736.8+9.6
Liberal Democrat 1Steady2.svg6,12313.1+2.8
UKIP 0Steady2.svg2,1604.6-9.7
Green 0Steady2.svg1,8634.0-1.8
Independent 0Steady2.svg2590.6N/A

Mid Suffolk

District Summary

PartySeats+/-Votes%+/-
Conservative 7Increase2.svg 213,91849.3+14.3
Liberal Democrat 2Decrease2.svg 15,75020.4+6.6
Green 1Steady2.svg4,17114.8-0.8
Labour 0Steady2.svg3,17911.3-0.6
UKIP 0Decrease2.svg 11,1914.2-19.4

Suffolk Coastal

District Summary

PartySeats+/-Votes%+/-
Conservative 10Steady2.svg25,77353.3+3.4
Liberal Democrat 1Steady2.svg7,33815.2-2.2
Green 0Steady2.svg3,2656.7+4.1
Labour 0Steady2.svg8,07216.7-3.4
UKIP 0Steady2.svg2,5505.3-3.1

St. Edmundsbury

District Summary

PartySeats+/-Votes%+/-
Conservative 7Increase2.svg 217,20549.0+11.6
Independent 2Steady2.svg4,08411.6+0.6
Labour 0Steady2.svg6,89019.6+1.7
Liberal Democrat 0Steady2.svg3,69110.5+6.4
Green 0Decrease2.svg 11,6304.6-1.5
UKIP 0Decrease2.svg 11,5994.6-18.8

Waveney

District Summary

PartySeats+/-Votes%+/-
Conservative 11Increase2.svg 622,31544.5+12.3
Labour 1Decrease2.svg 413,58527.1-4.2
Green 1Increase2.svg 16,04812.0+0.6
UKIP 0Decrease2.svg 34,9459.9-12.1
Liberal Democrat 0Steady2.svg2,4694.9+1.7
Independent 0Steady2.svg8371.7N/A

Aldeburgh and Leiston

Aldeburgh and Leiston (1 councillor)
PartyCandidateVotes%±
Conservative Russ Rainger1,28849.4
Labour Freda Casagrande60723.3
UKIP Roger Ball29111.2
Liberal Democrat Julia McLean27010.3
Green Peter Ward1535.9
Majority68126.1
Turnout 2,60935.0
Conservative hold Swing

Beccles

Beccles (2 seats)
PartyCandidateVotes%±
Conservative Mark Bee2,24123.7+2.1
Green Elfrede Brambley-Crawshaw2,18923.2+7.6
Conservative Graham Catchpole2,03121.5+4.4
Green Josi Horne1,44615.3+4.4
Labour Tarik Lahin5415.7-5.8
Labour Nasima Begum3884.1-6.2
UKIP Pat Hawes2242.4-7.7
UKIP Mike Shaw1942.1N/A
Liberal Democrat Caroline Way1051.1-0.5
Liberal Democrat Simon Macdowall961.0N/A
Majority
Turnout 4,84341.3
Conservative hold Swing
Green gain from Conservative Swing

Belstead Brook

Belstead Brook
PartyCandidateVotes%±
Conservative Christopher Hudson86740.9+7.4
Liberal Democrat David Busby79237.4-0.1
Labour Co-op David Plowman27012.7-5.3
UKIP Stuart Armstrong1195.6N/A
Green Richard Hardacre723.4-7.6
Majority753.5
Turnout 2,12031.5+3.8
Conservative gain from Liberal Democrat Swing

Bixley

Bixley
PartyCandidateVotes%±
Conservative Paul West1,31055.7-2.7
Labour Paul Anderson55723.7-1.0
Liberal Democrat Timothy Lockington1988.4+2.8
UKIP Dave Ranson1667.1N/A
Independent Linda Sharp1205.1N/A
Majority75332.0
Turnout 2,35141.4
Conservative hold Swing

Blackbourn

Blackbourn (1 councillor)
PartyCandidateVotes%±
Conservative Joanna Spicer2,53281.7
Labour Cyrille Bouché56818.3
Majority1,96463.4
Turnout 3,10038.5
Conservative hold Swing

Blything

Blything (1 councillor)
PartyCandidateVotes%±
Conservative Richard Smith1,60252.9
Liberal Democrat James Sandbach58619.3
Labour Mark Turner54017.8
Green Nigel Hiley30210.0
Majority1,01633.5
Turnout 3,03040.9
Conservative hold Swing

Bosmere

Bosmere (1 councillor)
PartyCandidateVotes%±
Conservative Anne Whybrow1,16946.0
Liberal Democrat Steve Phillips98738.7
Labour Tony Elliott1987.8
Green Terence Carter1857.3
Majority1827.3
Turnout 2,53932.2
Conservative gain from Liberal Democrat Swing

Brandon

Brandon
PartyCandidateVotes%±
West Suffolk IndependentVictor Lukaniuk93746.9N/A
Conservative Stephen Frost56228.1+0.8
UKIP Reg Silvester25612.8-33.1
Labour Susan Dean24212.1+1.3
Majority37518.8
Turnout 1,99729.4
West Suffolk Independent gain from UKIP

Bridge

Bridge
PartyCandidateVotes%±
Labour Co-op Jack Abbott1,03650.0+6.1
Conservative Mark Felix-Thomas63030.4+10.4
Green Charlotte Armstrong1547.4+2.5
Independent Lynn Turner1396.7N/A
Liberal Democrat Christopher Wrathall1145.5+1.3
Majority40619.6
Turnout 2,07326.9
Labour Co-op hold Swing

Bungay

Bungay (1 councillor)
PartyCandidateVotes%±
Conservative David Ritchie1,53453.1
Labour Sue Collins75826.2
Green Pauline Midwinter2809.7
Liberal Democrat Dave O'Neill1736.0
UKIP Andrew Bols1445.0
Majority77626.9
Turnout 2,88939.4
Conservative hold Swing

Carlford

Carlford (1 councillor)
PartyCandidateVotes%±
Conservative Robin Vickery1,64655.4
Independent Rose Johnson41113.8
Liberal Democrat Kay Yule31110.5
Labour Shasha Toptani2939.9
Green Miriam Burns1856.2
UKIP Michael Coney1234.1
Majority1,23541.6
Turnout 2,96942.4
Conservative hold Swing

Chantry

Chantry (2 seats)
PartyCandidateVotes%±
Labour Helen Armitage2,24623.0-1.7
Labour Peter Gardiner2,14522.0-2.3
Conservative Bob Hall2,11021.6+8.6
Conservative Nadia Cenci2,06921.2+8.9
UKIP Alan Cotterell6586.7-8.7
Liberal Democrat Robert Chambers2712.8-0.1
Liberal Democrat Maureen Haaker2572.6+0.9
Majority
Turnout 32.0
Labour hold Swing
Labour hold Swing

Clare

Clare
PartyCandidateVotes%±
Conservative Mary Evans2,44566.8+20.5
Liberal Democrat Alex Rolph54514.9N/A
Labour Robin Davies3559.7+3.0
UKIP Stuart Letten3158.6-23.0
Majority1,90051.9
Turnout 3,66041.9
Conservative hold Swing

Cosford

Cosford
PartyCandidateVotes%±
Green Robert Lindsay1,63048.4+8.0
Conservative Philip Mutton1,51945.1-6.8
UKIP Leon Stedman1153.4N/A
Labour Rickaby Shearly-Sanders1063.1-4.7
Majority1113.3
Turnout 3,37047.8+6.1
Green gain from Conservative Swing

Eastgate & Moreton Hall

Eastgate & Moreton Hall (1 councillor)
PartyCandidateVotes%±
Independent Trevor Beckwith1,05041.4
Conservative Peter Thompson92436.4
Labour Elle Zwandahl30812.1
Liberal Democrat Chris Lale25510.1
Majority1265.0
Turnout 2,53735.0
Independent hold Swing

Exning & Newmarket

Exning & Newmarket
PartyCandidateVotes%±
Conservative Rachel Hood90937.2
Labour Michael Jefferys58523.9
West Suffolk IndependentSimon Cole56123.0
UKIP Dave Hudson25210.3
Liberal Democrat Martin Redbond1365.6
Majority32413.3
Turnout 2,44331.1
Conservative gain from UKIP Swing

Felixstowe Coastal

Felixstowe Coastal (2 councillors)
PartyCandidateVotes%±
Conservative Graham Newman3,19828.0
Conservative Steve Wiles3,01826.4
Labour Margaret Morris1,0389.1
Labour Corrine Franklin1,0369.1
Liberal Democrat Seamus Bennett1,0289.0
Liberal Democrat Jan Candy7546.6
UKIP Keith Phair7276.4
Green Kay Lyndle4033.5
Green Aidan Semmens2302.0
Majority
Turnout 39.0
Conservative hold Swing

Felixstowe North & Trimley

Felixstowe North & Trimley
PartyCandidateVotes%±
Conservative Stuart Bird1,29549.2+4.2
Labour Dave Ablitt69226.3-10.8
UKIP David Coutts30611.6N/A
Liberal Democrat Andrew Marfleet2358.9-9.1
Green Jonathan Mulbery1064.0N/A
Majority60322.9
Turnout 2,63434.7
Conservative hold Swing

Framlingham

Framlingham
PartyCandidateVotes%±
Conservative Stephen Burroughes1,68557.2+12.9
Green James Holloway40813.8+3.7
Labour Kezia Bayfield38913.2-0.9
Liberal Democrat Andrew Turner31010.5+1.8
UKIP David Owen1565.3-17.6
Majority1,27743.3
Turnout 2,94842.0
Conservative hold Swing

Gainsborough

Gainsborough
PartyCandidateVotes%±
Labour Kim Clements1,08141.3-6.1
Conservative Liz Harsant1,07841.2+17.0
UKIP Shayne Pooley27510.5-11.4
Green Ben Magrath1104.2+1.4
Liberal Democrat Robin Whitmore752.9-0.8
Majority30.1
Turnout 2,61932.2
Labour hold Swing

Gipping Valley

Gipping Valley
PartyCandidateVotes%±
Liberal Democrat John Field1,03040.1+8.1
Conservative John Whitehead1,00039.0+13.1
Labour Julie Cuninghame2499.7-3.8
UKIP David Bosworth2037.9-16.2
Green David Penny853.3-1.2
Majority301.2
Turnout 2,56734.2
Liberal Democrat hold Swing

Great Cornard

Great Cornard
PartyCandidateVotes%±
Conservative Peter Beer90248.9+5.9
Labour Sarah Page52228.3-3.3
UKIP Aidan Powlesland1739.4N/A
Liberal Democrat Marjorie Bark1578.5+1.9
Green Dean Walton914.9-14.0
Majority38020.6
Turnout 1,84525.8
Conservative hold Swing

Gunton

Gunton (2 seats)
PartyCandidateVotes%±
Conservative Steve Ardley1,56919.9+6.6
Labour Keith Patience1,51719.2-0.7
Conservative Mary Rudd1,51119.1+6.9
Labour Janet Craig1,47118.6-1.2
UKIP Bernie Guymer5707.2-6.0
UKIP Jenny Hinton5036.4-5.6
Green Emma Bateman2973.8+0.3
Liberal Democrat Steven Taylor2583.3+2.2
Green Rupert Butley2012.6-0.5
Majority
Turnout 4,12127.5
Conservative gain from Labour Swing
Labour hold Swing

Hadleigh

Hadleigh
PartyCandidateVotes%±
Conservative Mick Fraser84739.6+8.0
Liberal Democrat Trevor Sheldrick79537.2+13.0
Labour Sue Monks33015.4-1.2
UKIP Christine Hempstead914.3-18.4
Green Lisa Gordon753.5-1.4
Majority522.4
Turnout 2,13831.8
Conservative hold Swing

Halesworth

Halesworth (1 councillor)
PartyCandidateVotes%±
Conservative Tony Goldson1,54553.5
Labour Peter Coghill60821.1
Green Alice Bull29010.0
Liberal Democrat Sarah Hunt2498.6
UKIP James Scott1966.8
Majority93732.4
Turnout 2,88839.1
Conservative hold Swing

Hardwick

Hardwick
PartyCandidateVotes%±
Conservative Richard Rout1,64558.7+28.7
Liberal Democrat Helen Korfanty47016.8+5.3
Labour Nicola Iannelli-Popham46316.5+4.3
Green Sara Rae2248.0N/A
Majority1,17541.9
Turnout 2,80241.8
Conservative hold Swing

Hartismere

Hartismere
PartyCandidateVotes%±
Conservative Jessica Fleming1,81061.2+17.7
Green Rowland Warboys45915.5+0.9
Labour Anthony Scott-Robinson43114.6+0.1
Liberal Democrat Josh Townsley2588.7+2.5
Majority1,35145.7
Turnout 2,95836.5
Conservative hold Swing

Haverhill Cangle

Haverhill Cangle (2 seats)
PartyCandidateVotes%±
Conservative Paula Fox1,48123.2+0.7
Conservative Quillon Fox1,32420.7+1.5
Labour Maureen Byrne1,13417.8-2.4
Labour David Smith84513.2-2.3
UKIP Julian Flood77312.1-7.4
Liberal Democrat Lewis Curtis4557.1+2.9
Liberal Democrat Ken Rolph3765.9+1.7
Majority
Turnout 3,46226.1
Conservative gain from UKIP Swing

Haverhill East & Kedington

Haverhill East & Kedington
PartyCandidateVotes%±
Conservative David Roach92247.9+22.9
Labour Jason Simpkin46424.1+2.7
UKIP Ant Williams36619.0-20.2
Liberal Democrat Oliver Forder1728.9-2.8
Majority45823.8
Turnout 1,92427.5
Conservative gain from UKIP Swing

Hoxne & Eye

Hoxne & Eye
PartyCandidateVotes%±
Conservative Guy McGregor1,84656.9+11.3
Liberal Democrat John Blake47014.5+9.4
Labour Co-op Garry Deeks46614.4-2.1
Green James Hargrave2688.3-0.1
UKIP Roger Fouracre1976.1-18.4
Majority1,37642.4
Turnout 3,24741.4
Conservative hold Swing

Kesgrave & Rushmere St Andrew

Kesgrave & Rushmere St Andrew (2 seats)
PartyCandidateVotes%±
Conservative Stuart Lawson2,84028.5+2.9
Conservative Robert Whiting2,47424.8+2.3
Labour Becky Patten1,08310.9-1.8
Labour Helen Clarkson9619.6-0.4
Independent Mark Ling5435.4N/A
Liberal Democrat Sally Neal4364.4-1.8
Independent Jonathan Ogden4344.3N/A
UKIP David Mears3903.9-13.9
Liberal Democrat Jon Neal3803.8-2.5
Green Barbara Richardson-Todd2953.0N/A
Green Charlie Zakss1451.5N/A
Majority
Turnout 33.0
Conservative hold Swing

Kessingland & Southwold

Kessingland & Southwold
PartyCandidateVotes%±
Conservative Michael Ladd1,39248.9+11.3
Liberal Democrat David Beavan49817.5+14.8
Labour Paul Tyack49717.5-4.2
UKIP Jean Difford30810.8-20.7
Green Callum Rollo1505.3-1.3
Majority89431.4
Turnout 2,84538.2
Conservative hold Swing

Lowestoft South

Lowestoft South (2 seats)
PartyCandidateVotes%±
Conservative Jenny Ceresa1,58220.1+9.8
Conservative Jamie Starling1,45518.5+9.3
Labour Tess Gandy1,17414.9-2.4
Labour David Finnigan1,16714.8-2.3
UKIP Peter Collecott4896.2-12.0
UKIP Steve Harvey4445.6-12.5
Independent Desmond Baldry4285.4N/A
Independent Bill Mountford4095.2N/A
Green Peter Lang2032.6-0.1
Green Mark Morgan1912.4+0.2
Liberal Democrat Sandra Tonge1792.3-0.4
Liberal Democrat Darius McCarthy1602.0-0.2
Majority
Turnout 4,13528.0
Conservative gain from UKIP Swing

Martlesham

Martlesham
PartyCandidateVotes%±
Conservative Patricia O'Brien2,54267.6+17.1
Liberal Democrat Mark Gibbons45812.2-10.2
Labour Jeremy Hawksley44611.9-2.5
Green Betsy Reid3158.4-4.4
Majority2,08455.4
Turnout 3,76141.6
Conservative hold Swing

Melford

Melford
PartyCandidateVotes%±
Independent Richard Kemp1,61456.0+2.8
Conservative Margaret Maybury80928.1+12.0
Labour Paul Watson2087.2+0.6
Green John Smith1314.5-1.1
UKIP Peter Lynham1194.1-14.2
Majority80527.9
Turnout 2,88135.7
Independent hold Swing

Mildenhall

Mildenhall
PartyCandidateVotes%±
Conservative Louis Busuttil1,40565.5+26.2
Independent David Chandler42319.7N/A
Labour Kevin Yarrow31714.8+0.9
Majority98245.8
Turnout 2,14530.7
Conservative hold Swing

Newmarket & Red Lodge

Newmarket & Red Lodge
PartyCandidateVotes%±
Conservative Robin Millar1,20350.5+5.9
Labour Joy Uney37315.6-5.2
UKIP Roger Dicker32213.5-14.9
West Suffolk IndependentAndrew Appleby27311.5N/A
Liberal Democrat Andrew Gillett2138.9+2.6
Majority83034.8
Turnout 2,38425.6
Conservative hold Swing

Oulton

Oulton (2 seats)
PartyCandidateVotes%±
Conservative James Reeder2,27425.0+7.2
Conservative Keith Robinson2,13923.5+6.3
Labour Len Jacklin1,39415.3-3.3
Labour Lynne Ward1,36815.0-2.2
UKIP George Hawes6076.7-13.2
UKIP Bert Poole5155.7N/A
Green Sally Phillips2322.5-2.1
Green Peter Eyres2252.5-0.3
Liberal Democrat Chris Thomas2012.2-0.5
Liberal Democrat Patrick Gillard1451.6N/A
Majority
Turnout 4,69330.3
Conservative gain from UKIP Swing
Conservative gain from Labour Swing

Pakefield

Pakefield (2 seats)
PartyCandidateVotes%±
Conservative Melanie Vigo di Gallidoro1,56921.7+4.2
Conservative Craig Rivett1,47320.4+5.8
Labour Peter Byatt1,36919.0+1.5
Labour Sonia Barker1,33318.4+1.2
UKIP Robin Hinton3845.3-10.5
UKIP Phillip Trindall3675.1-9.6
Liberal Democrat Adam Robertson2153.0+1.3
Liberal Democrat Christian Newsome1902.6N/A
Green Rachel Fawkes1822.5+0.1
Green Ben Quail1622.2+0.2
Majority
Turnout 3,71531.0
Conservative gain from Labour Swing

Peninsula

Peninsula
PartyCandidateVotes%±
Liberal Democrat Dave Wood1,33738.9-4.2
Independent Derek Davis92326.9N/A
Conservative Will Shropshire78622.9+2.5
Labour Phil Dunnett2748.0-1.9
Green Andrew Sterling1133.3-2.9
Majority41412.1
Turnout 3,43342.3
Liberal Democrat hold Swing

Priory Heath

Priory Heath
PartyCandidateVotes%±
Labour Bill Quinton92750.0-3.0
Conservative Andy Shannon63934.2+16.9
UKIP Pippa Gordon1417.5-13.3
Liberal Democrat Nicholas Jacob935.0+0.7
Green Andrew Patmore713.8-0.9
Majority28815.4
Turnout 1,87128.3
Labour hold Swing

Row Heath

Row Heath
PartyCandidateVotes%±
Conservative Colin Noble1,36252.4+9.1
Independent David Gathercole38314.7+3.5
Independent John Smith37914.6N/A
Labour Jack Fawbert31312.0+4.2
Liberal Democrat Ralph Brownie1646.3+3.3
Majority97937.6
Turnout 2,60132.3
Conservative hold Swing

Rushmere

Rushmere
PartyCandidateVotes%±
Labour Sandra Gage1,42950.5+3.2
Conservative Paul Cawthorn99735.2+8.6
Liberal Democrat Edward Packard1625.7+1.9
UKIP Jo Grant1525.4-11.6
Green Maxwell Phillips893.1-0.9
Majority43215.3
Turnout 2,82939.1
Labour hold Swing

Samford

Samford
PartyCandidateVotes%±
Conservative Gordon Jones1,50243.3+9.6
Liberal Democrat Sue Carpendale1,41040.6+15.2
Labour Charlie Nixon3239.3-1.0
UKIP Steve Laing2356.8-18.0
Majority922.7
Turnout 3,47042.6
Conservative hold Swing

St Helen's

St Helen's
PartyCandidateVotes%±
Labour Mandy Gaylard1,32254.7+9.2
Conservative Alex Burgess66427.5+9.3
Liberal Democrat Julia Barrett2018.3+0.5
Green Maria Harrison1425.9-4.3
UKIP Wilfred Arasaratnam883.6-14.7
Majority65827.2
Turnout 2,41730.5
Labour hold Swing

St John's

St John's
PartyCandidateVotes%±
Labour Co-op Sandy Martin 1,38357.6+3.0
Conservative Steve Flood76131.7+3.5
Green Jane Scott1385.7-5.7
Liberal Democrat Kenneth Toye1205.0-0.9
Majority62225.9
Turnout 2,40235.86
Labour Co-op hold Swing

St Margaret's & Westgate

St Margaret's & Westgate (2 seats)
PartyCandidateVotes%±
Liberal Democrat Inga Lockington2,28419.3+4.3
Conservative Chris Chambers1,95416.5+2.5
Labour Sarah Adams1,89716.0-1.2
Liberal Democrat Oliver Holmes1,86915.8+3.3
Conservative Lee Reynolds1,69714.3+1.8
Labour Jan Parry1,54113.0-1.9
Green Kirsty Wilmot3232.7N/A
Green John Mann2872.4-2.6
Majority
Turnout 11,85240.0
Liberal Democrat hold Swing
Conservative gain from Labour Swing

Stour Valley

Stour Valley
PartyCandidateVotes%±
Conservative James Finch1,42851.4+8.9
Liberal Democrat Bryn Hurren96634.8+7.6
Labour John Cook1676.0-2.3
UKIP James Carver1214.4-17.6
Green Lois Hickey963.5N/A
Majority462
Turnout 2,77843.1
Conservative hold Swing

Stowmarket North & Stowupland

Stowmarket North & Stowupland (1 councillor)
PartyCandidateVotes%±
Conservative Gary Green1,32049.4+13.3
Green Keith Welham79329.7+14.3
Labour Susan Hollands37614.1-1.3
Liberal Democrat John Curle1816.8+3.8
Majority527
Turnout 2,67026.5
Conservative hold Swing

Stowmarket South

Stowmarket South
PartyCandidateVotes%±
Conservative Nicholas Gowrley92138.3+12.7
Liberal Democrat Keith Scarff78932.8+9.0
Labour Nikki Betts30712.8-1.1
UKIP Stephen Searle2209.2-16.4
Green Max Betts-Davies1676.9-4.2
Majority132
Turnout 2,40431.1
Conservative gain from UKIP Swing

Sudbury

Sudbury (1 councillor)
PartyCandidateVotes%±
Labour Jack Owen69330.5-0.9
Conservative Adrian Osborne63127.8-16.5
Independent John Sayers47020.7N/A
Liberal Democrat Andrew Welsh26211.5-0.7
Green Julie Fowles-Smith1245.5-6.7
UKIP Steven Whalley914.3N/A
Majority62
Turnout 2,27132.0
Labour gain from Conservative Swing

Sudbury East & Waldingfield

Sudbury East & Waldingfield
PartyCandidateVotes%±
Conservative Colin Spence1,16953.2+7.3
Labour Luke Cresswell54624.9+3.8
UKIP Darren Clarke22910.4-17.3
Liberal Democrat Robert Spivey1617.3N/A
Green John Burch924.2-1.1
Majority623
Turnout 2,19731.5
Conservative hold Swing

Thedwastre North

Thedwastre North (1 councillor)
PartyCandidateVotes%±
Conservative Jane Storey1,92762.2+14.7
Green Andy Mellen67821.9+9.6
Labour Ursula Ajimal2939.5-1.3
Liberal Democrat Jon James1996.4+2.0
Majority1,24940.3
Turnout 3,09736.71
Conservative hold Swing

Thedwastre South

Thedwastre South (1 councillor)
PartyCandidateVotes%±
Liberal Democrat Penny Otton1,34646.7+17.5
Conservative Gilly Morgan1,26343.8+16.1
Labour Philip Cockell2749.5+1.7
Majority832.9+1.4
Turnout 2,88339.1
Liberal Democrat hold Swing +0.7

Thingoe North

Thingoe North (1 councillor)
PartyCandidateVotes%±
Conservative Beccy Hopfensperger1,989
Labour Co-op Frederick Rowell439
Liberal Democrat Peter Turner302
Majority1,550
Turnout 2,73038.19
Conservative hold Swing

Thingoe South

Thingoe South (1 councillor)
PartyCandidateVotes%±
Conservative Karen Soons2,110
Liberal Democrat Zigurds Kronbergs436
Labour Hilary Appleton409
UKIP Dawn Dicker145
Majority1,674
Turnout 3,100
Conservative hold Swing

Thredling

Thredling (1 councillor)
PartyCandidateVotes%±
Conservative Matthew Hicks2,06670.0+20.5
Liberal Democrat David Payne45515.4+9.7
Labour Stan Robinson43114.65.1
Majority1,61154.6
Turnout 2,95237.99
Conservative hold Swing

Tower

Tower (2 seats)
PartyCandidateVotes%±
Conservative Robert Everitt1,83320.2+6.6
Independent David Nettleton1,62817.9+2.9
Independent Paul Hopfensperger1,62317.9N/A
Green Mark Ereira1,40615.5-0.9
Labour Quentin Cornish99811.0+1.1
Labour Alex Griffin90710.0+0.7
Liberal Democrat Julia Lale5075.6+1.2
Liberal Democrat Sheena Rawlings1731.9N/A
Majority
Turnout
Conservative gain from Green Swing
Independent hold Swing

Upper Gipping

Upper Gipping
PartyCandidateVotes%±
Green Andrew Stringer1,64553.6+0.5
Conservative Glen Horn1,13537.0+16.4
Labour Terry Wilson1665.4+0.1
Liberal Democrat Mark Valladares1225.4+2.8
Majority510
Turnout 3,06839
Green hold Swing

Whitehouse & Whitton

Whitehouse & Whitton (2 seats)
PartyCandidateVotes%±
Conservative David Goldsmith1,86921.9+7.7
Labour Kathy Bole1,83321.4-2.1
Labour Rob Bridgeman1,73320.3+1.9
Conservative Erion Xhaferaj1,40916.5+2.4
UKIP Tony Gould6808.0-11.3
Green Liz Smith2933.4-2.3
Liberal Democrat Martin Hore2633.1+0.5
Green Shaun McDonald2563.0N/A
Liberal Democrat Malcolm Mitchell2162.5-0.1
Majority
Turnout
Conservative gain from UKIP Swing
Labour hold Swing

Wickham

Wickham
PartyCandidateVotes%±
Conservative Alexander Nicoll1,56648.4+1.8
Liberal Democrat Kit Twinch68421.2+9.3
Labour Lesley Bensley41812.9-7.9
UKIP Trevor Coult MC3089.5-11.8
Green Catherine Walsh2588.0N/A
Majority882
Turnout 3,23438.82
Conservative hold Swing

Wilford

Wilford
PartyCandidateVotes%±
Conservative Andrew Reid1,57856.8-5.1
Green Victoria Hambley35212.7N/A
Liberal Democrat Nigel Brown33912.2-3.8
Labour Philip Harle31511.3-10.8
UKIP Garry Debenham1947.0N/A
Majority1,226
Turnout 2,77841.8
Conservative hold Swing

Woodbridge

Woodbridge
PartyCandidateVotes%±
Liberal Democrat Caroline Page1,54751.4+9.7
Conservative Stephen Attwell1,04134.6+2.4
Labour Vicky Jones2548.4-0.1
Green Eamonn O'Nolan1133.8-0.7
UKIP Ray Tunstall551.8-10.3
Majority506
Turnout 3,01047.19
Liberal Democrat hold Swing

Related Research Articles

Bury St Edmunds (UK Parliament constituency) Parliamentary constituency in the United Kingdom

Bury St Edmunds is a constituency in Suffolk centred on the town of Bury St Edmunds that elects a member of parliament (MP) to the House of Commons of the Parliament of the United Kingdom. The electorate has elected Conservative Party candidates at the general elections and two by-elections since a Liberal victory in 1880, the closest contest since that year was in 1997 when the Labour Party candidate fell 368 votes, less than 1%, short of winning the seat in 1997 during Tony Blair's first landslide result.

In various parliamentary systems, a returning officer is responsible for overseeing elections in one or more constituencies.

Representation of the People Act 1948

The Representation of the People Act 1948 was an Act of the Parliament of the United Kingdom that altered the law relating to parliamentary and local elections. It is noteworthy for abolishing plural voting, including by the abolition of the twelve separate university constituencies; and for again increasing the number of members overall, in this case to 613.

Sketty (electoral ward) human settlement in United Kingdom

Sketty is the name of an electoral ward in the City and County of Swansea, Wales, UK. The electoral ward is coterminous with the community.

2009 Suffolk County Council election

Elections to Suffolk County Council were held on 4 June 2009 as part of the 2009 United Kingdom local elections on the same day as the elections to the European Parliament. 75 councillors were elected from 63 electoral divisions, which returned either one or two county councillors each by first-past-the-post voting for a four-year term of office. The electoral divisions were the same as those used at the previous election in 2004.

2009 Cambridgeshire County Council election

An election to Cambridgeshire County Council took place on 4 June 2009 as part of the United Kingdom local elections, 2009. The election was delayed from 7 May to coincide with elections to the European Parliament. 69 councillors were elected from 60 electoral divisions, which returned either one or two county councillors each by first-past-the-post voting. The Conservative Party retained their majority on the council, while the Green Party and UKIP gained their first seats.

2009 Essex County Council election

An election to Essex County Council took place on 4 June 2009 as part of the United Kingdom local elections, 2009. The elections had been delayed from 7 May, to coincide with elections to the European Parliament. 75 councillors were elected from various electoral divisions, which returned either one or two county councillors each by first-past-the-post voting for a four-year term of office. The electoral divisions were the same as those used at the previous election in 2005.

2013 North Yorkshire County Council election

An election to North Yorkshire County Council took place on 2 May 2013 as part of the United Kingdom local elections, 2013. 72 councillors were elected from 68 electoral divisions, which returned either one or two county councillors each by first-past-the-post voting for a four-year term of office. The four divisions which elected two members were Harrogate Bilton & Nidd Gorge, Harrogate Central, Knaresborough, and Selby Barlby. The electoral divisions were the same as those used at the previous election in 2009. The election saw the Conservative Party maintain overall control of the council.

2013 Hampshire County Council election

An election to Hampshire County Council took place on 2 May 2013 as part of the United Kingdom local elections, 2013. 78 councillors were elected from 75 electoral divisions, which returned either one or two county councillors each by first-past-the-post voting for a four-year term of office. The electoral divisions were the same as those of the previous election in 2009. No elections were held in Portsmouth and Southampton, which are unitary authorities outside the area covered by the County Council. The election saw the Conservative Party retain overall control of the council, with a reduced majority of five councillors.

2013 Cambridgeshire County Council election

An election to Cambridgeshire County Council took place on 2 May 2013 as part of the United Kingdom local elections, 2013. 69 councillors were elected from 60 electoral divisions, which returned either one or two county councillors each by first-past-the-post voting for a four-year term of office. The electoral divisions were the same as those used at the previous election in 2009. No elections were held in Peterborough, which is a unitary authority outside the area covered by the County Council. The election saw the Conservative Party lose overall control of the council.

2013 Durham County Council election

An election to Durham County Council took place on 2 May 2013 as part of the United Kingdom local elections, 2013. Following a boundary review, 126 councillors were elected from 63 electoral divisions which returned either one, two or three councillors each by first-past-the-post voting for a four-year term of office. The previous election took place in 2008 in advance of the council becoming a unitary authority after the 2009 changes to local government. The election saw the Labour Party increase their majority on the council.

2013 Surrey County Council election

The Surrey County Council election, 2013 took place on 2 May 2013 as part of the United Kingdom local elections, 2013. 81 electoral divisions returned one county councillor each by first-past-the-post voting for a four-year term of office. Following a review, new electoral division boundaries were introduced for this election, increasing the number of councillors from 80 to 81.

2013 Gloucestershire County Council election

Elections to Gloucestershire County Council took place on 2 May 2013 as part of the United Kingdom local elections, 2013. 53 electoral divisions elected one county councillor each by first-past-the-post voting for a four-year term of office. No elections were held in South Gloucestershire, which is a unitary authority outside the area covered by the County Council.

2013 Hertfordshire County Council election

An election to Hertfordshire County Council took place on 2 May 2013 as part of the United Kingdom local elections, 2013. 77 electoral divisions elected one county councillor each by first-past-the-post voting for a four-year term of office. The electoral divisions were the same as those used at the previous election in 2009.

2013 Essex County Council election

An election to Essex County Council took place on 2 May 2013 as part of the United Kingdom local elections, 2013. 75 councillors were elected from 70 electoral divisions, which returned either one or two county councillors each by first-past-the-post voting for a four-year term of office. The electoral divisions were the same as those used at the previous election in 2009. No elections were held in Thurrock or Southend-on-Sea, which are unitary authorities outside the area covered by the County Council.

2013 Staffordshire County Council election

An election to Staffordshire County Council took place on 2 May 2013 as part of the United Kingdom local elections, 2013. 62 electoral divisions returned one county councillor each by first-past-the-post voting for a four-year term of office. Following a boundary review, new electoral division boundaries were established for this election. No elections were held in Stoke-on-Trent, which is a unitary authority outside the area covered by the County Council. The council continues to be administered on the Leader and Cabinet model.

2013 Suffolk County Council election

Elections to Suffolk County Council took place on 2 May 2013 as part of the United Kingdom local elections, 2013. 75 councillors were elected from 63 electoral divisions, which returned either one or two county councillors each by first-past-the-post voting for a four-year term of office. The electoral divisions were the same as those used at the previous election in 2009.

2017 United Kingdom local elections

The 2017 United Kingdom local elections were held on Thursday 4 May 2017. Local elections were held across Great Britain, with elections to 35 English local authorities and all councils in Scotland and Wales.

2017 Essex County Council election

Elections to Essex County Council took place on 4 May 2017 as part of the 2017 local elections. All 75 councillors were elected from 70 electoral divisions, which each returned either one or two councillors by first-past-the-post voting for a four-year term of office.

2017 Cornwall Council election

The 2017 Cornwall Council election was held on 4 May 2017 as part of the 2017 local elections in the United Kingdom. 122 councillors were elected from the 121 electoral divisions of Cornwall Council, which returned either one or two councillors each by first-past-the-post voting for a four-year term of office. Although originally scheduled to take place on the same day, the election in the Bodmin St Petroc ward was countermanded following the death of Liberal Democrat candidate Steve Rogerson and was held on 8 June.

References

  1. "Upcoming elections & referendums". Electoral Commission. Retrieved 15 September 2016.