Waveney District Council election, 2002

Last updated

The 2002 Waveney Council election took place on 2 May 2002 to elect members of Waveney District Council in Suffolk, England. The whole council was up for election with boundary changes since the last election in 2000. [1] The Labour party lost overall control of the council to no overall control. [2]

Waveney District Non-metropolitan district in England

Waveney was a local government district in Suffolk, England, named after the River Waveney that forms its north-east border. The district council was based in Lowestoft, the major settlement in Waveney. The other towns in the district are Beccles, Bungay, Halesworth and Southwold.

Non-metropolitan district Type of local government district in England

Non-metropolitan districts, or colloquially "shire districts", are a type of local government district in England. As created, they are sub-divisions of non-metropolitan counties in a two-tier arrangement.

Suffolk County of England

Suffolk is an East Anglian county of historic origin in England. It has borders with Norfolk to the north, Cambridgeshire to the west and Essex to the south. The North Sea lies to the east. The county town is Ipswich; other important towns include Lowestoft, Bury St Edmunds, Newmarket and Felixstowe, one of the largest container ports in Europe.

Contents

Election result

Overall turnout in the election was 35.1%. [3]

Waveney Local Election Result 2002 [3] [4]
PartySeatsGainsLossesNet gain/lossSeats %Votes %Votes+/−
  Labour 21-643.845.727,097+8.3%
  Conservative 21+643.831.818,840-7.8%
  Liberal Democrat 306.314.18,384-4.1%
  Independent 3+16.35.53,235+0.7%
  Green 0001.71,023+1.7%
  Socialist Alliance 0000.6367+0.6%
  UKIP 0000.5319+0.5%
 Others0-1000-

Ward results

Beccles North (2) [3]
PartyCandidateVotes%±
Conservative C Punt626
Labour A Thwaites614
Labour M Blunt534
Conservative M Wade519
Green G Elliott230
Independent C Scott222
Liberal Democrat U Bentley204
Turnout 2,94941.6
Beccles South (2) [3]
PartyCandidateVotes%±
Labour J Walmesley451
Labour M Adams411
Conservative S Cole305
UKIP B Aylett196
Liberal Democrat A Briggs159
Liberal Democrat S Went111
Green M McGee91
Turnout 1,72425.4
Blything [3]
PartyCandidateVotes%±
Conservative W Mawer47968.6
Labour L Watling21931.4
Majority26037.2
Turnout 69840.7
Bungay (2) [3]
PartyCandidateVotes%±
Labour D Jermy726
Conservative J Groom659
Labour L Derges568
Conservative D Allum469
Liberal Democrat W Curry184
Green R Vinton170
Turnout 2,77639.0
Carlton (2) [3]
PartyCandidateVotes%±
Conservative S Ardley458
Conservative B Reader434
Labour J Ford326
Labour M Swan240
Liberal Democrat B Howe140
Turnout 1,59825.0
Carlton Colville (3) [3]
PartyCandidateVotes%±
Conservative R Bell655
Conservative S Sayer567
Conservative K Grant551
Labour R Jack548
Labour I Kelly491
Labour R Chapman486
Liberal Democrat J Marsden204
Turnout 3,50226.2
Gunton and Corton (2) [3]
PartyCandidateVotes%±
Conservative S Chilvers927
Conservative M Rudd863
Labour H Blowers507
Labour M Turner297
Liberal Democrat A Moles185
Green M Narburgh166
Turnout 2,94543.6
Halesworth (2) [3]
PartyCandidateVotes%±
Conservative P Flegg756
Conservative R Niblett697
Labour E Leverett680
Labour P Whitlow548
Liberal Democrat H Watts196
Turnout 2,87741.9
Harbour (3) [3]
PartyCandidateVotes%±
Independent R Ford898
Independent I Turrell643
Labour I Graham622
Labour A Turner588
Independent N Keable582
Labour P Widdowson471
Liberal Democrat J Thain325
Liberal Democrat P Meadez281
Conservative M Ardley232
Socialist Alliance R Mallin120
Turnout 4,76233.1
Kessingland (2) [3]
PartyCandidateVotes%±
Labour N Hodges726
Labour R Breach627
Conservative K Sale507
Conservative P Joslin454
Liberal Democrat L Lakes167
Turnout 2,48136.4
Kirkley (3) [3]
PartyCandidateVotes%±
Liberal Democrat A Shepherd886
Liberal Democrat D Young850
Liberal Democrat G Baxter796
Labour S Balls694
Labour E Skepelhorn652
Labour S Masterson632
Conservative J Corbett193
Turnout 4,70333.5
Lothingland [3]
PartyCandidateVotes%±
Labour B Hunter29145.8
Conservative J Fraser25339.8
Liberal Democrat A Thomas9114.3
Majority386.0
Turnout 63537.5
Normanston (3) [3]
PartyCandidateVotes%±
Labour F Jones883
Labour K Patience786
Labour D Thomas680
Conservative A Mylan339
Liberal Democrat P Holmes-Thrower293
Green S Sizer188
Socialist Alliance N Bird128
Turnout 3,29727.3
Oulton (2) [3]
PartyCandidateVotes%±
Labour J Hinton527
Conservative A Borrett439
Conservative S Ames416
Labour A Thomson406
Liberal Democrat A Tibbitt203
Turnout 1,99135.2
Oulton Broad (2) [3]
PartyCandidateVotes%±
Conservative C Law610
Conservative S Keller546
Labour M Rodgers528
Labour I Melvin460
Liberal Democrat A Martin223
Turnout 2,36735.2
Pakefield (3) [3]
PartyCandidateVotes%±
Labour T Kelly979
Labour M Pitchers913
Labour R Thorne893
Liberal Democrat J Van Pelt603
Liberal Democrat R Dyball531
Conservative V Pulford505
Liberal Democrat B Batchelder499
Turnout 4,92337.0
Southwold and Reydon (2) [3]
PartyCandidateVotes%±
Independent M Ladd890
Conservative P Austin877
Conservative K Keable720
Labour A Clarke246
Labour J Wagner240
Turnout 2,97353.1
St Margarets (3) [3]
PartyCandidateVotes%±
Labour W Devereux913
Labour J Winterton818
Labour R Winterton784
Conservative S Foulger518
Liberal Democrat L Batchelder421
Socialist Alliance M Palmer119
Turnout 3,57329.0
The Saints [3]
PartyCandidateVotes%±
Conservative M Rose45058.6
Green A Abbott11314.7
Labour C Caswell11114.5
Liberal Democrat R Pumer9412.2
Majority33743.9
Turnout 76844.6
Wainford [3]
PartyCandidateVotes%±
Conservative M Bee37652.5
Liberal Democrat N Bromley14820.7
Labour J Seal12717.7
Green N Elliott659.1
Majority22831.8
Turnout 71641.7
Whitton (3) [3]
PartyCandidateVotes%±
Labour D Castleton1,030
Labour S Spore910
Labour A Skipper905
Conservative B Bee555
Liberal Democrat S Tonge417
Turnout 3,81731.7
Worlingham (2) [3]
PartyCandidateVotes%±
Conservative S Jones743
Conservative D Francis712
Labour J Taylor495
Labour P Shelly361
Liberal Democrat D O'Neil173
UKIP B Poole123
Turnout 2,60741.5
Wrentham [3]
PartyCandidateVotes%±
Conservative J Goldsmith43073.8
Labour Whatrup15326.2
Majority27747.5
Turnout 58333.9

Related Research Articles

The 2002 West Lancashire District Council election took place on 2 May 2002 to elect members of West Lancashire District Council in Lancashire, England. The whole council was up for election with boundary changes since the last election in 2000 reducing the number of seats by 1. The Conservative party gained overall control of the council from Labour.

2002 Wyre Forest District Council election

The 2002 Wyre Forest District Council election took place on 2 May 2002 to elect members of Wyre Forest District Council in Worcestershire, England. One third of the council was up for election and the Independent Kidderminster Hospital and Health Concern party gained overall control of the council from no overall control.

The 2002 Worcester City Council election took place on 2 May 2002 to elect members of Worcester District Council in Worcestershire, England. One third of the council was up for election and the council stayed under no overall control.

The 2002 Wokingham District Council election took place on 2 May 2002 to elect members of Wokingham Unitary Council in Berkshire, England. One third of the council was up for election and the Conservative party gained overall control of the council from no overall control.

The 2002 Winchester Council election took place on 2 May 2002 to elect members of Winchester District Council in Hampshire, England.

The 2000 Welwyn Hatfield District Council election took place on 6 May 2000 to elect members of Welwyn Hatfield District Council in Hertfordshire, England. One third of the council was up for election and the Labour party gained overall control of the council from no overall control. Overall turnout in the election was 31.71%, down from 33.09% in the 1999 election.

The 2002 Welwyn Hatfield District Council election took place on 2 May 2002 to elect members of Welwyn Hatfield District Council in Hertfordshire, England. One third of the council was up for election and the Conservative party gained overall control of the council from the Labour party.

The 2003 Welwyn Hatfield District Council election took place on 1 May 2003 to elect members of Welwyn Hatfield District Council in Hertfordshire, England. One third of the council was up for election and the Conservative party stayed in overall control of the council.

The 2002 Stratford-on-Avon District Council election took place on 2 May 2002 to elect members of Stratford-on-Avon District Council in Warwickshire, England. The whole council was up for election with boundary changes since the last election in 2000 reducing the number of seats by 2. The Conservative party stayed in overall control of the council.

Peter Aldous British politician

Peter James Guy Aldous is a Conservative Party politician in England. A former chartered surveyor in private practice intermittently elected to the role of ordinary councillor on the corresponding district council to his later constituency and then serving as deputy party group leader in the official opposition party on Suffolk County Council, he has been the Member of Parliament (MP) for the Waveney constituency in Suffolk since the 2010 general election.

2007 West Lancashire District Council election

The 2007 West Lancashire District Council election took place on 3 May 2007 to elect members of West Lancashire District Council in Lancashire, England. One third of the council was up for election and the Conservative party stayed in overall control of the council.

The 2002 Hart Council election took place on 2 May 2002 to elect members of Hart District Council in Hampshire, England. The whole council was up for election with boundary changes since the last election in 2000. The Conservative party gained overall control of the council from no overall control.

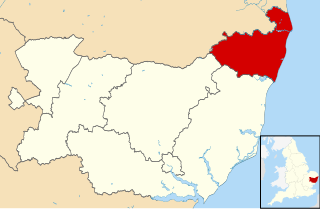
Local elections were held in Waveney district every four years to elect councillors to Waveney District Council. In the past, one-third of councillors were elected each year, but in 2010 the council opted to change to a whole council election system. Since the last boundary changes in 2002, 48 councillors have been elected from 23 wards. The district was merged with Suffolk Coastal in April 2019 to form East Suffolk, meaning that the 2015 elections were the final Waveney elections to be held.

The 1998 Waveney Council election took place on 7 May 1998 to elect members of Waveney District Council in Suffolk, England. One third of the council was up for election and the Labour party stayed in overall control of the council.

The 1999 Waveney Council election took place on 6 May 1999 to elect members of Waveney District Council in Suffolk, England. One third of the council was up for election and the Labour party stayed in overall control of the council.

The 2000 Waveney Council election took place on 4 May 2000 to elect members of Waveney District Council in Suffolk, England. One third of the council was up for election and the Labour party stayed in overall control of the council.

The 2003 Waveney Council election took place on 1 May 2003 to elect members of Waveney District Council in Suffolk, England. One third of the council was up for election and the council stayed under no overall control.

The 2004 Waveney Council election took place on 10 June 2004 to elect members of Waveney District Council in Suffolk, England. One third of the council was up for election and the council stayed under no overall control.

Elections to Waveney District Council took place on Thursday 5 May 2011. This was the first election held as a Whole Council election following a change made to the electoral system in 2010. As a result, all 48 council seats were contested.

References

  1. "Waveney". BBC News Online . Retrieved 2010-11-30.
  2. "Full results". Financial Times. 2002-05-03. p. 7.
  3. 1 2 3 4 5 6 7 8 9 10 11 12 13 14 15 16 17 18 19 20 21 22 23 24 25 "District Election Results: District Election 2nd May 2002". Waveney District Council. Archived from the original on 2002-06-13. Retrieved 2010-11-30.
  4. "Election results; Local Election". The Times. 2002-05-04. p. 16.