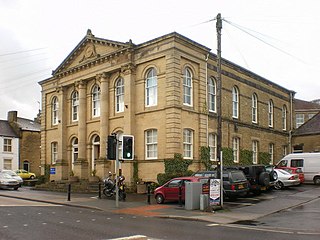
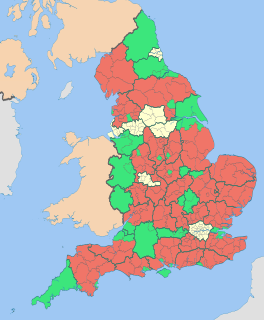
The 2002 Craven District Council election took place on 2 May 2002 to elect members of Craven District Council in North Yorkshire, England. The whole council was up for election with boundary changes since the last election in 2000 reducing the number of seats by 4. [1] The council stayed under no overall control. [2]
Craven is a local government district of North Yorkshire, England centred on the market town of Skipton. In 1974, Craven district was formed as the merger of Skipton urban district, Settle Rural District and most of Skipton Rural District, all in the West Riding of Yorkshire. The population of the Local Authority at the 2011 Census was 55,409. It comprises the upper reaches of Airedale, Wharfedale, Ribblesdale, and includes most of the Aire Gap and Craven Basin.
Non-metropolitan districts, or colloquially "shire districts", are a type of local government district in England. As created, they are sub-divisions of non-metropolitan counties in a two-tier arrangement.
North Yorkshire is a non-metropolitan county and largest ceremonial county in England. It is located primarily in the region of Yorkshire and the Humber but partly in the region of North East England. The estimated population of North Yorkshire was 602,300 in mid 2016.
Before the election the Conservatives had exactly half of the seats on the council with 17 councillors, compared to 12 Independents and 5 Liberal Democrats. [3] Due to boundary changes, which reduced the number of seats on the council from 34 to 30, the whole council was elected for the first time since 1974, instead of the usual one-third of the council being elected at each election. [4] [5]
The Conservative Party, officially the Conservative and Unionist Party, is a centre-right political party in the United Kingdom. Presently led by Theresa May, it has been the governing party since 2010. It presently has 314 Members of Parliament in the House of Commons, 249 members of the House of Lords, and 18 members of the European Parliament. It also has 31 Members of the Scottish Parliament, 12 members of the Welsh Assembly, eight members of the London Assembly and 9,008 local councillors. One of the major parties of UK politics, it has formed the government on 45 occasions, more than any other party.
A Councillor is a member of a local government council.
The Liberal Democrats are a liberal political party in the United Kingdom. They presently have 11 Members of Parliament in the House of Commons, 96 members of the House of Lords, and one member of the European Parliament. They also have five Members of the Scottish Parliament and a member each in the Welsh Assembly and London Assembly. The party reached the height of its influence in the early 2010s, forming a junior partner in a coalition government from 2010 to 2015. It is presently led by Vince Cable.
A total of 61 candidates stood for the 30 seats contested, comprising 23 Conservatives, 18 independents, 13 Liberal Democrats and 1 candidate from the Labour party. [4] 3 Conservative and 3 independent candidates were elected unopposed. [5]
The Labour Party is a centre-left political party in the United Kingdom which has been described as an alliance of social democrats, democratic socialists and trade unionists. The party's platform emphasises greater state intervention, social justice and strengthening workers' rights.
The Conservatives won the most seats to have 13 councillors but without a majority. [5] The Liberal Democrats made gains to have 9 seats, while independents took 8 seats. [5]
Party | Seats | Gains | Losses | Net gain/loss | Seats % | Votes % | Votes | +/− | |
---|---|---|---|---|---|---|---|---|---|
Conservative | 13 | -4 | 43.3 | 40.1 | 8,363 | ||||
Liberal Democrat | 9 | +4 | 30.0 | 28.1 | 5,864 | ||||
Independent | 8 | -4 | 26.7 | 30.9 | 6,430 | ||||
Labour | 0 | 0 | 0 | 0.9 | 184 | ||||
Party | Candidate | Votes | % | ± | |
---|---|---|---|---|---|
Liberal Democrat | Mark Wheeler | 552 | |||
Conservative | Patricia Fairbank | 480 | |||
Conservative | Robert Greaves | 410 | |||
Turnout | 1,442 | 37.2 | |||
Party | Candidate | Votes | % | ± | |
---|---|---|---|---|---|
Conservative | Christopher Knowles-Fitton | 474 | 64.2 | ||
Independent | Robert Heseltine | 264 | 35.8 | ||
Majority | 210 | 28.4 | |||
Turnout | 738 | 57.2 | |||
Party | Candidate | Votes | % | ± | |
---|---|---|---|---|---|
Liberal Democrat | John Pilkington | 741 | |||
Conservative | Gerald Hurtley | 488 | |||
Independent | Manuel Camacho | 439 | |||
Turnout | 1,668 | 39.9 | |||
Party | Candidate | Votes | % | ± | |
---|---|---|---|---|---|
Independent | John Alderson | unopposed | |||
Party | Candidate | Votes | % | ± | |
---|---|---|---|---|---|
Conservative | John Quinn | unopposed | |||
Party | Candidate | Votes | % | ± | |
---|---|---|---|---|---|
Conservative | Stephen Butcher | 656 | |||
Conservative | David Crawford | 563 | |||
Liberal Democrat | Andrew Wood | 451 | |||
Independent | Carlton Hayes | 393 | |||
Turnout | 2,063 | 51.9 | |||
Party | Candidate | Votes | % | ± | |
---|---|---|---|---|---|
Independent | Philip Barrett | 1,066 | |||
Independent | Peter Seward | 364 | |||
Independent | Arthur Dixon | 335 | |||
Conservative | Ian Bannister | 229 | |||
Conservative | Jennifer Wood | 194 | |||
Turnout | 2,188 | 43.3 | |||
Party | Candidate | Votes | % | ± | |
---|---|---|---|---|---|
Conservative | Peter Walbank | unopposed | |||
Party | Candidate | Votes | % | ± | |
---|---|---|---|---|---|
Conservative | Helen Firth | unopposed | |||
Party | Candidate | Votes | % | ± | |
---|---|---|---|---|---|
Independent | David Ireton | unopposed | |||
Independent | Carl Lis | unopposed | |||
Party | Candidate | Votes | % | ± | |
---|---|---|---|---|---|
Conservative | Richard Welch | 393 | 54.7 | ||
Independent | Anthony Macaulay | 326 | 45.3 | ||
Majority | 67 | 9.3 | |||
Turnout | 719 | 51.2 | |||
Party | Candidate | Votes | % | ± | |
---|---|---|---|---|---|
Liberal Democrat | David Heather | 652 | |||
Liberal Democrat | Elizabeth Graham | 599 | |||
Conservative | Charles Price | 392 | |||
Conservative | Terence Murray | 383 | |||
Turnout | 2,026 | 39.1 | |||
Party | Candidate | Votes | % | ± | |
---|---|---|---|---|---|
Liberal Democrat | Eric Jaquin | 342 | |||
Conservative | Pamela Heseltine | 333 | |||
Conservative | Christopher Harbron | 303 | |||
Independent | Melvin Seward | 268 | |||
Liberal Democrat | Darren Moorby | 245 | |||
Independent | Dennis Hall | 204 | |||
Labour | Duncan Hall | 184 | |||
Turnout | 1,879 | 36.5 | |||
Party | Candidate | Votes | % | ± | |
---|---|---|---|---|---|
Liberal Democrat | Michael Doyle | 570 | |||
Conservative | Marcia Turner | 569 | |||
Conservative | Paul Whitaker | 512 | |||
Independent | Michael Hill | 416 | |||
Turnout | 2,067 | 42.2 | |||
Party | Candidate | Votes | % | ± | |
---|---|---|---|---|---|
Liberal Democrat | Andrew Solloway | 325 | |||
Independent | Frances Cook | 295 | |||
Independent | Andrew Cook | 252 | |||
Conservative | Alex Bentley | 181 | |||
Conservative | Barry Blood | 177 | |||
Turnout | 1,230 | 25.4 | |||
Party | Candidate | Votes | % | ± | |
---|---|---|---|---|---|
Liberal Democrat | Paul English | 575 | |||
Liberal Democrat | Pauline English | 569 | |||
Conservative | Margaret Spence | 279 | |||
Conservative | Norman Spence | 261 | |||
Turnout | 1,684 | 30.2 | |||
Party | Candidate | Votes | % | ± | |
---|---|---|---|---|---|
Independent | Stephen Place | 778 | |||
Independent | Kenneth Hart | 585 | |||
Conservative | Barbara Barwick-Nicholson | 216 | |||
Conservative | Dee Pollitt | 122 | |||
Turnout | 1,701 | 35.9 | |||
Party | Candidate | Votes | % | ± | |
---|---|---|---|---|---|
Conservative | John Sayer | 481 | 58.4 | ||
Independent | Kenneth Luty | 233 | 28.3 | ||
Liberal Democrat | James Monksfield | 109 | 13.2 | ||
Majority | 248 | 30.1 | |||
Turnout | 823 | 53.2 | |||
Party | Candidate | Votes | % | ± | |
---|---|---|---|---|---|
Conservative | John Binns | 267 | 43.6 | ||
Independent | Robert Mason | 212 | 34.6 | ||
Liberal Democrat | Andrew Rankine | 134 | 21.9 | ||
Majority | 55 | 9.0 | |||
Turnout | 613 | 43.6 | |||
The 1998 Craven District Council election took place on 7 May 1998 to elect members of Craven District Council in North Yorkshire, England. One third of the council was up for election and the Liberal Democrats lost overall control of the council to no overall control.
The 1999 Craven District Council election took place on 6 May 1999 to elect members of Craven District Council in North Yorkshire, England. One third of the council was up for election and the Conservative party gained overall control of the council from no overall control.
The 2000 Craven District Council election took place on 4 May 2000 to elect members of Craven District Council in North Yorkshire, England. One third of the council was up for election and the Conservative party stayed in overall control of the council.
The 2003 Craven District Council election took place on 1 May 2003 to elect members of Craven District Council in North Yorkshire, England. One third of the council was up for election and the council stayed under no overall control.
The 2004 Craven District Council election took place on 10 June 2004 to elect members of Craven District Council in North Yorkshire, England. One third of the council was up for election and the council stayed under no overall control.
The 2007 Craven District Council election took place on 3 May 2007 to elect members of Craven District Council in North Yorkshire, England. One third of the council was up for election and the council stayed under no overall control.
The 2002 Harlow District Council election took place on 2 May 2002 to elect members of Harlow District Council in Essex, England. The whole council was up for election with boundary changes since the last election in 2000 reducing the number of seats by 9. The Labour party lost overall control of the council to no overall control.
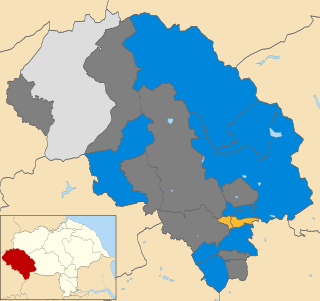
The 2008 Craven District Council election took place on 1 May 2008 to elect members of Craven District Council in North Yorkshire, England. One third of the council was up for election and the council stayed under no overall control.
The 2003 Rother District Council election took place on 1 May 2003 to elect members of Rother District Council in East Sussex, England. The whole council was up for election after boundary changes reduced the number of seats by 7. The Conservative party stayed in overall control of the council.
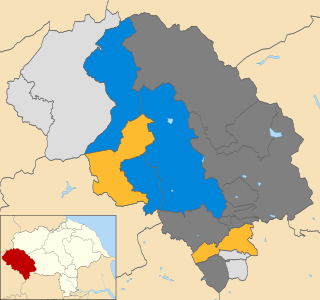
The 2006 Craven District Council election took place on 4 May 2006 to elect members of Craven District Council in North Yorkshire, England. One third of the council was up for election and the council stayed under no overall control.
The 2011 Craven District Council election took place on 5 May 2011 to elect members of Craven District Council in North Yorkshire, England. One third of the council was up for election and the Conservative party stayed in overall control of the council.
The 2012 Craven District Council election took place on 3 May 2012 to elect members of Craven District Council in North Yorkshire, England. One third of the council was up for election and the Conservative party stayed in overall control of the council.
The 2014 Craven District Council election took place on 22 May 2014 to elect members of Craven District Council in North Yorkshire, England. One third of the council was up for election and the Conservative party stayed in overall control of the council.
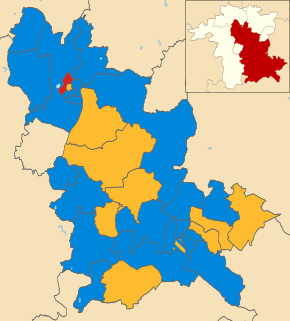
The 2003 Wychavon District Council election took place on 1 May 2003 to elect members of Wychavon District Council in Worcestershire, England. The whole council was up for election with boundary changes since the last election in 1999 reducing the number of seats by four. The Conservative party stayed in overall control of the council.
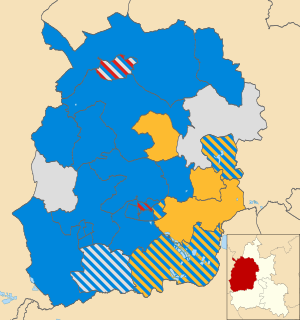
The 2002 West Oxfordshire District Council election took place on 2 May 2002 to elect members of West Oxfordshire District Council in Oxfordshire, England. The whole council was up for election with boundary changes since the last election in 2000. The Conservative party stayed in overall control of the council.
The 2003 West Oxfordshire District Council election took place on 1 May 2003 to elect members of West Oxfordshire District Council in Oxfordshire, England. One third of the council was up for election and the Conservative party stayed in overall control of the council.
The 2004 West Oxfordshire District Council election took place on 10 June 2004 to elect members of West Oxfordshire District Council in Oxfordshire, England. One third of the council was up for election and the Conservative party stayed in overall control of the council.
The 2006 West Oxfordshire District Council election took place on 4 May 2006 to elect members of West Oxfordshire District Council in Oxfordshire, England. One third of the council was up for election and the Conservative party stayed in overall control of the council.
The 2007 West Oxfordshire District Council election took place on 3 May 2007 to elect members of West Oxfordshire District Council in Oxfordshire, England. One third of the council was up for election and the Conservative party stayed in overall control of the council.
The 2003 Richmondshire District Council election took place on 1 May 2003 to elect members of Richmondshire District Council in North Yorkshire, England. The whole council was up for election with boundary changes since the last election in 1999. The council stayed under no overall control.