The 2002 Eastbourne Borough Council election took place on 2 May 2002 to elect members of Eastbourne Borough Council in East Sussex, England. The whole council was up for election with boundary changes since the last election in 2000 reducing the number of seats by 3. [1] The Liberal Democrats gained overall control of the council from the Conservative party. [2]
Eastbourne is a town, seaside resort and borough in the non-metropolitan county of East Sussex on the south coast of England, 19 miles (31 km) east of Brighton. Eastbourne is immediately to the east of Beachy Head, the highest chalk sea cliff in Great Britain and part of the larger Eastbourne Downland Estate.
Borough status in the United Kingdom is granted by royal charter to local government districts in England, Wales and Northern Ireland. The status is purely honorary, and does not give any additional powers to the council or inhabitants of the district. In Scotland, similarly chartered communities were known as royal burghs, although the status is no longer granted.
East Sussex is a county in South East England. It is bordered by the counties of Kent to the north and east, Surrey to the north west and West Sussex to the west, and to the south by the English Channel.
Before the election the Conservatives controlled the council with 18 seats, compared to 12 for the Liberal Democrats. [3] The whole council was elected after boundary changes reduced the number of wards from 10 to 9 and the number of councillors from 30 to 27. [3]
A Councillor is a member of a local government council.
The Liberal Democrats gained a majority of 3 on the council with 15 seats, compared to 12 for the Conservatives. [4] Over a quarter of the Liberal Democrat councillors elected were new to the role, [5] with the Liberal Democrat gains in Old Town and St Anthony's wards being reported as crucial to them taking control. [4] [6] Overall turnout at the election was 33.9%, [7] up from 30.9% in 2000. [8]
Voter turnout is the percentage of eligible voters who cast a ballot in an election. Eligibility varies by country, and the voting-eligible population should not be confused with the total adult population. Age and citizenship status are often among the criteria used to determine eligibility, but some countries further restrict eligibility based on sex, race, or religion.
The Liberal Democrat success was put down to controversy over the Old Town library, issues such as anti-social behaviour and abandoned cars, and boundary changes. [4]
Anti-social behaviours are actions that harm or lack consideration for the well-being of others. It has also been defined as any type of conduct that violates the basic rights of another person and any behaviour that is considered to be disruptive to others in society. This can be carried out in various ways, which includes but is not limited to intentional aggression, as well as covert and overt hostility. Anti-social behaviour also develops through social interaction within the family and community. It continuously affects a child's temperament, cognitive ability and their involvement with negative peers, dramatically affecting children's problem solving skills. Many people also label behaviour which is deemed contrary to prevailing norms for social conduct as anti-social behaviour. However, researchers have stated that it is a difficult term to define, particularly in the United Kingdom where there are an infinite number of acts that fall into its category. The term is especially used in British English.
Party | Seats | Gains | Losses | Net gain/loss | Seats % | Votes % | Votes | +/− | |
---|---|---|---|---|---|---|---|---|---|
Liberal Democrat | 15 | +3 | 55.6 | 49.3 | 32,996 | +13.9% | |||
Conservative | 12 | -6 | 44.4 | 41.4 | 27,700 | -15.7% | |||
Labour | 0 | 0 | 0 | 5.0 | 3,356 | -1.3% | |||
Green | 0 | 0 | 0 | 3.3 | 2,241 | +2.9% | |||
Independent | 0 | 0 | 0 | 0.5 | 321 | +0.5% | |||
UKIP | 0 | 0 | 0 | 0.5 | 303 | +0.5% | |||
Party | Candidate | Votes | % | ± | |
---|---|---|---|---|---|
Liberal Democrat | Beryl Healy | 1,600 | |||
Liberal Democrat | Beryl Teso | 1,480 | |||
Liberal Democrat | Neil Stanley | 1,462 | |||
Conservative | Martin Charlton | 515 | |||
Conservative | Sandra Elkin | 500 | |||
Conservative | Diane Leagas | 453 | |||
Green | Daniel Richardson | 269 | |||
Labour | Peter Tucker | 223 | |||
Turnout | 6,502 | 27.9 | |||
Party | Candidate | Votes | % | ± | |
---|---|---|---|---|---|
Liberal Democrat | Mary Pooley | 1,278 | |||
Liberal Democrat | Michael Thompson | 1,149 | |||
Liberal Democrat | Olive Woodall | 1,145 | |||
Labour | Nora Ring | 523 | |||
Labour | David Brinson | 514 | |||
Labour | Martin Falkner | 451 | |||
Conservative | Jeanie Sowerby | 328 | |||
Conservative | Pamela Cook | 321 | |||
Conservative | Russell Riseley | 312 | |||
Green | Leslie Dalton | 114 | |||
Green | Finbar O'Shea | 112 | |||
Green | Richard Luxford | 79 | |||
Turnout | 6,326 | 29.2 | |||
Party | Candidate | Votes | % | ± | |
---|---|---|---|---|---|
Liberal Democrat | Christopher Berry | 1,255 | |||
Liberal Democrat | Irene Sims | 1,178 | |||
Liberal Democrat | Robert Slater | 1,118 | |||
Conservative | Alexander Richards | 596 | |||
Conservative | Iain Andrews | 574 | |||
Conservative | Thomas Walters | 554 | |||
Labour | John Morrison | 139 | |||
Labour | Jonathan Pettigrew | 109 | |||
Green | Christine Quarrington | 86 | |||
Turnout | 5,609 | 25.8 | |||
Party | Candidate | Votes | % | ± | |
---|---|---|---|---|---|
Conservative | David Stevens | 2,001 | |||
Conservative | Barry Taylor | 1,967 | |||
Conservative | David Elkin | 1,949 | |||
Liberal Democrat | Beverley Berry | 731 | |||
Liberal Democrat | Margaret Ticehurst | 686 | |||
Liberal Democrat | Kevin Aylott | 662 | |||
Green | Clive Gross | 351 | |||
Labour | John Pettigrew | 280 | |||
UKIP | Kenneth Alderton | 174 | |||
UKIP | Royston Maryan | 129 | |||
Turnout | 8,930 | 38.9 | |||
Party | Candidate | Votes | % | ± | |
---|---|---|---|---|---|
Liberal Democrat | Albert Leggett | 2,161 | |||
Liberal Democrat | Maurice Skilton | 2,153 | |||
Liberal Democrat | John Creaven | 1,942 | |||
Conservative | Ian Lucas | 1,252 | |||
Conservative | Simon Herbert | 1,166 | |||
Conservative | John Stanbury | 1,156 | |||
Green | Liam Stevens | 408 | |||
Labour | Robert Rossetter | 216 | |||
Independent | Michael Phipp | 146 | |||
Turnout | 10,600 | 45.0 | |||
Party | Candidate | Votes | % | ± | |
---|---|---|---|---|---|
Conservative | Colin Belsey | 1,641 | |||
Conservative | Barbara Goodall | 1,628 | |||
Conservative | Sandie Howlett | 1,564 | |||
Liberal Democrat | Jacqueline Harris | 806 | |||
Liberal Democrat | Penelope Cunliffe-Lister | 793 | |||
Liberal Democrat | Mary Shmoller | 661 | |||
Labour | David Buck | 295 | |||
Green | Nancy Dalton | 242 | |||
Turnout | 7,630 | 35.4 | |||
Party | Candidate | Votes | % | ± | |
---|---|---|---|---|---|
Liberal Democrat | David Tutt | 2,005 | |||
Liberal Democrat | John Harris | 1,987 | |||
Liberal Democrat | Norman Marsh | 1,907 | |||
Conservative | Sheila Charlton | 827 | |||
Conservative | John Davidson | 762 | |||
Conservative | John Wilton | 705 | |||
Labour | Helen Sedgewick | 221 | |||
Green | Robert Sier | 164 | |||
Turnout | 8,578 | 35.8 | |||
Party | Candidate | Votes | % | ± | |
---|---|---|---|---|---|
Conservative | Patrick Bowker | 1,001 | |||
Conservative | Christopher Williams | 970 | |||
Conservative | Patrick Warner | 925 | |||
Liberal Democrat | Alan Carroll | 648 | |||
Liberal Democrat | Michael Bloom | 638 | |||
Liberal Democrat | Richard Ellis | 632 | |||
Independent | Linus Gunning | 175 | |||
Labour | Jacqueline Pilkington | 172 | |||
Green | Jocelyn McCarthy | 124 | |||
Turnout | 5,285 | 31.8 | |||
Party | Candidate | Votes | % | ± | |
---|---|---|---|---|---|
Conservative | Graham Marsden | 1,390 | |||
Conservative | Robert Lacey | 1,332 | |||
Conservative | Ann Murray | 1,311 | |||
Liberal Democrat | Troy Tester | 989 | |||
Liberal Democrat | Brian Whitby | 966 | |||
Liberal Democrat | Stuart Pritcher | 964 | |||
Green | Susan Montague | 292 | |||
Labour | Michael Tucker | 213 | |||
Turnout | 7,457 | 34.0 | |||
The 2002 Worthing Borough Council election took place on 2 May 2002 to elect members of Worthing Borough Council in West Sussex, England. One third of the council was up for election and the Liberal Democrats gained overall control of the council from the Conservative party. Overall turnout was 30.67%.
The 2006 Solihull Metropolitan Borough Council election took place on 4 May 2006 to elect members of Solihull Metropolitan Borough Council in the West Midlands, England. One third of the council was up for election and the Conservative party stayed in overall control of the council.
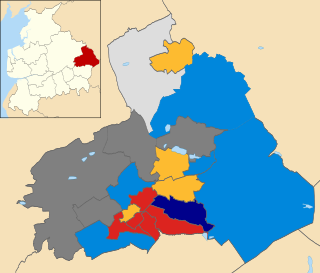
The 2008 Pendle Borough Council election took place on 1 May 2008 to elect members of Pendle Borough Council in Lancashire, England. One third of the council was up for election and the Liberal Democrats lost overall control of the council to no overall control.
The 2007 Maidstone Borough Council election took place on 3 May 2007 to elect members of Maidstone Borough Council in Kent, England. One third of the council was up for election and the council stayed under no overall control.
The 2002 Basingstoke and Deane Council election took place on 2 May 2002 to elect members of Basingstoke and Deane Borough Council in Hampshire, England. The whole council was up for election with boundary changes since the last election in 2000 increasing the number of seats by 3. The council stayed under no overall control.
The 2002 Islington Council election took place on 2 May 2002 to elect members of Islington London Borough Council in London, England. The whole council was up for election with boundary changes since the last election in 1998 reducing the number of seats by 4. The Liberal Democrats stayed in overall control of the council.
The 2004 Hertsmere Borough Council election took place on 10 June 2004 to elect members of Hertsmere Borough Council in Hertfordshire, England. One third of the council was up for election and the Conservative party stayed in overall control of the council.
The 2003 Eastbourne Borough Council election took place on 1 May 2003 to elect members of Eastbourne Borough Council in East Sussex, England. One third of the council was up for election and the Liberal Democrats stayed in overall control of the council.
The 2004 Eastbourne Borough Council election took place on 10 June 2004 to elect members of Eastbourne Borough Council in East Sussex, England. One third of the council was up for election and the Conservative party gained overall control of the council from the Liberal Democrats.
The 2006 Eastbourne Council election took place on 4 May 2006 to elect members of Eastbourne Borough Council in East Sussex, England. One third of the council was up for election and the Conservative party stayed in overall control of the council.
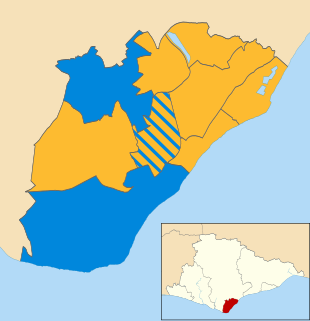
The 2007 Eastbourne Borough Council election took place on 3 May 2007 to elect members of Eastbourne Borough Council in East Sussex, England. The whole council was up for election and the Liberal Democrats gained overall control of the council from the Conservative party.
The 2011 Eastbourne Borough Council election took place on 5 May 2011 to elect members of Eastbourne Borough Council in East Sussex, England. The whole council was up for election and the Liberal Democrats stayed in overall control of the council.
The 2003 Wealden District Council election took place on 1 May 2003 to elect members of Wealden District Council in East Sussex, England. The whole council was up for election with boundary changes since the last election in 1999 reducing the number of seats by 3. The Conservative party stayed in overall control of the council.
The 2011 Wealden District Council election took place on 5 May 2011 to elect members of Wealden District Council in East Sussex, England. The whole council was up for election and the Conservative party stayed in overall control of the council.
The 2002 Colchester Borough Council election took place on 2 May 2002 to elect members of Colchester Borough Council in Essex, England. This was the same day as the other 2002 local elections in the United Kingdom. Due to boundary changes, every seat was up for election and the council stayed under no overall control.
The 2006 Brent London Borough Council election took place on 4 May 2006 to elect members of Brent London Borough Council in London, England. The whole council was up for election and the Labour Party lost overall control of the council to no overall control.
The 2014 Brent London Borough Council election took place on 22 May 2014 to elect members of Brent London Borough Council in London, England. The whole council was up for election and the Labour Party stayed in overall control of the council.
The 2015 East Dorset District Council election took place on 7 May 2015 in order to elect members of the East Dorset District Council in Dorset, England. The whole council was up for election after boundary changes reduced the number of seats by seven. The Conservative party stayed in overall control of the council.
The 2003 Christchurch Borough Council election took place on 1 May 2003 to elect members of Christchurch Borough Council in Dorset, England. The whole council was up for election after boundary changes reduced the number of seats by one. The Conservative party stayed in overall control of the council.
The 2015 Christchurch Borough Council election took place on 7 May 2015 to elect members of Christchurch Borough Council in Dorset, England. The whole council was up for election and the Conservative party stayed in overall control of the council.