Brighton and Hove City Council election, 2015

Last updated

Brighton and Hove City Council election, 2015
  2011 7 May 20152019 

All 54 council seats
28 seats needed for a majority

 First partySecond partyThird party
  No image wide.svg No image wide.svg No image wide.svg
Party Labour Conservative Green
Last election13 seats, 31.7%18 seats, 28.8%23 seats, 32.8%
Seats won232011
Seat changeIncrease2.svg10Increase2.svg2Decrease2.svg12
Popular vote126,842107,58793,324
Percentage35.6%30.2%26.2%
SwingIncrease2.svg3.8%Increase2.svg1.4%Decrease2.svg6.6%

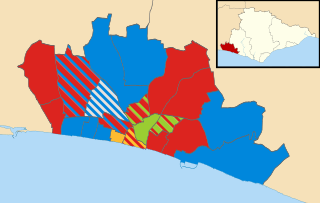
Brighton and Hove City Council election 2015 map.svg

Map of the results of the 2015 election, by ward.

Previous Largest Party before election


Green

Subsequent Largest Party


Labour

The 2015 Brighton and Hove City Council election took place on 7 May 2015 to elect members of Brighton and Hove City Council in England. [1] This is on the same day as the general election and other local elections.

Brighton and Hove City Council

Brighton and Hove City Council is the local authority of the city of Brighton and Hove. It is a unitary authority, having the powers of a non-metropolitan county and district council combined. It provides a full range of local government services including Council Tax billing, libraries, social services, processing planning applications, waste collection and disposal, and it is a local education authority.

Contents

The election saw the Green party lose their minority control of the council. The party had gained control of the council from the Conservative party following the previous election, with the party elected on a promise to resist cuts from central government. [2] During the administration however the council was faced with cuts of up to £80 million. [2]

Other issues faced by the party included internal disputes, which had seen several attempts to remove Green party leader (and leader of Brighton & Hove Council), Jason Kitcat. [3] In one prominent incident the Green administration faced a strike by the city's binmen, following changes to their allowances. The strike, undertaken during the summer, saw refuse go uncollected. The Green administration split over the strike, with several Green councillors (alongside Brighton Pavilion MP Caroline Lucas), including Kitcat's deputy, siding with the binmen. [3]

Results of election

Brighton & Hove Election Result 2015
PartySeatsGainsLossesNet gain/lossSeats %Votes %Votes+/−
  Labour Co-op 23122+1042.5935.55126,842+3.83%
  Conservative 2031+237.0430.16107,587+1.40%
  Green 11012-1220.3726.1693,324-6.59%
  UKIP 000003.7213,263+2.95
  Liberal Democrat 000003.2711,674-1.37
  TUSC 000000.752,684+0.35
  Independent 000000.22798-0.61
  Left Unity 000000.14509Steady2.svg
  Monster Raving Loony 000000.0285

Ward breakdown

Brunswick and Adelaide

Brunswick and Adelaide highlighted BHward13-Brunswick and Adelaide.jpg
Brunswick and Adelaide highlighted
Brunswick and Adelaide (2)
PartyCandidateVotes%±
Green Phelim MacCafferty1,91119.87-0.20
Green Ollie Sykes1,78218.53-0.77
Labour Co-op Melanie Davis1,71717.85+7.27
Labour Co-op Richard Stewart1,27113.21+2.87
Conservative Andrew James Ryder1,06411.06+4.34
Conservative Maryam Shapouri7888.19+1.49
Liberal Democrat David Sears3433.57-12.06
Liberal Democrat Simon Doyle2782.89-5.65
UKIP Gemma Margaret Marie Theree Furness1932.01+0.84
UKIP Linda Jacqueline Reid1861.93N/A
Monster Raving Loony Gzunder Campbell850.88N/A
Turnout 4,42854.05+12.25
Green hold Swing
Green hold Swing

Central Hove

Central Hove highlighted BHward21-Central Hove.jpg
Central Hove highlighted
Central Hove (2)
PartyCandidateVotes%±
Labour Co-op Clare Moonan1,53317.09+4.68
Conservative Andrew Wealls1,36315.20-1.93
Conservative Lloyd Magee1,27714.24-2.19
Green Rebecca Jones1,15912.92-4.81
Green Ray Cunningham1,05311.74-2.70
Labour Co-op David Trangmar1,02411.42+0.95
Liberal Democrat Jeremy Gale6096.79+0.67
Liberal Democrat Beatrice Christina Bass5265.86+0.59
UKIP Nigel Furness3343.72N/A
TUSC Glenn Kelly911.01N/A
Turnout 3,90652.59+9.89
Labour Co-op gain from Green Swing
Conservative hold Swing

East Brighton

East Brighton highlighted BHward4-East Brighton.jpg
East Brighton highlighted
East Brighton (3)
PartyCandidateVotes%±
Labour Co-op Gill Mitchell3,22918.04-0.37
Labour Co-op Maggie Barradell3,22518.02+3.57
Labour Co-op Warren Morgan2,91816.31+0.34
Conservative Gail Woodcock1,5638.73+0.33
Conservative Dave Plant1,5108.44+1.06
Conservative Jan Young1,4167.91+0.73
Green Marie Sansford1,3577.58-0.96
Green Paul Philo1,0215.71-1.58
Green Matt Traini8554.78-0.83
Liberal Democrat Paul Chandler5463.05+0.16
TUSC Julie Donovan2551.42+0.15
Turnout 4,87745.80+6.30
Labour Co-op hold Swing

Goldsmid

Goldsmid highlighted BHward14-Goldsmid.jpg
Goldsmid highlighted
Goldsmid (3)
PartyCandidateVotes%±
Labour Co-op Jackie O'Quinn3,29113.96+2.96
Labour Co-op Saoirse Horan2,89912.30+2.80
Green Amanda Knight2,76711.74-2.45
Labour Co-op Malcolm Prescott2,65211.25+3.28
Conservative Lucy Emeile-Samy2,3109.80+0.84
Conservative Linda Freedman2,3039.77+0.87
Green Andrew Lippett2,1549.14-4.68
Conservative Daniel Hoskins2,0458.67+0.42
Green Matthew Moors1,9368.21-3.69
UKIP Gloria Parks3621.54N/A
UKIP Kevin Smith3481.48N/A
UKIP Robert Simon Spurrier-Kimbell2621.11N/A
TUSC Dave Hill 2471.05N/A
Turnout 6,56953.22-3.38
Labour Co-op gain from Green Swing
Green hold Swing

Hangleton and Knoll

Hangleton and Knoll highlighted BHward16-Hangleton and Knoll.jpg
Hangleton and Knoll highlighted
Hangleton and Knoll (3)
PartyCandidateVotes%±
Conservative Dawn Barnett3,80117.61+0.88
Conservative Tony Janio3,17714.72+0.46
Conservative Nick Lewry3,03814.07+1.00
Labour Co-op Nigel Jenner2,64412.25-2.59
Labour Co-op Chris Henry2,54511.79-1.08
Labour Co-op Martin Perry2,0249.38-2.95
UKIP Stuart Nicholas Bower8483.93N/A
Green Natasha Steel6873.18-0.23
UKIP Patricia Ann Mountain6823.16N/A
UKIP David Patrick6713.11N/A
Green Demi Heath5362.48-0.15
Green Lorraine Osborne4582.12+0.28
Liberal Democrat Oliver Eke3721.72-0.54
TUSC Andrew Stephen Clarke1040.48N/A
Turnout 5,61650.63+3.73
Conservative hold Swing
Conservative gain from Labour Co-op Swing
Conservative hold Swing

Hanover and Elm Grove

Hanover and Elm Grove highlighted BHward6-Hanover and Elm Grove.jpg
Hanover and Elm Grove highlighted
Hanover and Elm Grove (3)
PartyCandidateVotes%±
Green David Gibson4,15917.04-1.80
Green Dick Page3,72315.26-3.18
Labour Co-op Emma Daniel3,52914.46+3.51
Labour Co-op Chris Taylor3,35813.76+2.82
Green Hollie Wharam-Moscrop3,19913.11-3.86
Labour Co-op Ivor Anthony Fried2,86612.74+1.16
Conservative Rachael Bates9143.75+0.46
Conservative Lettie Egan8673.55+0.65
Conservative Dominic Helfgott7843.21+0.35
Liberal Democrat Andrew Oliver5362.20+0.96
TUSC Phillip Clarke4671.91+0.88
Turnout 7,63261.72+15.02
Green hold Swing
Green hold Swing
Labour Co-op gain from Green Swing

Hollingdean and Stanmer

Hollingdean and Stanmer highlighted BHward7-Hollingdean and Stanmer.jpg
Hollingdean and Stanmer highlighted
Hollingdean and Stanmer (3)
PartyCandidateVotes%±
Labour Co-op Tracey Hill3,19216.15+3.12
Labour Co-op Caroline Penn2,55712.94+0.87
Labour Co-op Michael Inkpin-Leissner2,52912.80+1.09
Green Jack Hazelgrove2,47612.53-1.05
Green Vivek Rajcoomar1,9719.97-3.58
Green David Walker1,8289.25-2.55
Conservative Jonathan Ballard1,2776.46+0.52
Conservative Karen Miles1,0965.55-0.35
Conservative David Lewis1,0295.21-0.46
UKIP Desmond Gary Jones7013.55+2.26
UKIP Flo Lewis5112.59N/A
Liberal Democrat Christopher Hurley3731.89+0.82
Independent Christina Summers2241.13N/A
Turnout 5,86750.56+10.86
Labour Co-op gain from Green Swing
Labour Co-op hold Swing

Hove Park

Hove Park highlighted BHward15-Hove Park.jpg
Hove Park highlighted
Hove Park (2)
PartyCandidateVotes%±
Conservative Jayne Bennett3,75232.22-2.79
Conservative Vanessa Brown3,42129.38-3.05
Labour Co-op John Cooper1,27210.92+1.87
Labour Co-op Dominic Ford1,1289.69+2.78
Green Alex Potter5164.43-1.84
Green Iain Martin5024.31+0.31
Liberal Democrat Bob Bailey4794.11+1.40
UKIP Mark Antony Robert Simmonds2662.28+0.83
UKIP Trevor John Hinkley2622.25N/A
TUSC Ivan Alexander David Bonsell470.40N/A
Turnout 4,25851.52+4.31
Conservative hold Swing

Moulsecoomb and Bevendean

Moulsecoomb and Bevendean highlighted BHward3-Moulsecoomb and Bevendean.jpg
Moulsecoomb and Bevendean highlighted
Moulsecoomb and Bevendean (3)
PartyCandidateVotes%±
Labour Co-op Mo Marsh3,21016.33+0.35
Labour Co-op Anne Meadows2,96615.09-0.35
Labour Co-op Dan Yates2,32611.83-3.64
Green Siriol Hugh-Jones1,7799.05-0.98
Conservative Robert Knight1,3777.00-2.73
Conservative Martin Kenig1,3346.79-1.22
Green Leila Simpson1,3156.69-1.22
Green Ameilia Mills1,2766.49-0.68
Conservative Sam Simson1,1936.07-1.71
UKIP Leigh Farrow1,0975.58N/A
UKIP Patrick Lowe9104.63N/A
Left Unity Leila Erin-Jenkins4122.10N/A
Independent Nicolas Paul De Conde2831.44N/A
TUSC Bill North1800.92-1.56
Turnout 5,85447.25+15.45
Labour Co-op hold Swing

North Portslade

North Portslade highlighted BHward17-North Portslade.jpg
North Portslade highlighted
North Portslade (2)
PartyCandidateVotes%±
Labour Co-op Penny Gilbey2,05821.09-2.07
Labour Co-op Peter Atkinson1,96320.12-9.70
Conservative Sam Evans1,86519.12+0.25
Conservative Noel Anthony Jennings1,63616.77+4.83
UKIP Bernie Akehurst8108.30+5.40
UKIP Philip Kevin Wray5385.51N/A
Green Sharon Hamlin4674.79+0.21
Liberal Democrat Eileen Fierheller2032.08-0.27
Green Jane Prisley1731.77-0.66
TUSC Andy Barber430.44N/A
Turnout 4,00450.70+11.10
Labour Co-op hold Swing

Patcham

Patcham highlighted BHward8-Patcham.jpg
Patcham highlighted
Patcham (3)
PartyCandidateVotes%±
Conservative Geoffrey Theobald3,69716.27+1.51
Conservative Carol Theobald3,65316.07+1.19
Conservative Lee Wares3,43615.12-0.69
Labour Co-op Dave Little2,48210.92+2.60
Labour Co-op Nick Jarvis2,2709.99+3.05
Labour Co-op Chaun Wilson1,9288.48+3.17
Green Hugh Woodhouse1,1935.25-5.11
Green Myles Cummins1,1134.90-4.77
Green Anthea Ballam1,0874.78-5.13
UKIP Tesh Patel9304.09+2.27
Liberal Democrat John Aloy-Hiscott5282.32+0.74
Liberal Democrat Nicolas Brack4121.81+0.86
Turnout 6,38656.40+9.66
Conservative hold Swing

Preston Park

Preston Park highlighted BHward10-Preston Park.jpg
Preston Park highlighted
Preston Park (3)
PartyCandidateVotes%±
Labour Co-op Julie Anne Cattell3,56814.67+1.96
Green Leo Littman3,46814.26+0.14
Labour Co-op Kevin Allen3,24113.32+0.35
Green Georgina Louise Turner3,17613.05-3.07
Green Rob Shepherd2,98212.26-3.54
Labour Co-op Neil Schofield2,83911.67+0.28
Conservative Jemma Elizabeth Garrett1,2605.18+0.60
Conservative Brian Freedman1,2375.08+0.61
Conservative Carol Anne Ramsden1,1924.90+0.79
Liberal Democrat Dominic Sokalski3671.51+0.17
Liberal Democrat Billy Tipping3381.39+0.29
TUSC David John Fellows3361.38N/A
Liberal Democrat Matthew Trott3241.33+0.29
Turnout 7,05760.64+17.92
Labour Co-op gain from Green Swing
Green hold Swing
Labour Co-op gain from Green Swing

Queen's Park

Queen's Park highlighted BHward5-Queen's Park.jpg
Queen's Park highlighted
Queen's Park (3)
PartyCandidateVotes%±
Labour Co-op Karen Barford3,28415.25+2.23
Labour Co-op Daniel Chapman3,01714.01+1.67
Labour Co-op Adrian Leonard Morris2,76412.84+0.80
Green Stephanie Powell2,55511.87-2.81
Green Geoffrey Bowden2,48411.54-3.18
Green Richard Stanton2,0629.58-4.61
Conservative Chris Shanks1,4526.74+1.68
Conservative Philip Brownlie1,3666.35+1.47
Conservative Daisy Shirley1,3596.31+1.99
Liberal Democrat Liz Robinson5932.75+1.18
Liberal Democrat Brian Stone3491.62+0.37
TUSC Colin Piper2431.13N/A
Turnout 6,08850.64+5.15
Labour Co-op gain from Green Swing

Regency

Regency highlighted BHward12-Regency.jpg
Regency highlighted
Regency (2)
PartyCandidateVotes%±
Green Tom Druitt2,20723.38-5.15
Green Alexandra Phillips2,14222.69-4.71
Labour Co-op Jonathan Skinner1,32814.07+2.45
Labour Co-op Catherine Wilson1,32714.06+2.87
Conservative Kevin Neil Jameson9359.90+1.59
Conservative Jo Jameson8549.05+1.50
Liberal Democrat Trevor Freeman3263.45+0.66
Liberal Democrat Beth Johnson-Dawes2242.37-0.24
Left Unity Ed Huxley971.03N/A
Turnout 4,19451.85+12.94
Green hold Swing
Green hold Swing

Rottingdean Coastal

Rottingdean Coastal highlighted BHward1-Rottingdean Coastal.jpg
Rottingdean Coastal highlighted
Rottingdean Coastal (3)
PartyCandidateVotes%±
Conservative Lynda Hyde4,30719.04-0.15
Conservative Mary Mears4,09718.11+0.44
Conservative Joe Miller3,75616.60+0.48
Labour Co-op Peter Richard Gillman1,8808.31+0.66
Labour Co-op Talullah Gunputh1,7587.77+0.19
Labour Co-op Mark Craig Laverick1,6797.42+0.66
Green Andrew Coleman1,3275.87-1.40
Green Paul Shanks9254.09-0.94
UKIP Ken Brown8113.58+1.33
Green Richard Williams7353.25-1.68
UKIP Graham John Townsend6923.06+1.00
Liberal Democrat Christine-Reba Edge6582.91-0.60
Turnout 6,12854.54+8.02
Conservative hold Swing

South Portslade

South Portslade highlighted BHward18-South Portslade.jpg
South Portslade highlighted
South Portslade (2)
PartyCandidateVotes%±
Labour Co-op Les Hamilton2,19223.44-4.60
Labour Co-op Alan Robins2,04921.91+0.01
Conservative Danielle Harmer-Strange1,57616.85+0.15
Conservative Adrian Thomas Scott1,20812.92-1.81
Green James Brooks5495.87-1.19
UKIP Martin Trevor White5005.35N/A
UKIP Jamie Rutherford Gillespie4965.30N/A
Green David Pleavin3483.72-0.95
Liberal Democrat Ken Rist2282.441-.25
Liberal Democrat Peter Denyer2052.19-1.00
Turnout 3,89153.68+10.33
Labour Co-op hold Swing

St Peter's and North Laine

St Peter's and North Laine highlighted BHward11-St Peter's and North Laine.jpg
St Peter's and North Laine highlighted
St Peter's and North Laine (3)
PartyCandidateVotes%±
Green Lizzie Deane5,02618.82-3.59
Green Louisa Greenbaum4,59617.21-2.81
Green Pete West4,28616.05-3.40
Labour Co-op Caraline Sarah Brown3,04411.40+2.92
Labour Co-op Jenifer Helen Henderson2,73010.22+2.88
Labour Co-op Maureen Elizabeth Winder2,2298.35+1.08
Conservative Mike Long1,1164.18+1.05
Conservative Pat Ward1,0724.01+0.94
Conservative Heather Newberry-Martin9803.67+0.60
Liberal Democrat Rob Heale5101.91-0.11
Liberal Democrat William Parker3971.49-0.04
Liberal Democrat Michael Wilbur3631.36-0.12
TUSC Jessica Mary Marchant3531.32N/A
Turnout 8,10656.52+15.12
Green hold Swing
Green hold Swing
Green hold Swing

Westbourne

Westbourne highlighted BHward20-Westbourne.jpg
Westbourne highlighted
Westbourne (2)
PartyCandidateVotes%±
Labour Co-op Tom Bewick2,03420.55+4.16
Conservative Denise Cobb1,93619.56+1.05
Labour Co-op Sunny Choudhury1,68917.07+4.10
Conservative Shaun Gunner1,54015.56-4.18
Green Karen James1,01710.28-4.36
Green Guy Davidson8748.83-1.05
Liberal Democrat Geoff Date4724.77+0.53
UKIP Robert Harding3343.38N/A
Turnout 4,18855.18+9.66
Labour Co-op gain from Conservative Swing
Conservative hold Swing

Wish

Wish highlighted BHward19-Wish.jpg
Wish highlighted
Wish (2)
PartyCandidateVotes%±
Conservative Robert Nemeth2,10220.67+3.16
Conservative Garry Peltzer Dunn2,05420.20+0.82
Labour Co-op Anne Pissaridou1,85618.25-1.70
Labour Co-op Edward Crask1,76417.35+0.42
Green Sue Baumgardt8198.05+0.06
Green Anton Simanowitz4574.49+0.07
Liberal Democrat Al Emery3083.03+0.51
UKIP William Alan Goldstone Harden3002.95+1.47
UKIP Caroline Ann Wray2192.15N/A
Independent Mark Anthony Barnard1831.80-1.81
Independent Hector Gow1081.06N/A
Turnout 4,09656.03+4.93
Conservative gain from Labour Co-op Swing
Conservative hold Swing

Withdean

Withdean highlighted BHward9-Withdean.jpg
Withdean highlighted
Withdean (3)
PartyCandidateVotes%±
Conservative Ann Norman3,49514.90+1.55
Conservative Ken Norman3,34814.28+1.64
Conservative Nick Taylor2,98512.73+0.73
Labour Co-op Juliet Diana McCaffery2,55210.88+3.13
Green Sue Shanks2,1899.33-4.53
Labour Co-op Leo Barraclough2,1709.25+1.87
Labour Co-op Michael John Middleton2,1459.15+2.91
Green Steve Griffiths1,9328.24-3.24
Green Jamie Lloyd1,8647.95-2.66
Liberal Democrat Hyder Kemal Khalil5602.39+0.43
TUSC Beth Granter2100.90N/A
Turnout 6,55558.50+7.55
Conservative gain from Green Swing
Conservative hold Swing

Woodingdean

Woodingdean highlighted Map of Brighton and Hove wards -Woodingdean.jpg
Woodingdean highlighted
Woodingdean (2)
PartyCandidateVotes%±
Conservative Steve Bell2,73828.29+0.49
Conservative Dee Simson2,63627.24+0.37
Labour Co-op Judith Milton1,69717.54+2.89
Labour Co-op Elizabeth McGinley1,40014.47+1.33
Green Andrea Finch4394.54-2.38
Green Alexis Bear4124.26-0.19
Liberal Democrat Lawrence Eke2472.55+0.47
TUSC Timothy Roger Halpin1081.12N/A
Turnout 4,06653.39+10.66
Conservative hold Swing

Related Research Articles

Green Party of England and Wales Political party in England and Wales

The Green Party of England and Wales is a green, left-wing political party in England and Wales. Headquartered in London, since September 2018, its co-leaders are Siân Berry and Jonathan Bartley. The Green Party has one representative in the House of Commons, one in the House of Lords, and three in the European Parliament. In addition, it has various councillors in UK local government and two members of the London Assembly.

Brighton Pavilion (UK Parliament constituency) Parliamentary constituency in the United Kingdom

Brighton Pavilion is a constituency represented in the House of Commons of the UK Parliament since 2010 by Caroline Lucas of the Green Party; who on being elected, became the first MP for that party in the United Kingdom.

Brighton Kemptown (UK Parliament constituency) Parliamentary constituency in the United Kingdom

Brighton Kemptown is a constituency created in 1950 in the House of Commons of the UK Parliament covering the eastern portion of the city of Brighton and Hove including Kemptown and part of the Lewes District.

Hove (UK Parliament constituency) parliamentary constituency in the United Kingdom

Hove is a borough constituency represented in the House of Commons of the UK Parliament since 2015 by Labour's Peter Kyle.

Brighton and Hove City Council is a unitary authority in East Sussex, England. It was created as Brighton and Hove Borough Council on 1 April 1997 replacing Brighton and Hove Borough Councils. It was granted city status in 2001.

Politics of Bristol

The city of Bristol, England, is a unitary authority, represented by four MPs representing seats wholly within the city boundaries. As well as these, Filton and Bradley Stoke covers the northern urban fringe in South Gloucestershire and the north eastern urban fringe is in the Kingswood constituency. The overall trend of both local and national representation became left of centre, favouring the Labour Party and Liberal Democrats during the latter 20th century, but there was a shift to the right in the 2010 general election. The city has a tradition of local activism, with environmental issues and sustainable transport being prominent issues in the city.

2007 Brighton and Hove City Council election

Elections to Brighton and Hove City Council on the south coast of England were held on 3 May 2007. The whole council was up for election and all 54 councillors were elected.

2006 Camden London Borough Council election

The 2006 Camden Council election took place on 4 May 2006 to elect members of Camden London Borough Council in London, England. The whole council was up for election and the Labour Party lost overall control of the council to no overall control.

Simon Kirby British politician

Simon Gerard Kirby, also known as Simon Radford-Kirby, is a British Conservative Party politician. He was elected as the Member of Parliament (MP) for Brighton Kemptown in 2010. In July 2016, he was appointed Economic Secretary to the Treasury and City Minister. He lost his seat in the 2017 general election.

East Sussex County Council British administrative body

East Sussex County Council is the local authority for the non-metropolitan county of East Sussex.

The Green Party of England and Wales has its roots in the PEOPLE Party started in Coventry in 1972/3 by four professional friends. It then changed its name to the more descriptive Ecology Party in 1975, and to the Green Party ten years later. In the 1990s, the Scottish and Northern Ireland wings of the Green Party in the United Kingdom decided to separate amicably from the party in England and Wales, to form the Scottish Green Party and the Green Party in Northern Ireland. The Wales Green Party became an autonomous regional party and remained within the new Green Party of England and Wales.

2011 Brighton and Hove City Council election

Elections to Brighton and Hove City Council were held on 5 May 2011, in line with other local elections in the United Kingdom. The whole council, a unitary authority, was up for election with 54 councillors elected from 21 wards.
2003 Brighton and Hove City Council election

Elections to Brighton and Hove City Council on the south coast of England were held on 1 May 2003. The whole council was up for election and all 54 councillors were elected from 21 wards. Labour lost control of the council and no party had majority of seats so the council came under no overall control.

2015 United Kingdom local elections

The 2015 United Kingdom local elections were held on Thursday 7 May 2015, the same day as the general election for the House of Commons of the United Kingdom.

2015 Cheshire West and Chester Council election

The 2015 Cheshire West and Chester Council election took place on 7 May 2015, electing members of Cheshire West and Chester Council in England. This was on the same day as other local elections across the country as well as the general election.

2015 City of York Council election

The 2015 City of York Council election took place on 7 May 2015 to elect members of City of York Council in England. The whole council was up for election. Turnout was substantially up across the city due to the election being held on the same day as the general election and other local elections in England.

Maria Caulfield British politician

Maria Colette Caulfield is a Conservative Party politician, a ) and nurse. She was first elected as Member of Parliament (MP) for Lewes in 2015. She was given the role of Conservative Campaign Headquarters (CCHQ) Vice Chair for Women on 8 January 2018, until her resignation on 10 July 2018 in protest at the Brexit strategy of the Prime Minister, Theresa May.

2017 United Kingdom local elections

The 2017 United Kingdom local elections were held on Thursday 4 May 2017. Local elections were held across Great Britain, with elections to 35 English local authorities and all councils in Scotland and Wales.

References

  1. "Upcoming elections & referendums". The Electoral Commission. Archived from the original on 15 March 2015. Retrieved 26 March 2015.
  2. 1 2 "Elections 2015: Green Party loses Brighton Council to Labour". BBC News. 10 May 2015.
  3. 1 2 Thompson, Barney (24 February 2015). "Is Brighton a fair showground for UK Green party?". Financial Times.