Colchester Borough Council election, 2015

Last updated

Colchester Borough Council election, 2015

Flag of the United Kingdom.svg


  2014 7 May 2015 (2015-05-07) 2016  

20 seats (out of 60 seats)
31 seats needed for a majority

  First party Second party
  No image wide.svg No image wide.svg
Party Conservative Liberal Democrat
Seats before 23
seats up: 9
24
seats up: 7
Seats won 13 3
Seats after2720
Seat changeIncrease2.svg 4Decrease2.svg 4
Popular vote 28,023 13,827
Percentage 40.1 19.8
SwingIncrease2.svg3.6Decrease2.svg7.7

  Third party Fourth party
  No image wide.svg No image wide.svg
Party Labour Independent
Seats before 9
seats up: 3
4
seats up: 1
Seats won 3 1
Seats after93
Seat changeSteady2.svgSteady2.svg
Popular vote 12,940 1,643
Percentage 18.5 2.4
SwingDecrease2.svg3.4Decrease2.svg3.7

The 2015 Colchester Borough Council election took place on 7 May 2015 to elect one third of the members of Colchester Borough Council in England. [1] This was the same day as other local elections and as the General Election. Colchester Borough Council is made up of 60 councillors: 20 councillors were up for election. [2]

Contents

Prior to the elections, Liberal Democrat councillor for New Town ward, Theresa Higgins, was appointed Mayor of Colchester for a term of one-year.

New Town (Colchester electoral ward) electoral ward in Colchester, England

New Town was an electoral ward in Colchester, England that was within the boundary of Colchester Borough Council, to which it elected 3 councillors. The ward existed from at least 1976 to 2016, when it was abolished and became parts of New Town & Christ Church and Old Heath & The Hythe.

Composition of council seats before election

Prior to the election the composition of the council was:

249423
Liberal DemocratsLabourIndConservative

After the election, the composition of the council was:

209427
Liberal DemocratsLabourIndConservative

Candidates by party


Liberal Democrats (20/20)
Conservative Party (20/20)
Labour Party (20/20)
Green Party (20/20)
UKIP (15/20)
Independent (3/20)


The Liberal Democrats, Conservatives, Labour Party and Green Party all stood a full slate of 20 candidates. UKIP stood 15 candidates and 3 independents (including a candidate with the description 'Patriotic Socialist Party') stood for election.

Results Summary

With 30 seats required for a dead-heat majority (of 0), no single grouping of councillors remained in overall control of policy decision-making. Conservatives fell 3 short this time whereas at the last election a five-becoming-six seat deficit existed during the four-year term for the largest grouping which had been the Liberal Democrats.

Colchester Borough Council election, 2015
PartySeatsPopular vote
WonNot upTotal±Votes%±
  Conservative 131427Increase2.svg 428,02340.1+3.6
  Liberal Democrats 31720Decrease2.svg 413,82719.8-7.7
  Labour 369Steady2.svg12,94018.5-3.4
  Independent 123Steady2.svg1,5432.4-3.7
  UKIP 000Steady2.svg7,77511.1+10.7
  Green 000Steady2.svg5,7678.2+0.6
Total20406069,975
Turnout?

Changes in vote share are compared to the 2011 election as it is the last time this set of seats were up for election and thus is the last directly comparable result.

By-elections since the previous election

A by-election was held in Wivenhoe Quay on 3 July 2014 following the death of Labour councillor Steve Ford. [3] [4] The seat was held for Labour by Rosalind Scott with a majority of 228 votes over the Conservatives. [5]

By-elections, also spelled bye-elections, are used to fill elected offices that have become vacant between general elections.

Wivenhoe Quay by-election, 3 July 2014 [5]
PartyCandidateVotes%±
Labour Rosalind Scott85746.7-5.4
Conservative Peter Hill 629 34.3+2.4
UKIP John Pitts 129 7.0N/A
Liberal Democrat Shaun Boughton 127 6.9-0.1
Green Tim Glover 90 4.9-4.2
Patriotic Socialist Dave Osborn 2 0.1N/A
Majority 228 12.4-7.9
Turnout 1,834 43 +1
Labour hold Swing

Ward Results

Berechurch

Berechurch
PartyCandidateVotes%±
Labour Dave Harris 1,958 50.3 +10.3
Conservative Michael Brown 858 22.0 +8.7
UKIP Paul Mulvey 521 13.4 -9.1
Liberal Democrat Susan Hislop 406 10.4 -9.2
Green Clare Palmer 152 3.9 +0.3
Turnout
Labour hold Swing

Birch & Winstree

Birch & Winstree
PartyCandidateVotes%±
Conservative Andrew Ellis 1,913 59.7 +5.3
UKIP John Pitts 569 17.8 -10.7
Liberal Democrat Gill Collings 291 9.1 +4.2
Labour John Spademan 287 9.0 +1.3
Green Jan Plummer 145 4.5 -1.3
Turnout
Conservative hold Swing

Castle

Castle
PartyCandidateVotes%±
Conservative Darius Laws 1,667 35.9 +11.8
Liberal Democrat Owen Howell 1,172 25.2 -0.5
Green Andrew Canessa 982 21.2 +4.0
Labour Andrew Murphy 821 17.7 -0.1
Turnout
Conservative gain from Liberal Democrat Swing

Christ Church

Christ Church
PartyCandidateVotes%±
Conservative Annesley Hardy 964 38.0 +9.3
Liberal Democrat Robin James 670 26.4 -6.1
Labour Elisa Vasquez-Walters 433 17.1 +0.5
Green Charles Ham 319 12.6 -2.2
UKIP Ron Levy 148 5.8 -1.6
Turnout
Conservative gain from Liberal Democrat Swing

Copford & West Stanway

Copford & West Stanway
PartyCandidateVotes%±
Conservative Jackie Maclean 673 59.8 -6.9
UKIP Chris Treloar 177 15.7 N/A
Liberal Democrat Robert James 115 10.2 -2.7
Labour Barbara Nichols 115 10.2 -3.4
Green Emma-Jane Kemp 46 4.1 -2.6
Turnout
Conservative hold Swing

Fordham & Stour

Fordham & Stour
PartyCandidateVotes%±
Conservative Nigel Chapman 2,023 65.4 -0.1
Labour Kevin Stannard 396 12.8 +0.2
Green Sue Bailey 337 10.9 -1.8
Liberal Democrat Barry Woodward 337 10.9 +2.6
Turnout
Conservative hold Swing

Great Tey

Great Tey
PartyCandidateVotes%±
Conservative Peter Chillingworth 979 58.6 +10.3
Liberal Democrat Susan Waite 257 15.4 +6.4
Labour Matt Creamer 170 10.2 +0.4
UKIP David Holmes 162 9.7 -5.1
Green Robert Brannan 104 6.2 +0.4
Turnout
Conservative hold Swing

Highwoods

Highwoods
PartyCandidateVotes%±
Independent Phil Oxford 1,592 36.9 -15.2
Conservative Chris Hayter 1,192 27.7 +15.3
Labour Gary Braddy 479 11.1 +1.4
Liberal Democrat John Baker 466 10.6 +2.6
UKIP Jamie Middleditch 395 9.2 -4.1
Green Robbie Spencer 187 4.3 +0.1
Turnout
Independent hold Swing

Mile End

Mile End
PartyCandidateVotes%±
Conservative Ben Locker 2,101 38.4 +7.4
Liberal Democrat Ciaran Patrick McGonagle 1,769 32.3 -8.4
Labour Martin Camroux 707 12.9 +5.2
UKIP Tony Terry 533 9.7 -5.1
Green Mary Bryan 368 6.7 +0.9
Turnout
Conservative gain from Liberal Democrat Swing

New Town

New Town
PartyCandidateVotes%±
Liberal Democrat Annie Feltham 1,289 32.1 -9.5
Conservative Matt Neall 834 20.8 +8.4
Labour Lee Scordis 772 19.2 +4.4
Green Mark Goacher 631 15.7 +2.3
UKIP Alex Knupffer 493 12.3 -5.8
Turnout 3,719 56.3
Liberal Democrat hold Swing

Prettygate

Prettygate
PartyCandidateVotes%±
Conservative Will Quince 2,269 51.1 -6.8
Liberal Democrat John Loxley 967 21.8 +0.6
Labour Mike Dale 522 11.8 0.0
UKIP Steve Galvin 489 11.0N/A
Green Luke O'Loughlin 196 4.4 -4.7
Turnout
Conservative hold Swing

Shrub End

Shrub End
PartyCandidateVotes%±
Conservative Pauline Hazell 1,517 35.2 +14.6
Liberal Democrat Sharron Lawrence 1,157 25.9 -7.9
UKIP Simon Collins 757 16.9 -5.0
Labour Gary Griffiths 736 16.5 -2.2
Green Stuart Welham 251 5.6 +1.6
Turnout
Conservative hold Swing

St. Andrew's

St. Andrew's
PartyCandidateVotes%±
Labour Tim Young 1,462 48.8 -12.8
Conservative Chris Hill 715 23.9 +8.1
Liberal Democrat Verity Woolley 447 14.9 +3.0
Green Joshua Murray 370 12.4 +1.7
Turnout
Labour hold Swing

St. Anne's

St. Anne's
PartyCandidateVotes%±
Liberal Democrat Barrie Cook 1,173 31.2 -8.5
Conservative Peter Klejna-Wendt 976 26.0 +10.8
UKIP Bill Faram 770 20.5 -4.9
Labour Amanda Stannard 600 16.0 +2.6
Green Stephen Ford 241 6.4 -0.1
Turnout
Liberal Democrat hold Swing

Stanway

Stanway
PartyCandidateVotes%±
Conservative Fiona Maclean 1,861 42.8 +12.6
Liberal Democrat Lesley Scott-Boutell 1,611 37.0 +3.3
Labour Carole Spademan 616 14.2 +4.0
Green Tim Glover 261 6.0 +0.9
Turnout
Conservative gain from Liberal Democrat Swing

Tiptree

Tiptree
PartyCandidateVotes%±
Conservative Margaret Crowe 1,873 42.8 +1.5
UKIP Stuart Gulleford 1,313 32.5 -5.0
Labour Robert Spademan 535 13.2 +0.8
Liberal Democrat Miah Ahmed 194 4.8 +1.3
Green Katherine Bamforth 129 3.2 -2.1
Turnout
Conservative hold Swing

West Bergholt & Eight Ash Green

West Bergholt & Eight Ash Green
PartyCandidateVotes%±
Conservative Marcus Harrington 1,578 54.7 -7.1
UKIP Ben Clark 370 12.8N/A
Labour Ian Yates 306 10.6 -2.0
Liberal Democrat Gemma Graham 265 9.2 +0.8
Green Roger Bamforth 204 7.1 -10.1
Independent Julian McCallum 151 5.2N/A
Patriotic Socialist Dave Osbourne 12 0.4N/A
Turnout
Conservative hold Swing

West Mersea

West Mersea
PartyCandidateVotes%±
Conservative Patricia Moore 2,154 51.9 +0.8
UKIP David Broise 988 23.8 -3.8
Labour Alison Inman 402 9.7 +1.0
Green Lisa Britton 330 8.0 +1.5
Liberal Democrat Jenny Stevens 278 6.7 +2.6
Turnout
Conservative hold Swing

Wivenhoe Cross

Wivenhoe Cross
PartyCandidateVotes%±
Liberal Democrat Mark Cory 668 44.9 -8.1
Labour Phil Finn 328 22.1 +2.7
Conservative Natalie Jukes 271 18.2 -3.1
Green Christopher Flossman 130 8.7 +2.2
UKIP Carole Morse 90 6.1N/A
Turnout
Liberal Democrat hold Swing

Wivenhoe Quay

Wivenhoe Quay
PartyCandidateVotes%±
Labour Rosalind Scott 1,295 40.9 -11.8
Conservative Peter Hill 1,251 39.5 +7.6
Green Laura Poutney 325 10.3 +1.1
Liberal Democrat Shaun Boughton 295 9.3 +2.3
Turnout
Labour hold Swing

By-Elections between 2015 and 2016

In June 2015, in accordance with the Local Government Act 1972, Conservative councillor Mark Cable "ceased to be a member of the council" after failing to attend a council meeting since December 2014 (6 months). A by-election was called and the ward was subsequently held by the Conservatives.

Local Government Act 1972 Act of Parliament in the United Kingdom

The Local Government Act 1972 is an Act of the Parliament of the United Kingdom that reformed local government in England and Wales on 1 April 1974.

Conservative Party (UK) Political party in the United Kingdom

The Conservative Party, officially the Conservative and Unionist Party, is a centre-right political party in the United Kingdom. Presently led by Theresa May, it has been the governing party since 2010. It presently has 314 Members of Parliament in the House of Commons, 249 members of the House of Lords, and 18 members of the European Parliament. It also has 31 Members of the Scottish Parliament, 12 members of the Welsh Assembly, eight members of the London Assembly and 9,008 local councillors. One of the major parties of UK politics, it has formed the government on 45 occasions, more than any other party.

Dedham & Langham ward
PartyCandidateVotes%±
Conservative Anne Brown 545 77.9 +8.6
UKIP Bill Faram 60 8.6N/A
Liberal Democrat George Penny 57 8.1 -1.6
Labour John Spademan 38 5.4 -4.3
Turnout 700 29.1 -5.1
Conservative hold Swing

Related Research Articles

Colchester Politics: Colchester is a historic town located in Essex, England. It served as the first capital of Roman Britain and makes a claim to be the oldest town in Britain.

2006 Colchester Borough Council election

The 2006 Colchester Borough Council election took place on 4 May 2006 to elect members of Colchester Borough Council in Essex, England. One third of the council was up for election and the council stayed under no overall control.

2008 Woking Borough Council election

The 2008 Woking Council election took place on 1 May 2008 to elect members of Woking Borough Council in Surrey, England. One third of the council was up for election and the Conservative party stayed in overall control of the council.

2003 Colchester Borough Council election

The 2003 Colchester Borough Council election took place on 1 May 2003 to elect members of Colchester Borough Council in Essex, England. This was the same day as the other 2003 United Kingdom local elections. One third of the seats were up for election and the council stayed under no overall control.

2014 St Albans City and District Council election

The 2014 St Albans City and District Council election took place on 22 May 2014 to elect members of St Albans District Council in Hertfordshire, England. One third of the council was up for election and the council stayed under no overall control.

The 2014 Fareham Borough Council elections took place on 22 May 2014 to elect half the members of Fareham Borough Council in Hampshire, England. The Conservative Party are currently the largest party on the council. The last time these seats were contested was in 2010.

2014 Calderdale Metropolitan Borough Council election

The 2014 Calderdale Metropolitan Borough Council election took place on 22 May 2014 to elect members of Calderdale Metropolitan Borough Council in England. This was on the same day as local elections across the United Kingdom and a European election. One councillor was elected in each of the 17 wards for a four-year term. There are three councillors representing each ward elected on a staggered basis so one third of the councillor seats were up for re-election. The seats had previously been contested in 2010 which was held in conjunction with a general election. The turnout was significantly lower in 2014 than in 2010 which is not unusual when comparing local elections that coincide with general elections to ones that do not. Prior to the election Labour was the largest party in the council with 21 out of 51 seats, 5 seats short of an overall majority. After the election there was no overall control of the council. Labour had 25 seats, only one short of a majority and so Labour continued to operate a minority administration.

2007 Colchester Borough Council election

The 2007 Colchester Borough Council election took place on 3 May 2007 to elect members of Colchester Borough Council in Essex, England. One third of the council was up for election and the council stayed under no overall control.

2008 Colchester Borough Council election

The 2008 Colchester Borough Council election took place on 1 May 2008 to elect members of Colchester Borough Council in Essex, England. One third of the council was up for election and the Conservative party lost overall control of the council to no overall control.

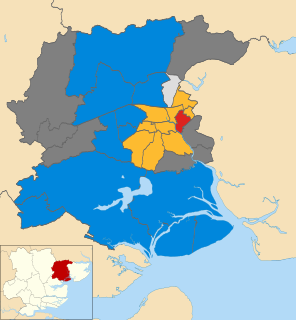
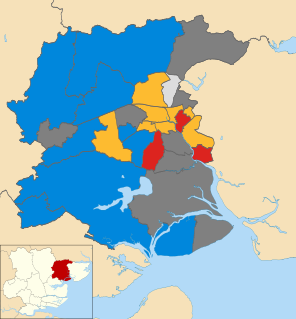
The 2014 Colchester Borough Council election took place on 22 May 2014 to elect members of Colchester Borough Council in Essex, England. One third of the council was up for election and the council stayed under no overall control.

2014 Havant Borough Council election

The 2014 Havant Borough Council election took place on 22 May 2014 to elect members of Havant Borough Council in Hampshire, England. One third of the council was up for election and the Conservative party stayed in overall control of the council.

2014 St Helens Metropolitan Borough Council election

The 2014 St Helens Metropolitan Borough Council election took place on 22 May 2014 to elect members of St Helens Metropolitan Borough Council in Merseyside, England. One third of the council was up for election and the Labour party stayed in overall control of the council.

2015 South Norfolk District Council election

The 2015 South Norfolk District Council election was held on Thursday 7 May 2015 to elect the whole council as part of United Kingdom local elections, 2015 coinciding with the general election. The council continued to consist of 46 councillors and as immediately after the previous election, the council was controlled by local Conservatives, with local Liberal Democrats being the only opposition. The governing group's numbers were augmented by two councillors at the expense of that opposition group. Three defecting-from-majority independent councillors lost their council seats.

Elections for Boston Borough Council, which governs as a second-tier authority the Borough of Boston were held on Thursday 7 May 2015. Following Boundary Commission changes between this election and the previous in 2011 to the wards, 30 councillors were elected to serve 15 wards. The election was held on the same day as other local elections.

Elections to Colchester Borough Council took place on 5 May 2016. Colchester Borough Council normally elects one third of its councillors each year, however, due to boundary changes, the whole council is up for election.

Elections to Colchester Borough Council took place on 3 May 2018. Seventeen members of the council were elected, one from each of the 17 wards. It was the first standard election to take place following comprehensive boundary changes in 2016.

2018 Hyndburn Borough Council election

A by-thirds Hyndburn Borough Council local election, was held on Thursday 03 May 2018. Approximately one third of the local council's 35 seats fall up for election on that day.

Elections to Cannock Chase District Council took place on 3 May 2018 on the same day as other local elections in England. A third of the council was up for election, meaning a total of 13 councillors were elected from all but two of the council's wards.

2018 City of Bradford Metropolitan District Council election

The 2018 City of Bradford Metropolitan District Council took place on 3 May 2018 to elect members of Bradford District Council in England. This was on the same day as other local elections. One councillor was elected in each ward for a four-year term so the councillors elected in 2018 last stood for election in 2014. Each ward is represented by three councillors, the election of which is staggered, so only one third of the councillors were elected in this election. Before the election there was a Labour majority and afterwards Labour had increased their majority.

2018 Sunderland City Council election

The 2018 Sunderland City Council election took place on 3 May 2018 to elect members of Sunderland City Council in England. The election took place on the same day as other local elections.

References

  1. "Upcoming elections & referendums". The Electoral Commission. Archived from the original on 15 March 2015. Retrieved 7 April 2015.
  2. "Statement of Persons Nominated". Colchester Borough Council. Adrian Pritchard (Returning Officer). Retrieved 12 April 2015.
  3. "Wivenhoe By-Election - 3rd July 2014". Colchester Borough Council. Retrieved 3 June 2014.
  4. 1 2