This article does not cite any sources . (August 2017) (Learn how and when to remove this template message) |
The 1991 Tendring District Council election took place on 2 May 1991 to elect members of Tendring District Council in England. This was on the same day as other local elections.
England is a country that is part of the United Kingdom. It shares land borders with Wales to the west and Scotland to the north-northwest. The Irish Sea lies west of England and the Celtic Sea lies to the southwest. England is separated from continental Europe by the North Sea to the east and the English Channel to the south. The country covers five-eighths of the island of Great Britain, which lies in the North Atlantic, and includes over 100 smaller islands, such as the Isles of Scilly and the Isle of Wight.
TBA
Below are the full results for the election. [1]
Party | Candidate | Votes | % | ± | |
---|---|---|---|---|---|
Liberal Democrat | D. Fitch | 873 | 29.2 | +5.1 | |
Liberal Democrat | J. Hayward | 786 | 26.3 | +4.8 | |
Conservative | P. Bates | 518 | 17.3 | -4.0 | |
Conservative | R. Vosper | 492 | 16.5 | -2.5 | |
Labour | J. Hickingbotham | 319 | 10.7 | +3.0 | |
Turnout | 56.0 | ||||
Liberal Democrat hold | Swing | ||||
Party | Candidate | Votes | % | ± | |
---|---|---|---|---|---|
Conservative | M. Robinson | 325 | 46.6 | -10.2 | |
Green | R. Watson | 173 | 24.8 | N/A | |
Liberal Democrat | B. Swinscoe | 121 | 17.3 | N/A | |
Labour | C. Hockley | 79 | 11.3 | -8.3 | |
Turnout | 47.0 | ||||
Conservative hold | Swing | ||||
Party | Candidate | Votes | % | ± | |
---|---|---|---|---|---|
Independent | J. Powell | 355 | 50.4 | -4.2 | |
Liberal Democrat | A. Newman | 350 | 49.6 | +15.7 | |
Turnout | 40.9 | ||||
Independent hold | Swing | ||||
Party | Candidate | Votes | % | ± | |
---|---|---|---|---|---|
Liberal Democrat | D. Harper | 1,825 | 28.6 | +0.5 | |
Liberal Democrat | O. Collard | 1,808 | 28.4 | +0.8 | |
Conservative | D. Pearce | 936 | 14.7 | -2.5 | |
Conservative | P. Vanner | 914 | 14.3 | -2.6 | |
Labour | R. McKenny | 448 | 7.0 | +1.7 | |
Labour | M. McKenny | 446 | 7.0 | +2.1 | |
Turnout | |||||
Liberal Democrat hold | Swing | ||||
Party | Candidate | Votes | % | ± | |
---|---|---|---|---|---|
Independent | R. McLaren | 427 | 51.0 | N/A | |
Conservative | J. Isaac | 410 | 49.0 | -3.0 | |
Turnout | |||||
Independent gain from Conservative | Swing | ||||
Party | Candidate | Votes | % | ± | |
---|---|---|---|---|---|
Independent | P. Patrick | 849 | 33.0 | +0.3 | |
Liberal Democrat | T. Dale | 694 | 27.0 | +2.3 | |
Labour | C. Oliver | 516 | 20.1 | +6.4 | |
Conservative | R. Morgan | 510 | 19.9 | -12.8 | |
Turnout | |||||
Independent hold | Swing | ||||
Liberal Democrat gain from Conservative | Swing | ||||
Party | Candidate | Votes | % | ± | |
---|---|---|---|---|---|
Liberal Democrat | D. Dixon | 724 | 31.5 | -13.1 | |
Independent | J. Partridge | 589 | 25.6 | N/A | |
Conservative | P. Coupland | 557 | 24.2 | -17.0 | |
Labour | A. Oliver | 432 | 18.8 | +4.6 | |
Turnout | |||||
Liberal Democrat hold | Swing | ||||
Independent gain from Conservative | Swing | ||||
Party | Candidate | Votes | % | ± | |
---|---|---|---|---|---|
Conservative | L. Parrish | 488 | 51.9 | -12.9 | |
Labour | T. Laughton | 224 | 23.8 | -11.4 | |
Liberal Democrat | N. Ford | 179 | 19.0 | N/A | |
Green | Chris Fox | 49 | 5.2 | N/A | |
Turnout | |||||
Conservative hold | Swing | ||||
Party | Candidate | Votes | % | ± | |
---|---|---|---|---|---|
Conservative | W. Shelton | 1,762 | 26.2 | ||
Conservative | A. Finnegan-Butler | 1,660 | 24.7 | ||
Conservative | E. Allen | 1,658 | 24.6 | ||
Liberal Democrat | J. Russell | 712 | 10.6 | ||
Labour | D. Enever | 362 | 5.4 | ||
Labour | G. Stevens | 314 | 4.7 | ||
Labour | L. Stevens | 263 | 3.9 | ||
Turnout | |||||
Conservative hold | Swing | ||||
Party | Candidate | Votes | % | ± | |
---|---|---|---|---|---|
Labour | R. Smith | 1,077 | 32.3 | +23.4 | |
Labour | J. Fluin | 835 | 25.0 | N/A | |
Ratepayer | R. Druce | 348 | 10.4 | -16.7 | |
Conservative | P. Harding | 345 | 10.3 | -16.7 | |
Conservative | F. Butler | 339 | 10.2 | N/A | |
Ratepayer | R. Finn | 268 | 8.0 | -13.3 | |
Liberal Democrat | A. Wallis | 127 | 3.8 | -5.2 | |
Turnout | |||||
Labour gain from Residents | Swing | ||||
Labour gain from Conservative | Swing | ||||
Party | Candidate | Votes | % | ± | |
---|---|---|---|---|---|
Conservative | D. Wood | 304 | 36.5 | -11.7 | |
Liberal Democrat | R. Holmes | 276 | 33.2 | +7.5 | |
Labour | J. Besser | 252 | 30.3 | +1.0 | |
Turnout | |||||
Conservative hold | Swing | ||||
Party | Candidate | Votes | % | ± | |
---|---|---|---|---|---|
Liberal Democrat | R. Taylor | 571 | 65.5 | -23.5 | |
Conservative | G. Lord | 301 | 34.5 | -16.3 | |
Turnout | |||||
Liberal Democrat gain from Conservative | Swing | ||||
Party | Candidate | Votes | % | ± | |
---|---|---|---|---|---|
Liberal Democrat | A. Elvin | 282 | 52.6 | N/A | |
Conservative | S. Pound | 254 | 47.4 | -30.5 | |
Turnout | |||||
Liberal Democrat gain from Conservative | Swing | ||||
Party | Candidate | Votes | % | ± | |
---|---|---|---|---|---|
Independent Conservative | F. Good | 551 | 27.6 | ||
Labour | E. Brand | 504 | 25.3 | ||
Labour | P. Newall | 378 | 19.0 | ||
Conservative | J. Rutson-Kemp | 289 | 14.5 | ||
Liberal Democrat | C. Townsend | 271 | 13.6 | ||
Turnout | |||||
Independent Conservative gain from Conservative | Swing | ||||
Labour hold | Swing | ||||
Party | Candidate | Votes | % | ± | |
---|---|---|---|---|---|
Labour | P. Brand | 575 | 23.8 | ||
Conservative | W. Bleakley | 566 | 23.4 | ||
Labour | P. Hale | 516 | 21.3 | ||
Conservative | D. Rutson-Kemp | 474 | 19.6 | ||
Liberal Democrat | K. Tully | 289 | 11.9 | ||
Turnout | |||||
Labour gain from Conservative | Swing | ||||
Conservative hold | Swing | ||||
Party | Candidate | Votes | % | ± | |
---|---|---|---|---|---|
Labour | R. Knight | 1,153 | 42.9 | ||
Labour | W. Mixter | 866 | 32.2 | ||
Conservative | E. Yallop | 670 | 24.9 | ||
Turnout | |||||
Labour hold | Swing | ||||
Labour gain from Conservative | Swing | ||||
Party | Candidate | Votes | % | ± | |
---|---|---|---|---|---|
Labour | S. Henderson | 681 | 26.8 | ||
Labour | D. Robson | 535 | 21.1 | ||
Conservative | J. Spall | 504 | 19.9 | ||
Conservative | G. Wallington-Hayes | 468 | 18.4 | ||
Liberal Democrat | T. Booth | 350 | 13.8 | ||
Turnout | |||||
Labour gain from Conservative | Swing | ||||
Labour hold | Swing | ||||
Party | Candidate | Votes | % | ± | |
---|---|---|---|---|---|
Residents | J. Hewitt | 926 | 34.6 | ||
Residents | E. Fone | 839 | 31.3 | ||
Conservative | V. Stone | 445 | 16.6 | ||
Labour | W. Jefferson | 351 | 13.1 | ||
Labour | K. Sacre | 117 | 4.4 | ||
Turnout | |||||
Residents hold | Swing | ||||
Party | Candidate | Votes | % | ± | |
---|---|---|---|---|---|
Independent | T. Oxborrow | 1,426 | 45.1 | ||
Conservative | H. Rickards | 1,085 | 34.3 | ||
Labour | C. Nimmo | 351 | 11.1 | ||
Labour | A. Rout | 303 | 9.6 | ||
Turnout | |||||
Independent gain from Liberal Democrat | Swing | ||||
Conservative hold | Swing | ||||
Party | Candidate | Votes | % | ± | |
---|---|---|---|---|---|
Labour | L. Randall | 816 | 22.5 | ||
Conservative | D. Pallett | 684 | 18.8 | ||
Liberal Democrat | D. Kelly | 628 | 17.3 | ||
Labour | N. Harbach | 588 | 16.2 | ||
Conservative | R. Streames | 487 | 13.4 | ||
Liberal Democrat | G. Potter | 427 | 11.8 | ||
Turnout | |||||
Labour gain from Conservative | Swing | ||||
Conservative hold | Swing | ||||
Party | Candidate | Votes | % | ± | |
---|---|---|---|---|---|
Independent Conservative | P. De-Vaux Balbirnie | 490 | 56.3 | ||
Liberal Democrat | J. Barry | 380 | 43.7 | ||
Turnout | |||||
Independent Conservative hold | Swing | ||||
Party | Candidate | Votes | % | ± | |
---|---|---|---|---|---|
Liberal Democrat | R. Smith | 502 | 57.0 | ||
Labour | F. Fairhall | 196 | 22.3 | ||
Conservative | S. Smith | 182 | 20.7 | ||
Turnout | |||||
Liberal Democrat hold | Swing | ||||
Party | Candidate | Votes | % | ± | |
---|---|---|---|---|---|
Labour | W. Elmer | Unopposed | |||
Turnout | N/A | N/A | N/A | ||
Labour hold | Swing | ||||
Party | Candidate | Votes | % | ± | |
---|---|---|---|---|---|
Labour | C. Baker | 696 | 13.8 | ||
Conservative | I. Powell | 696 | 13.8 | ||
Conservative | M. Amos | 689 | 13.6 | ||
Conservative | G. Downing | 649 | 12.8 | ||
Labour | G. Mills | 639 | 12.6 | ||
Labour | C. Poulton | 626 | 12.4 | ||
Liberal Democrat | A. McCormick | 345 | 6.8 | ||
Liberal Democrat | M. Lonsdale | 337 | 6.7 | ||
Liberal Democrat | D. Rhodes | 318 | 6.3 | ||
Independent | C. Humphrey | 62 | 1.2 | ||
Turnout | |||||
Labour gain from Conservative | Swing | ||||
Conservative hold | Swing | ||||
Party | Candidate | Votes | % | ± | |
---|---|---|---|---|---|
Liberal Democrat | M. Jay | 898 | 15.6 | ||
Conservative | J. Molyneaux | 894 | 15.6 | ||
Conservative | C. Jessop | 878 | 15.3 | ||
Liberal Democrat | B. White | 857 | 14.9 | ||
Liberal Democrat | I. Barker | 848 | 14.8 | ||
Conservative | L. King | 794 | 13.8 | ||
Labour | J. Bond | 234 | 4.1 | ||
Labour | I. Jefferson | 172 | 3.0 | ||
Labour | A. Parlour | 167 | 2.9 | ||
Turnout | |||||
Liberal Democrat gain from Conservative | Swing | ||||
Conservative hold | Swing | ||||
Party | Candidate | Votes | % | ± | |
---|---|---|---|---|---|
Residents | J. Cole | Unopposed | |||
Residents | A. Tovey | Unopposed | |||
Turnout | |||||
Residents hold | Swing | ||||
Party | Candidate | Votes | % | ± | |
---|---|---|---|---|---|
Liberal Democrat | D. Tunstill | 799 | 15.6 | ||
Conservative | A. Overton | 769 | 15.0 | ||
Conservative | R. Gladwin | 695 | 13.5 | ||
Conservative | J. Spreadbury | 670 | 13.0 | ||
Liberal Democrat | J. Robdrup | 644 | 12.5 | ||
Liberal Democrat | B. Kear | 620 | 12.1 | ||
Labour | K. Frost | 325 | 6.3 | ||
Labour | M. Newman | 318 | 6.2 | ||
Labour | W. Dunne | 296 | 5.8 | ||
Turnout | |||||
Liberal Democrat hold | Swing | ||||
Conservative hold | Swing | ||||
Party | Candidate | Votes | % | ± | |
---|---|---|---|---|---|
Liberal Democrat | P. Bevan | 2,220 | 28.4 | ||
Liberal Democrat | W. Bensilum | 2,020 | 25.8 | ||
Liberal Democrat | P. Manning | 1,978 | 25.3 | ||
Conservative | V. Franklin | 425 | 5.4 | ||
Conservative | P. Harmer | 376 | 4.8 | ||
Labour | S. Morley | 296 | 3.8 | ||
Labour | M. Souter | 259 | 3.3 | ||
Labour | S. Parlour | 256 | 3.3 | ||
Turnout | |||||
Liberal Democrat hold | Swing | ||||
Party | Candidate | Votes | % | ± | |
---|---|---|---|---|---|
Liberal Democrat | P. Hendy | 953 | 32.5 | ||
Liberal Democrat | J. White | 810 | 27.6 | ||
Conservative | P. Amos | 632 | 21.6 | ||
Conservative | R. Yaxley-White | 537 | 18.3 | ||
Turnout | |||||
Liberal Democrat hold | Swing | ||||
Liberal Democrat gain from Conservative | Swing | ||||
Party | Candidate | Votes | % | ± | |
---|---|---|---|---|---|
Liberal Democrat | M. De Roy | 399 | 52.1 | ||
Conservative | C. Lumber | 367 | 47.9 | ||
Turnout | |||||
Liberal Democrat gain from Conservative | Swing | ||||
Party | Candidate | Votes | % | ± | |
---|---|---|---|---|---|
Conservative | D. Hall | 1,410 | 19.5 | ||
Conservative | D. Aldrich | 1,362 | 18.9 | ||
Conservative | M. Page | 1,338 | 18.5 | ||
Labour | P. Lawes | 1,091 | 15.1 | ||
Labour | J. Bird | 1,036 | 14.4 | ||
Labour | B. Theadom | 978 | 13.6 | ||
Turnout | |||||
Conservative hold | Swing | ||||
Ivan John Henderson is a Labour Party politician in the United Kingdom. He was the Member of Parliament (MP) for Harwich from 1997 to 2005. He is currently a member of Essex County Council for Harwich.
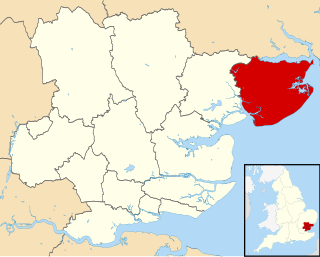
Tendring is a local government district in north east Essex, England. It extends from the River Stour in the north, to the coast and the River Colne in the south, with the coast to the east and the town of Colchester to the west. Its council is based in Clacton-on-Sea. Towns in the district include Frinton-on-Sea, Walton-on-the-Naze, Brightlingsea and Harwich. Large villages in the district include St Osyth and Great Bentley.
Manningtree is a town and civil parish in the Tendring district of Essex, England, which lies on the River Stour. It adjoins built-up areas of Lawford to the west and Mistley to the east and the three parishes together are sometimes referred to as "Manningtree".
Thorpe-le-Soken is a village and civil parish in the Tendring district of Essex, England located west of Walton-on-the-Naze, Frinton-on-Sea and north of Clacton-on-Sea.
North Essex was a parliamentary constituency represented in the House of Commons of the Parliament of the United Kingdom between 1997 and 2010. It elected one Member of Parliament (MP) by the first past the post system of election.
Harwich was a parliamentary constituency represented in the House of Commons of the Parliament of the United Kingdom. Until its abolition for the 2010 general election it elected one Member of Parliament (MP) by the first past the post system of election.
Giles Francis Watling is an English actor and Conservative politician. He has been the Member of Parliament for Clacton since 8 June 2017.
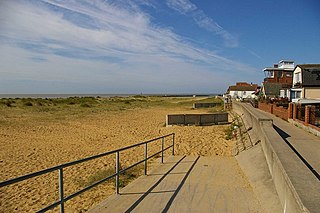
Jaywick is a seaside village in the Tendring district of Essex, England, 2 miles (3 km) west of Clacton-on-Sea. It lies on the North Sea coast of England, 60 miles (97 km) from London and 17 miles (27 km) from Colchester. It was constructed in the 1930s as a holiday resort for Londoners, but over time has become one of the most deprived areas in the country.
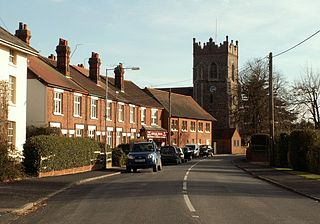
Ardleigh is a village and civil parish in Essex, England. It is situated approximately 4 miles (6 km) northeast from the centre of Colchester and 26 miles (42 km) northeast from the county town of Chelmsford.
Clacton is a constituency in the House of Commons of the UK Parliament, represented since 2017 by Giles Watling of the Conservative Party.
Harwich and North Essex is a constituency represented in the House of Commons of the UK Parliament by Bernard Jenkin of the Conservative Party since its creation in 2010.
Tendring is a village and civil parish in Essex. It gives its name to the Tendring District and before that the Tendring Hundred. Its name was given to the larger groupings because it was at the centre, not because it was larger than the other settlements. In 2011 the parish had a population of 736 and the district had a population of 138,048. The linear village straddles the B1035 from Manningtree to Thorpe-le-Soken.
Tendring District Council in Essex, England is elected every four years. Since the last boundary changes in 2003, 60 councillors have been elected from 32 wards.
The county of Essex is divided into 14 districts. The districts of Essex are Harlow, Epping Forest, Brentwood, Basildon, Castle Point, Rochford, Maldon, Chelmsford, Uttlesford, Braintree, Colchester, Tendring, Thurrock, and Southend-on-Sea.
Tendring First is a local political party operating throughout Tendring, Essex, England. They field candidates for Tendring District Council Frinton and Walton Town Council and Essex County Council. They currently have 1 district councillor on Tendring District Council and hold 10 seats on Frinton & Walton Town Council. They had 1 county councillor on Essex County Council between 2013 and 2016. They do not operate in parliamentary or European elections.
The 2015 Tendring District Council election took place on 7 May 2015 to elect members of Tendring District Council in England. This was on the same day as other local elections.
Elections to Tendring District Council were held in 2011 as part of the wider local elections.
Elections to Tendring District Council were held on 5 May 2007 alongside other local elections across the United Kingdom. The Conservative Party remained the largest party.
Elections to Tendring District Council in Essex, England took place on 6 May 1999. This was on the same day as other local elections across the United Kingdom. Although the Labour Party remained the largest party on the council, it lost overall control while the Conservatives made major gains.
Elections to Tendring District Council took place on 1 May 2003. This was on the same day as other local elections across the United Kingdom.