| |||||||||||||||||||||||||||||||||||||||||||||||||||||||||||
20 seats (out of 60 seats) 31 seats needed for a majority | |||||||||||||||||||||||||||||||||||||||||||||||||||||||||||
---|---|---|---|---|---|---|---|---|---|---|---|---|---|---|---|---|---|---|---|---|---|---|---|---|---|---|---|---|---|---|---|---|---|---|---|---|---|---|---|---|---|---|---|---|---|---|---|---|---|---|---|---|---|---|---|---|---|---|---|
|
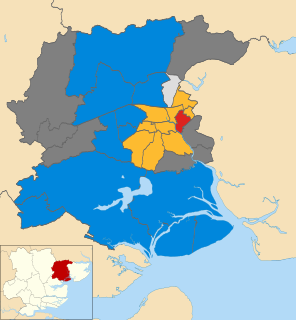
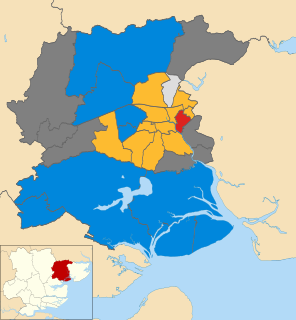
The 2012 Colchester Borough Council election took place on 3 May 2012 to elect members of Colchester Borough Council in Essex, England. One third of the council was up for election and the council stayed under no overall control. [1]
Borough status in the United Kingdom is granted by royal charter to local government districts in England, Wales and Northern Ireland. The status is purely honorary, and does not give any additional powers to the council or inhabitants of the district. In Scotland, similarly chartered communities were known as royal burghs, although the status is no longer granted.
Essex is a county in the south-east of England, north-east of London. One of the home counties, it borders Suffolk and Cambridgeshire to the north, Hertfordshire to the west, Kent across the estuary of the River Thames to the south, and London to the south-west. The county town is Chelmsford, the only city in the county. For government statistical purposes Essex is placed in the East of England region.
England is a country that is part of the United Kingdom. It shares land borders with Wales to the west and Scotland to the north-northwest. The Irish Sea lies west of England and the Celtic Sea lies to the southwest. England is separated from continental Europe by the North Sea to the east and the English Channel to the south. The country covers five-eighths of the island of Great Britain, which lies in the North Atlantic, and includes over 100 smaller islands, such as the Isles of Scilly and the Isle of Wight.
After the election, the composition of the council was
The Liberal Democrats are a liberal political party in the United Kingdom. They presently have 11 Members of Parliament in the House of Commons, 96 members of the House of Lords, and one member of the European Parliament. They also have five Members of the Scottish Parliament and a member each in the Welsh Assembly and London Assembly. The party reached the height of its influence in the early 2010s, forming a junior partner in a coalition government from 2010 to 2015. It is presently led by Vince Cable.
The Conservative Party, officially the Conservative and Unionist Party, is a centre-right political party in the United Kingdom. Presently led by Theresa May, it has been the governing party since 2010. It presently has 314 Members of Parliament in the House of Commons, 249 members of the House of Lords, and 18 members of the European Parliament. It also has 31 Members of the Scottish Parliament, 12 members of the Welsh Assembly, eight members of the London Assembly and 9,008 local councillors. One of the major parties of UK politics, it has formed the government on 45 occasions, more than any other party.
The Labour Party is a centre-left political party in the United Kingdom which has been described as an alliance of social democrats, democratic socialists and trade unionists. The party's platform emphasises greater state intervention, social justice and strengthening workers' rights.
Before the election a coalition between the Liberal Democrats with 26 seats, Labour with 7 seats and the 3 independents ran the council, while the 24 Conseravtives were in opposition. [2] 20 of the seats were contested at the election with the Conservatives aiming to regain seats they had lost at the 2008 election, while the Local Government Information Unit called the election one of the top 50 contests in the 2012 local elections. [2]
The Local Government information Unit (LGiU) is a London-based thinktank and registered charity. Established in 1983 as a membership organisation for UK local authorities, the LGiU states that its mission is to strengthen local democracy and put citizens in control of their own lives, communities and services. The LGiU has around 200 local authority members and a wide range of associate members and partner organisations.
The Conservatives called for the council to change to full council elections every four years, for food waste pick ups to be introduced immediately and for a push to keep the town centre clean. [2] However the Liberal Democrats defended their record in leading the council pointing to a freeze in council tax, recycling rates and contrasted their record in control with the former Conservative administration. [3] Meanwhile, Labour was supported during the campaign by a visit from the former Labour cabinet minister Hazel Blears. [4]
Recycling is the process of converting waste materials into new materials and objects. It is an alternative to "conventional" waste disposal that can save material and help lower greenhouse gas emissions. Recycling can prevent the waste of potentially useful materials and reduce the consumption of fresh raw materials, thereby reducing: energy usage, air pollution, and water pollution.
A Cabinet is a body of high-ranking state officials, typically consisting of the top leaders of the executive branch. Members of a cabinet are usually called Cabinet ministers or secretaries. The function of a Cabinet varies: in some countries it is a collegiate decision-making body with collective responsibility, while in others it may function either as a purely advisory body or an assisting institution to a decision making head of state or head of government. Cabinets are typically the body responsible for the day-to-day management of the government and response to sudden events, whereas the legislative and judicial branches work in a measured pace, in sessions according to lengthy procedures.
Hazel Anne Blears is a British Labour Party politician, who was the Member of Parliament (MP) for Salford and Eccles from 2010 to 2015, when she stood down. Prior to the creation of the Salford and Eccles constituency, she was the MP for Salford from 1997.
The only change at the election saw Labour gain one seat from the Conservatives in Wivenhoe Quay. [5] Meanwhile, the Liberal Democrats remained the largest party on the council with 26 seats despite losing seats across the country. [5] The existing coalition between the Liberal Democrats, Labour and independents stayed in control of the council after the election. [6]
Wivenhoe is a town and civil parish in north eastern Essex, England, approximately 3 miles (4.8 km) south east of Colchester. Historically Wivenhoe village, on the banks of the River Colne, and Wivenhoe Cross, on the higher ground to the north, were two separate settlements but with considerable development in the 19th century the two have merged.
Party | Seats | Gains | Losses | Net gain/loss | Seats % | Votes % | Votes | +/− | |
---|---|---|---|---|---|---|---|---|---|
Liberal Democrat | 9 | 0 | 0 | 0 | 45.0 | 32.6 | 10,073 | -4.6 | |
Conservative | 6 | 0 | 1 | -1 | 30.0 | 28.9 | 8,917 | -8.4 | |
Labour | 4 | 1 | 0 | +1 | 20.0 | 24.0 | 7,401 | +11.0 | |
Independent | 1 | 0 | 0 | 0 | 5.0 | 4.5 | 1,405 | -1.0 | |
Green | 0 | 0 | 0 | 0 | 0 | 7.3 | 2,268 | -1.2 | |
UKIP | 0 | 0 | 0 | 0 | 0 | 2.7 | 824 | N/A |
Changes in vote share are compared to the 2008 election as that is the last election to which results can be directly compared. This is due to the nature of Colchester's staggered elections in that the exact set of seats are only up for election once every 4 years.
Party | Candidate | Votes | % | ± | |
---|---|---|---|---|---|
Labour Co-op | Kim Alan Naish | 1,044 | 58.2 | -6.4 | |
Liberal Democrat | Shibbir Ahmed | 286 | 16.0 | +2.2 | |
UKIP | John Pitts | 219 | 12.2 | +12.2 | |
Conservative | Hayley Louise Crumb | 192 | 10.7 | -7.9 | |
Green | Tobie Glenny | 52 | 2.9 | -0.1 | |
Majority | 758 | 42.3 | -3.7 | ||
Turnout | 1,793 | 27.6 | -10.7 | ||
Labour hold | Swing |
Party | Candidate | Votes | % | ± | |
---|---|---|---|---|---|
Liberal Democrat | Josephine Hayes | 861 | 40.4 | +0.3 | |
Green | Peter James Lynn | 395 | 18.6 | -7.1 | |
Conservative | Mohammed Shamim Rashid | 382 | 17.9 | -3.1 | |
Labour | Robert Fisher | 285 | 13.4 | +0.2 | |
UKIP | Ron Levy | 206 | 9.7 | +9.7 | |
Majority | 466 | 21.9 | +7.6 | ||
Turnout | 2,129 | 30.0 | -9.5 | ||
Liberal Democrat hold | Swing |
Party | Candidate | Votes | % | ± | |
---|---|---|---|---|---|
Conservative | Mark Ashley Cable | 596 | 71.3 | -11.5 | |
Liberal Democrat | Carolyn Catney | 81 | 9.7 | +0.3 | |
Labour | Paul Henry Fryer-Kelsey | 81 | 9.7 | +5.4 | |
Green | Clarice Elizabeth Mort | 78 | 9.3 | +5.8 | |
Majority | 515 | 61.6 | -11.8 | ||
Turnout | 836 | 34.2 | -11.4 | ||
Conservative hold | Swing |
Party | Candidate | Votes | % | ± | |
---|---|---|---|---|---|
Labour | Michael Edward Charles Lilley | 488 | 64.5 | +21.7 | |
Conservative | Peter James Hare | 209 | 27.6 | -14.4 | |
Green | Roger Edwin Bamforth | 39 | 5.2 | -1.9 | |
Liberal Democrat | Susan Mary Waite | 21 | 2.8 | -5.4 | |
Majority | 279 | 36.9 | +36.0 | ||
Turnout | 757 | 37.3 | -3.9 | ||
Labour hold | Swing |
Party | Candidate | Votes | % | ± | |
---|---|---|---|---|---|
Liberal Democrat | Julia Pauline Havis | 663 | 54.7 | -3.2 | |
Labour | Jordan Alexander Newall | 298 | 24.6 | +11.5 | |
UKIP | Mark Robert Cole | 91 | 7.5 | +7.5 | |
Conservative | Anthony Baines | 84 | 6.9 | -16.4 | |
Green | Clare Teresa Palmer | 77 | 6.3 | +0.6 | |
Majority | 365 | 30.1 | -4.6 | ||
Turnout | 1,213 | 27.6 | -28.3 | ||
Liberal Democrat hold | Swing |
Party | Candidate | Votes | % | ± | |
---|---|---|---|---|---|
Independent | Beverley Anne Oxford | 1,211 | 67.8 | +6.4 | |
Conservative | Tatiana Mills | 167 | 9.4 | -7.3 | |
Labour | Michael Finbarr Gilheany | 145 | 8.1 | -0.1 | |
Liberal Democrat | Barry Ronald Woodward | 110 | 6.2 | -3.0 | |
UKIP | William John Rowley | 80 | 4.5 | +4.5 | |
Green | David John Davis | 72 | 4.0 | -0.5 | |
Majority | 1,044 | 58.5 | +13.8 | ||
Turnout | 1,785 | 26.3 | -10.7 | ||
Independent hold | Swing |
Party | Candidate | Votes | % | ± | |
---|---|---|---|---|---|
Conservative | Brian David Henry Jarvis | 833 | 54.2 | -1.3 | |
Liberal Democrat | Julia Suzanne Nelson | 399 | 26.0 | -8.8 | |
Labour | John Christopher Wood | 174 | 11.3 | +5.9 | |
Green | Beverley Ann Maltby | 131 | 8.5 | +4.3 | |
Majority | 434 | 28.2 | +7.5 | ||
Turnout | 1,537 | 35.7 | -36.4 | ||
Conservative hold | Swing |
Party | Candidate | Votes | % | ± | |
---|---|---|---|---|---|
Conservative | Elizabeth Jewell Blundell | 313 | 54.4 | -9.3 | |
Labour | John Spademan | 162 | 28.2 | +10.8 | |
Green | Robert Charles Brannan | 50 | 8.7 | +2.3 | |
Liberal Democrat | Gillian Mary Collings | 50 | 8.7 | -8.7 | |
Majority | 151 | 26.3 | -20.0 | ||
Turnout | 575 | 28.5 | -6.0 | ||
Conservative hold | Swing |
Party | Candidate | Votes | % | ± | |
---|---|---|---|---|---|
Liberal Democrat | Martin Andrew Goss | 1,467 | 64.4 | +3.5 | |
Conservative | Benjamin Harvey Locker | 535 | 23.5 | -1.1 | |
Labour | Michael John Donnachie | 184 | 8.1 | -1.8 | |
Green | Mary Hilda Bryan | 91 | 4.0 | -0.6 | |
Majority | 932 | 40.9 | +4.6 | ||
Turnout | 2,277 | 30.7 | -10.0 | ||
Liberal Democrat hold | Swing |
Party | Candidate | Votes | % | ± | |
---|---|---|---|---|---|
Liberal Democrat | Peter Michael Higgins | 771 | 52.8 | +3.4 | |
Labour | Stephen Paul Pattison | 273 | 18.7 | -4.7 | |
Green | Robert Paul Spence | 166 | 11.4 | -2.7 | |
Conservative | Lauren Grace McManus | 131 | 9.0 | -4.1 | |
UKIP | Christopher David Treloar | 120 | 8.2 | +8.2 | |
Majority | 498 | 34.1 | +8.1 | ||
Turnout | 1,461 | 23.5 | -10.5 | ||
Liberal Democrat hold | Swing |
Party | Candidate | Votes | % | ± | |
---|---|---|---|---|---|
Conservative | Beverly Ann Davies | 1,048 | 47.2 | +0.2 | |
Liberal Democrat | John Martin Loxley | 665 | 29.9 | -8.0 | |
Labour Co-op | Michael Edward Dale | 332 | 14.9 | +4.4 | |
Green | Peter Charles Appleton | 177 | 8.0 | +3.3 | |
Majority | 383 | 17.2 | +8.1 | ||
Turnout | 2,222 | 37.3 | -18.1 | ||
Conservative hold | Swing |
Party | Candidate | Votes | % | ± | |
---|---|---|---|---|---|
Labour | Tina Jane Dopson | 926 | 61.3 | -6.3 | |
Independent | Robert Rex Hunt | 194 | 12.8 | +12.8 | |
Liberal Democrat | Owen Leslie Bartholomew | 175 | 11.6 | -1.9 | |
UKIP | Harry Raymond Royle | 108 | 7.2 | +7.2 | |
Conservative | Alexander Jordan Evelyn | 107 | 7.1 | -7.4 | |
Majority | 732 | 48.5 | -4.5 | ||
Turnout | 1,510 | 24.5 | -5.5 | ||
Labour hold | Swing |
Party | Candidate | Votes | % | ± | |
---|---|---|---|---|---|
Liberal Democrat | Gaik Choon Chuah | 825 | 55.2 | +5.3 | |
Labour | Luke Michael Powell Dopson | 305 | 20.4 | +1.0 | |
Conservative | Alexandra Claire Hutchinson | 234 | 15.7 | -7.8 | |
Green | Lucinda Helen Glover | 130 | 8.7 | +1.5 | |
Majority | 520 | 34.8 | +8.4 | ||
Turnout | 1,494 | 23.3 | -10.0 | ||
Liberal Democrat hold | Swing |
Party | Candidate | Votes | % | ± | |
---|---|---|---|---|---|
Liberal Democrat | Paul Edward Smith | 994 | 64.4 | +2.3 | |
Conservative | Charles Christian McKay | 333 | 21.6 | -5.9 | |
Labour | Jennifer Mary Fisher | 136 | 8.8 | +1.4 | |
Green | David Traynier | 81 | 5.2 | +2.2 | |
Majority | 661 | 42.8 | +8.2 | ||
Turnout | 1,544 | 37.6 | -34.3 | ||
Liberal Democrat hold | Swing |
Party | Candidate | Votes | % | ± | |
---|---|---|---|---|---|
Liberal Democrat | David Nigel Offen | 745 | 43.8 | +10.1 | |
Conservative | Darius Grant Laws | 514 | 30.3 | -9.0 | |
Labour | Bruce John Tuxford | 334 | 19.7 | -1.6 | |
Green | Walter Schwarz | 106 | 6.2 | +0.5 | |
Majority | 231 | 13.6 | |||
Turnout | 1,699 | 25.0 | -7.9 | ||
Liberal Democrat hold | Swing |
Party | Candidate | Votes | % | ± | |
---|---|---|---|---|---|
Liberal Democrat | Laura Ann Sykes | 1,134 | 55.0 | +4.4 | |
Conservative | Bryan Campbell Johnston | 520 | 25.2 | -6.0 | |
Labour | David Alexander Hough | 297 | 14.4 | +0.2 | |
Green | Pamela Elizabeth Nelson | 111 | 5.4 | +1.5 | |
Majority | 614 | 29.8 | +10.4 | ||
Turnout | 2,062 | 32.7 | -10.9 | ||
Liberal Democrat hold | Swing |
Party | Candidate | Votes | % | ± | |
---|---|---|---|---|---|
Conservative | Richard Martin | 772 | 48.1 | -10.5 | |
Labour | Martyn Keith Warnes | 580 | 36.1 | +10.2 | |
Green | Katherine Helen Bamforth | 156 | 9.7 | +2.4 | |
Liberal Democrat | Beth Eileen Margaret Gudgeon | 97 | 6.0 | -2.3 | |
Majority | 192 | 12.0 | -20.7 | ||
Turnout | 1,605 | 26.8 | -13.6 | ||
Conservative hold | Swing |
Party | Candidate | Votes | % | ± | |
---|---|---|---|---|---|
Conservative | Glenn Darren Granger | 1,196 | 69.1 | +13.9 | |
Labour | Barbara Rosemary Nichols | 267 | 15.4 | +5.1 | |
Green | Francis Ian Barton | 138 | 8.0 | +3.5 | |
Liberal Democrat | Jennifer Stevens | 130 | 7.5 | +0.4 | |
Majority | 929 | 53.7 | +21.3 | ||
Turnout | 1,731 | 29.2 | -20.4 | ||
Conservative hold | Swing |
Party | Candidate | Votes | % | ± | |
---|---|---|---|---|---|
Liberal Democrat | Jonathan Simon Manning | 477 | 52.8 | +1.5 | |
Conservative | Mo Metcalf-Fisher | 192 | 21.3 | +2.7 | |
Labour Co-op | Tyron Ashleigh Wilson | 175 | 19.4 | -3.7 | |
Green | Maria Iacovou | 59 | 6.5 | -0.6 | |
Majority | 285 | 31.6 | +3.4 | ||
Turnout | 903 | 25.0 | -11.8 | ||
Liberal Democrat hold | Swing |
Party | Candidate | Votes | % | ± | |
---|---|---|---|---|---|
Labour Co-op | Cyril Patrick Liddy | 915 | 52.1 | -5.0 | |
Conservative | Robert Arthur Needham | 559 | 31.9 | +6.3 | |
Green | Sandra Adele Moog | 159 | 9.1 | -0.6 | |
Liberal Democrat | Benjamin David Edward Richards | 122 | 7.0 | -0.7 | |
Majority | 356 | 20.3 | -11.2 | ||
Turnout | 1,755 | 41.7 | -11.6 | ||
Labour Co-op gain from Conservative | Swing | ||||
The 2006 Colchester Borough Council election took place on 4 May 2006 to elect members of Colchester Borough Council in Essex, England. One third of the council was up for election and the council stayed under no overall control.
The 2007 St Helens Metropolitan Borough Council election took place on 3 May 2007 to elect members of St Helens Metropolitan Borough Council in Merseyside, England. One third of the council was up for election and the council stayed under no overall control.
The 1998 Pendle Borough Council election took place on 7 May 1998 to elect members of Pendle Borough Council in Lancashire, England. One third of the council was up for election and the Liberal Democrats stayed in overall control of the council.
The 2002 Basingstoke and Deane Council election took place on 2 May 2002 to elect members of Basingstoke and Deane Borough Council in Hampshire, England. The whole council was up for election with boundary changes since the last election in 2000 increasing the number of seats by 3. The council stayed under no overall control.
The 2007 Redcar and Cleveland Borough Council election took place on 3 May 2007 to elect members of Redcar and Cleveland Unitary Council in England. The whole council was up for election and the council stayed under no overall control.
The 2002 Colchester Borough Council election took place on 2 May 2002 to elect members of Colchester Borough Council in Essex, England. This was the same day as the other 2002 local elections in the United Kingdom. Due to boundary changes, every seat was up for election and the council stayed under no overall control.
The 2003 Colchester Borough Council election took place on 1 May 2003 to elect members of Colchester Borough Council in Essex, England. This was the same day as the other 2003 United Kingdom local elections. One third of the seats were up for election and the council stayed under no overall control.
The 2004 Colchester Borough Council election took place on 10 June 2004 to elect members of Colchester Borough Council in Essex, England. This was the same day as the other 2004 United Kingdom local elections and as the 2004 European Parliament Elections. One third of the seats were up for election and the council stayed under no overall control.
The 2014 Calderdale Metropolitan Borough Council election took place on 22 May 2014 to elect members of Calderdale Metropolitan Borough Council in England. This was on the same day as local elections across the United Kingdom and a European election. One councillor was elected in each of the 17 wards for a four-year term. There are three councillors representing each ward elected on a staggered basis so one third of the councillor seats were up for re-election. The seats had previously been contested in 2010 which was held in conjunction with a general election. The turnout was significantly lower in 2014 than in 2010 which is not unusual when comparing local elections that coincide with general elections to ones that do not. Prior to the election Labour was the largest party in the council with 21 out of 51 seats, 5 seats short of an overall majority. After the election there was no overall control of the council. Labour had 25 seats, only one short of a majority and so Labour continued to operate a minority administration.
The 2000 Colchester Borough Council election took place on 4 May 2000 to elect members of Colchester Borough Council in Essex, England. One third of the council was up for election and the council stayed under no overall control.
The 2007 Colchester Borough Council election took place on 3 May 2007 to elect members of Colchester Borough Council in Essex, England. One third of the council was up for election and the council stayed under no overall control.
The 2008 Colchester Borough Council election took place on 1 May 2008 to elect members of Colchester Borough Council in Essex, England. One third of the council was up for election and the Conservative party lost overall control of the council to no overall control.
The 2010 Colchester Borough Council election took place on 6 May 2010 to elect members of Colchester Borough Council in Essex, England. One third of the council was up for election and the council stayed under no overall control.
The 2011 Colchester Borough Council election took place on 5 May 2011 to elect members of Colchester Borough Council in Essex, England. One third of the council was up for election and the council stayed under no overall control.
The 2014 Colchester Borough Council election took place on 22 May 2014 to elect members of Colchester Borough Council in Essex, England. One third of the council was up for election and the council stayed under no overall control.
The 2011 Pendle Borough Council election took place on 5 May 2011 to elect members of Pendle Borough Council in Lancashire, England. One third of the council was up for election and the council stayed under no overall control.
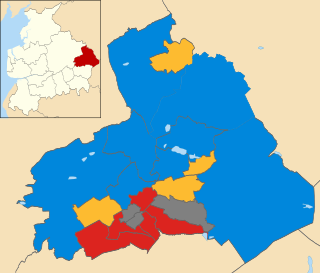
The 2012 Pendle Borough Council election took place on 3 May 2012 to elect members of Pendle Borough Council in Lancashire, England. One third of the council was up for election and the council stayed under no overall control.
The 2010 Brent London Borough Council election took place on 6 May 2010 to elect members of Brent London Borough Council in London, England. The whole council was up for election and the Labour party gained overall control of the council from no overall control.
The 2014 Brent London Borough Council election took place on 22 May 2014 to elect members of Brent London Borough Council in London, England. The whole council was up for election and the Labour Party stayed in overall control of the council.
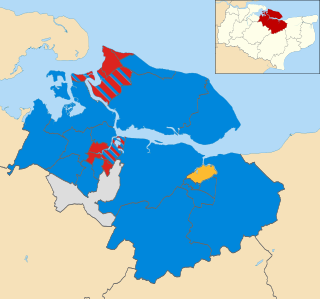
The 2011 Swale Borough Council election took place on 5 May 2011 to elect members of Swale Borough Council in Kent, England. The whole council was up for election and the Conservative party stayed in overall control of the council.