Colchester Borough Council election, 2014

Last updated

Colchester Borough Council election, 2014
Flag of the United Kingdom.svg
  2012 22 May 2014 (2014-05-22) 2015  

20 out of 60 seats to Colchester Borough Council
31 seats needed for a majority

 First partySecond party
  No image wide.svg No image wide.svg
Party Liberal Democrat Conservative
Seats before26
seats up: 10
23
seats up: 8
Seats won98
Seats after2523
Seat changeDecrease2.svg1Steady2.svg
Popular vote8,98813,144
Percentage23.033.6
SwingDecrease2.svg16.9Decrease2.svg4.3

 Third partyFourth party
  No image wide.svg No image wide.svg
Party Labour Independent
Seats before7
seats up: 1
3
seats up: 1
Seats won21
Seats after83
Seat changeIncrease2.svg1Steady2.svg
Popular vote6,3341,127
Percentage15.82.9
SwingIncrease2.svg3.2Decrease2.svg1.0

The 2014 Colchester Borough Council election took place on 22 May 2014 to elect members of Colchester Borough Council in Essex, England. One third of the council was up for election and the council stayed under no overall control. [1]

Borough status in the United Kingdom is granted by royal charter to local government districts in England, Wales and Northern Ireland. The status is purely honorary, and does not give any additional powers to the council or inhabitants of the district. In Scotland, similarly chartered communities were known as royal burghs, although the status is no longer granted.

Essex County of England

Essex is a county in the south-east of England, north-east of London. One of the home counties, it borders Suffolk and Cambridgeshire to the north, Hertfordshire to the west, Kent across the estuary of the River Thames to the south, and London to the south-west. The county town is Chelmsford, the only city in the county. For government statistical purposes Essex is placed in the East of England region.

England Country in north-west Europe, part of the United Kingdom

England is a country that is part of the United Kingdom. It shares land borders with Wales to the west and Scotland to the north-northwest. The Irish Sea lies west of England and the Celtic Sea lies to the southwest. England is separated from continental Europe by the North Sea to the east and the English Channel to the south. The country covers five-eighths of the island of Great Britain, which lies in the North Atlantic, and includes over 100 smaller islands, such as the Isles of Scilly and the Isle of Wight.

Contents

Background

Before the election a coalition between the 26 Liberal Democrats, 7 Labour and 3 independents ran the council, while the 23 Conservatives were in opposition. [2] There were also one seat vacant after the death of the Labour councillor for Wivenhoe Quay Steve Ford. [3]

Liberal Democrats (UK) Political party in the United Kingdom

The Liberal Democrats are a liberal political party in the United Kingdom. They presently have 11 Members of Parliament in the House of Commons, 96 members of the House of Lords, and one member of the European Parliament. They also have five Members of the Scottish Parliament and a member each in the Welsh Assembly and London Assembly. The party reached the height of its influence in the early 2010s, forming a junior partner in a coalition government from 2010 to 2015. It is presently led by Vince Cable.

The Labour Party is a centre-left political party in the United Kingdom which has been described as an alliance of social democrats, democratic socialists and trade unionists. The party's platform emphasises greater state intervention, social justice and strengthening workers' rights.

Conservative Party (UK) Political party in the United Kingdom

The Conservative Party, officially the Conservative and Unionist Party, is a centre-right political party in the United Kingdom. Presently led by Theresa May, it has been the governing party since 2010. It presently has 314 Members of Parliament in the House of Commons, 249 members of the House of Lords, and 18 members of the European Parliament. It also has 31 Members of the Scottish Parliament, 12 members of the Welsh Assembly, eight members of the London Assembly and 9,008 local councillors. One of the major parties of UK politics, it has formed the government on 45 occasions, more than any other party.

20 seats were being contested, with the candidates including a full slate from the Green party and 13 from the UK Independence Party, more than the party had put forward at any previous local election in Colchester. [2] 6 sitting councillors stood down at the election including the then mayor, Colin Sykes. [4]

Green Party of England and Wales Political party in England and Wales

The Green Party of England and Wales is a green, left-wing political party in England and Wales. Headquartered in London, since September 2018, its co-leaders are Siân Berry and Jonathan Bartley. The Green Party has one representative in the House of Commons, one in the House of Lords, and three in the European Parliament. In addition, it has various councillors in UK local government and two members of the London Assembly.

UK Independence Party British political party

The UK Independence Party is a hard Eurosceptic, right-wing political party in the United Kingdom. It currently has one representative in the House of Lords and seven Members of the European Parliament (MEPs). It has four Assembly Members (AMs) in the National Assembly for Wales and one member in the London Assembly. The party reached its greatest level of success in the mid-2010s, when it gained two Members of Parliament and was the largest UK party in the European Parliament.

In England, the offices of mayor and lord mayor have long been ceremonial posts, with few or no duties attached to them. In recent years they have doubled as more influential political roles while retaining the ceremonial functions. A mayor's term of office denotes the municipal year. The most famous example is that of the Lord Mayor of the City of London.

Election result

Only one seat changed hands at the election, with Labour's Chris Pearson gaining Berechurch from the Liberal Democrats. [5] The Liberal Democrats held the other 9 seats they had been defending, holding Castle by 46 votes over the Conservatives and Old Heath (formerly Harbour ward [6] ) by 69 votes from Labour. [5] The Conservatives gained an increased share of the vote at the election, but did not gain any more seats. [5]

Berechurch village in England

Berechurch is a village in Colchester, Essex, England.

Old Heath

Old Heath is a parish that is south-east of Colchester, Essex, England.

The wards and electoral divisions in the United Kingdom are electoral districts at sub-national level represented by one or more councillors. The ward is the primary unit of English electoral geography for civil parishes and borough and district councils, electoral ward is the unit used by Welsh principal councils, while the electoral division is the unit used by English county councils and some unitary authorities. Each ward/division has an average electorate of about 5,500 people, but ward-population counts can vary substantially. As at the end of 2014 there were 9,456 electoral wards/divisions in the UK.

Meanwhile, the UK Independence Party picked up 16% of the vote, coming second in 9 wards, but failed to take any seats. [7] This was despite the party topping the polls in Colchester with 35% at the European parliamentary election that was held at the same time as the council election, [8] and coming closest to taking a seat in Tiptree where the Conservatives held the seat by 85 votes. [5]

Tiptree village in Essex, England, United Kingdom

Tiptree is a village and civil parish in the English county of Essex, situated 10 miles (16 km) south-west of Colchester and around 50 miles (80 km) north-east of London. Surrounding villages include Messing, Tolleshunt Knights, Tolleshunt Major, Layer Marney, Inworth, Birch, Great Braxted, Great Totham and Little Totham.

Following the election, councillor Laura Sykes left the Liberal Democrats and joined the Highwoods Independent group on the council (renamed to Highwoods & Stanway Independents), after a long-standing dispute with another Liberal Democrat councillor. [9] The coalition between the Liberal Democrats, Labour and independents continued to run the council. [10]

Colchester Borough Council Election, 2014 [11]
PartySeatsGainsLossesNet gain/lossSeats %Votes %Votes+/−
  Liberal Democrat 2501-145.023.08,988-16.9
  Conservative 2300040.033.613,144-4.3
  Labour 910+110.016.26,334+3.2
  Independent 30005.02.91,127-1.0
  UKIP 0000015.86,179N/A
  Green 000008.63,385+3.2

Changes in vote share are compared to the 2010 election as that is the last election to which results can be directly compared. This is due to the nature of Colchester's staggered elections in that the exact set of seats are only up for election once every 4 years.

Ward results

Berechurch [11] [12]
PartyCandidateVotes%±
Labour Chris Pearson85240.0-18.2
UKIP Paul Mulvey47922.5+10.3
Liberal Democrat Susan Hislop41719.6+3.6
Conservative Michael Brown30514.3+3.6
Green Stuart Welham773.6+0.7
Majority37317.5-24.8
Turnout 2,13032+4
Labour gain from Liberal Democrat Swing
Birch & Winstree [11] [12]
PartyCandidateVotes%±
Conservative Kevin Bentley96354.6-14.1
UKIP John Pitts47827.1+27.1
Labour John Spademan1367.7-5.8
Green Maria Iacovou1025.8-0.7
Liberal Democrat Debby Bloomfield864.9-6.3
Majority48527.5-27.6
Turnout 1,76541-6
Conservative hold Swing
Castle [11] [12]
PartyCandidateVotes%±
Liberal Democrat Bill Frame69325.8-14.6
Conservative Darius Laws64724.1+6.2
Labour Ben Howard47817.8+4.4
Green Peter Lynn46217.2-1.4
UKIP Ron Levy40315.0+5.3
Majority461.7-20.2
Turnout 2,68338+8
Liberal Democrat hold Swing
Christ Church [11] [12]
PartyCandidateVotes%±
Liberal Democrat Nick Cope46732.5-10.5
Conservative Annesley Hardy41328.7-4.4
Labour Elisa Vasquez-Walters23916.6+5.2
Green Clare Palmer21214.8+2.4
UKIP Alexei Kunpffer1067.4+7.4
Majority543.8-6.1
Turnout 1,43744-9
Liberal Democrat hold Swing
Fordham & Stour [11] [12]
PartyCandidateVotes%±
Conservative Christopher Arnold1,04665.5-1.8
Green Sue Bailey21913.7+6.0
Labour Ian Yates20112.6-2.9
Liberal Democrat Barry Woodward1328.3-1.3
Majority82751.8-0.1
Turnout 1,59838-7
Conservative hold Swing
Highwoods [11] [12]
PartyCandidateVotes%±
Independent Gerard Oxford1,11752.1-15.7
UKIP Tony Terry28613.3+8.8
Conservative Christopher Hayter26612.4+3.0
Labour Bob Fisher2089.7+1.6
Liberal Democrat Ann Oakes-Odger1768.2+2.0
Green Robbie Spence914.2+0.2
Majority83138.8-19.7
Turnout 2,14433+7
Independent hold Swing

Lexden

Lexden [11] [12]
PartyCandidateVotes%±
Conservative Roger Buston98555.5+1.3
Liberal Democrat Robin James37020.8-5.2
Green Steve Ford23013.0+4.5
Labour John Wood19010.7-0.6
Majority61534.6+6.4
Turnout 1,77541+5
Conservative hold Swing
Mile End [11] [12]
PartyCandidateVotes%±
Liberal Democrat Dominic Graham1,12440.7-23.7
Conservative Ben Locker85731.0+7.5
UKIP Simon Collins41014.8+14.8
Labour Kevin Stannard2107.6-0.5
Green Mary Bryan1605.8+1.8
Majority2679.7-31.2
Turnout 2,76136+5
Liberal Democrat hold Swing
New Town [11] [12]
PartyCandidateVotes%±
Liberal Democrat Theresa Higgins76641.6-11.2
UKIP Tony Hardy33418.1+9.9
Labour Lillie Dopson27314.8-3.9
Green Mark Goacher24713.4+2.0
Conservative Matthew Neall22212.1+3.1
Majority43223.5-10.6
Turnout 1,84229+6
Liberal Democrat hold Swing
Old Heath [11] [12]
PartyCandidateVotes%±
Liberal Democrat Justin Knight46331.5-23.2
Labour Lee Scordis39426.8+2.2
UKIP Stephen Galvin33422.7+15.2
Conservative Samuel Nolan17712.0+5.1
Green Bob Brannan1047.1+0.8
Majority694.7-25.4
Turnout 1,47234+6
Liberal Democrat hold Swing
Prettygate [11] [12]
PartyCandidateVotes%±
Conservative Sue Lissimore1,48957.9+10.7
Liberal Democrat John Loxley54521.2-8.7
Labour Mike Dale30411.8-3.1
Green Luke O'Loughlin2339.1+1.1
Majority94436.7+19.5
Turnout 2,57144+7
Conservative hold Swing
Pyefleet [11] [12]
PartyCandidateVotes%±
Conservative Robert Davidson58764.2+20.4
Green Tim Glover13114.3+10.0
Labour Alison Inman12413.6+4.4
Liberal Democrat Owen Bartholomew738.0-34.7
Majority45649.8+48.7
Turnout 91545-30
Conservative hold Swing
St. Andrew's [11] [12]
PartyCandidateVotes%±
Labour Julie Young92561.6+0.3
Conservative Christopher Hill23715.8+8.7
Liberal Democrat Wayne Boughton17911.9+0.3
Green Leonie Greene16010.7+10.7
Majority68845.8-2.7
Turnout 1,50127+2
Labour hold Swing
St. Anne's [11] [12]
PartyCandidateVotes%±
Liberal Democrat Mike Hogg78339.7-15.5
UKIP William Faram50025.4+25.4
Conservative Alexandra Hutchinson29915.2-0.5
Labour Amanda Stannard26513.4-7.0
Green Callum Fauser1256.3-2.4
Majority28314.4-20.4
Turnout 1,97231+8
Liberal Democrat hold Swing
St. John's [11] [12]
PartyCandidateVotes%±
Liberal Democrat Ray Gamble84148.6-15.8
UKIP Edwin Gretton35520.5+20.5
Conservative Charles McKay35220.4-1.2
Labour Jennie Fisher1066.1-2.7
Green David Trayner754.3-0.9
Majority48628.1-14.7
Turnout 1,72943+5
Liberal Democrat hold Swing
Shrub End [11] [12]
PartyCandidateVotes%±
Liberal Democrat Lyn Barton77833.4-10.4
UKIP Sarah Hardy51021.9+21.9
Conservative Mike Hardy48020.6-9.7
Labour Bruce Tuxford45819.7+0.0
Green Walter Schwarz924.0-2.2
Independent Christina Perdicou100.4+0.4
Majority26811.5-2.1
Turnout 2,32832+7
Liberal Democrat hold Swing
Stanway [11] [12]
PartyCandidateVotes%±
Liberal Democrat Jessica Scott-Boutell78633.7-21.3
Conservative Janice Perren70430.2+5.0
UKIP Christopher Treloar48620.8+20.8
Labour David Hough23710.2-4.2
Green Pam Nelson1205.1-0.3
Majority823.5-26.3
Turnout 2,33336+3
Liberal Democrat hold Swing
Tiptree [11] [12]
PartyCandidateVotes%±
Conservative John Elliott94041.3-6.8
UKIP Harry Royle85537.5+37.5
Labour Robert Spademan28312.4-23.7
Green Kathy Bamforth1205.3-4.4
Liberal Democrat Gill Collings793.5-2.5
Majority853.7-8.3
Turnout 2,27739+12
Conservative hold Swing
West Bergholt & Eight Ash Green [11] [12]
PartyCandidateVotes%±
Conservative Dennis Willetts98461.8+7.0
Green Roger Bamforth27417.2+11.7
Labour Barbara Nichols20112.6+3.0
Liberal Democrat Sue Waite1348.4+2.0
Majority71044.6+13.5
Turnout 1,59343-7
Conservative hold Swing
West Mersea [11] [12]
PartyCandidateVotes%±
Conservative John Jowers1,19151.1-18.0
UKIP David Broise64327.6+27.6
Labour Bernard Ready25010.7-4.7
Green Steve McGough1516.5-1.5
Liberal Democrat Jenny Stevens964.1-3.4
Majority54823.5-30.2
Turnout 2,33140+11
Conservative hold Swing

Related Research Articles

Colchester Politics: Colchester is a historic town located in Essex, England. It served as the first capital of Roman Britain and makes a claim to be the oldest town in Britain.

2006 Colchester Borough Council election

The 2006 Colchester Borough Council election took place on 4 May 2006 to elect members of Colchester Borough Council in Essex, England. One third of the council was up for election and the council stayed under no overall control.

The 2011 council elections in Guildford saw the Conservatives retain control over Guildford Borough Council with an increased majority of 20 seats. Full results for each ward can be found at Guildford Council election, full results, 2011.

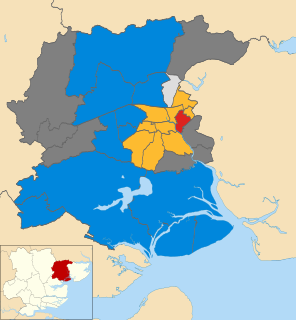
The 2012 Colchester Borough Council election took place on 3 May 2012 to elect members of Colchester Borough Council in Essex, England. One third of the council was up for election and the council stayed under no overall control.

2012 Watford Borough Council election

Elections to Watford Borough Council were held on 3 May 2012. Three years in every four, a third of the council retires and elections are held.

The 2002 Colchester Borough Council election took place on 2 May 2002 to elect members of Colchester Borough Council in Essex, England. This was the same day as the other 2002 local elections in the United Kingdom. Due to boundary changes, every seat was up for election and the council stayed under no overall control.

2003 Colchester Borough Council election

The 2003 Colchester Borough Council election took place on 1 May 2003 to elect members of Colchester Borough Council in Essex, England. This was the same day as the other 2003 United Kingdom local elections. One third of the seats were up for election and the council stayed under no overall control.

2004 Colchester Borough Council election

The 2004 Colchester Borough Council election took place on 10 June 2004 to elect members of Colchester Borough Council in Essex, England. This was the same day as the other 2004 United Kingdom local elections and as the 2004 European Parliament Elections. One third of the seats were up for election and the council stayed under no overall control.

2014 Calderdale Metropolitan Borough Council election

The 2014 Calderdale Metropolitan Borough Council election took place on 22 May 2014 to elect members of Calderdale Metropolitan Borough Council in England. This was on the same day as local elections across the United Kingdom and a European election. One councillor was elected in each of the 17 wards for a four-year term. There are three councillors representing each ward elected on a staggered basis so one third of the councillor seats were up for re-election. The seats had previously been contested in 2010 which was held in conjunction with a general election. The turnout was significantly lower in 2014 than in 2010 which is not unusual when comparing local elections that coincide with general elections to ones that do not. Prior to the election Labour was the largest party in the council with 21 out of 51 seats, 5 seats short of an overall majority. After the election there was no overall control of the council. Labour had 25 seats, only one short of a majority and so Labour continued to operate a minority administration.

The 2000 Colchester Borough Council election took place on 4 May 2000 to elect members of Colchester Borough Council in Essex, England. One third of the council was up for election and the council stayed under no overall control.

2007 Colchester Borough Council election

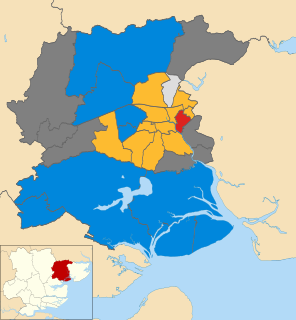
The 2007 Colchester Borough Council election took place on 3 May 2007 to elect members of Colchester Borough Council in Essex, England. One third of the council was up for election and the council stayed under no overall control.

2008 Colchester Borough Council election

The 2008 Colchester Borough Council election took place on 1 May 2008 to elect members of Colchester Borough Council in Essex, England. One third of the council was up for election and the Conservative party lost overall control of the council to no overall control.

2010 Colchester Borough Council election

The 2010 Colchester Borough Council election took place on 6 May 2010 to elect members of Colchester Borough Council in Essex, England. One third of the council was up for election and the council stayed under no overall control.

2011 Colchester Borough Council election

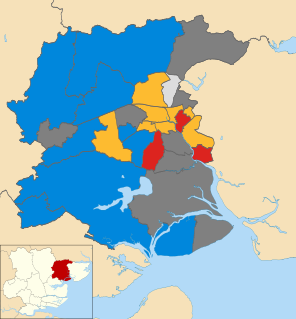
The 2011 Colchester Borough Council election took place on 5 May 2011 to elect members of Colchester Borough Council in Essex, England. One third of the council was up for election and the council stayed under no overall control.

2014 Havant Borough Council election

The 2014 Havant Borough Council election took place on 22 May 2014 to elect members of Havant Borough Council in Hampshire, England. One third of the council was up for election and the Conservative party stayed in overall control of the council.

2014 Harlow District Council election

The 2014 Harlow District Council election took place on 22 May 2014 to elect members of Harlow District Council in Essex, England. One third of the council was up for election and the Labour party stayed in overall control of the council.

2014 St Helens Metropolitan Borough Council election

The 2014 St Helens Metropolitan Borough Council election took place on 22 May 2014 to elect members of St Helens Metropolitan Borough Council in Merseyside, England. One third of the council was up for election and the Labour party stayed in overall control of the council.

The 2015 Colchester Borough Council election took place on 7 May 2015 to elect one third of the members of Colchester Borough Council in England. This was the same day as other local elections and as the General Election. Colchester Borough Council is made up of 60 councillors: 20 councillors were up for election.

Elections to Colchester Borough Council took place on 5 May 2016. Colchester Borough Council normally elects one third of its councillors each year, however, due to boundary changes, the whole council is up for election.

2018 City of Bradford Metropolitan District Council election

The 2018 City of Bradford Metropolitan District Council took place on 3 May 2018 to elect members of Bradford District Council in England. This was on the same day as other local elections. One councillor was elected in each ward for a four-year term so the councillors elected in 2018 last stood for election in 2014. Each ward is represented by three councillors, the election of which is staggered, so only one third of the councillors were elected in this election. Before the election there was a Labour majority and afterwards Labour had increased their majority.

References

  1. "Colchester". BBC News Online . Retrieved 2 June 2014.
  2. 1 2 "Colchester gets ready to go to the polls - see our local election preview". The Gazette. NewsBank. 20 May 2014.
  3. Bunn, Matt (6 April 2014). "Wivenhoe/Colchester: Tributes paid to former Wvenhoe mayor and borough councillor Steve Ford". East Anglian Daily Times . Retrieved 3 June 2014.
  4. Lodge, Will (24 April 2014). "Colchester: Greens to challenge every seat at council elections". East Anglian Daily Times . Retrieved 3 June 2014.
  5. 1 2 3 4 "Colchester Council: Big three breathe sigh of relief after halting rise of Ukip". The Gazette. NewsBank. 23 May 2014. Retrieved 3 June 2014.
  6. "Councillors agree to ward change in spite of low response to survey". Essex County Standard . 18 October 2012. Retrieved 3 June 2014.
  7. Lodge, Will (23 May 2014). "Colchester: UKIP fails to take any seats at borough council elections". East Anglian Daily Times . Retrieved 3 June 2014.
  8. Calnan, James (27 May 2014). "Colchester Lib Dem councillor defects". Daily Gazette. Retrieved 4 June 2014.
  9. Lodge, Will (4 July 2014). "Essex: No change in councils' make-up after by-elections". East Anglian Daily Times . Retrieved 4 July 2014.
  10. 1 2 3 4 5 6 7 8 9 10 11 12 13 14 15 16 17 18 19 20 21 "Results - Borough Election - 22 May 2014". Colchester Borough Council. Retrieved 2 June 2014.
  11. 1 2 3 4 5 6 7 8 9 10 11 12 13 14 15 16 17 18 19 20 Lodge, Will (23 May 2014). "Colchester: Ward-by-ward results for the 2014 Colchester Borough Council election". East Anglian Daily Times . Retrieved 3 June 2014.