Colchester Borough Council election, 2007

Last updated
Map of the results of the 2007 Colchester council election. Conservatives in blue, Liberal Democrats in yellow, Labour in red and independents in light grey. Wards in dark grey were not contested in 2007. Colchester UK local election 2007 map.svg
Map of the results of the 2007 Colchester council election. Conservatives in blue, Liberal Democrats in yellow, Labour in red and independents in light grey. Wards in dark grey were not contested in 2007.

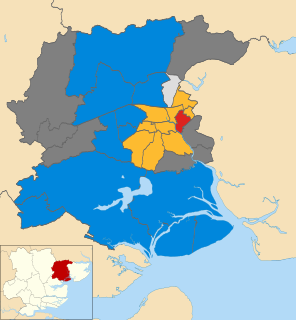
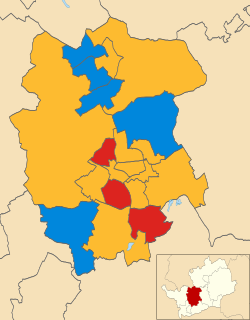
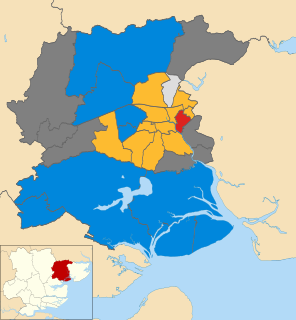
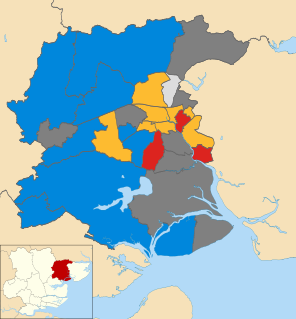
The 2007 Colchester Borough Council election took place on 3 May 2007 to elect members of Colchester Borough Council in Essex, England. One third of the council was up for election and the council stayed under no overall control. [1]

Borough status in the United Kingdom is granted by royal charter to local government districts in England, Wales and Northern Ireland. The status is purely honorary, and does not give any additional powers to the council or inhabitants of the district. In Scotland, similarly chartered communities were known as royal burghs, although the status is no longer granted.

Essex County of England

Essex is a county in the south-east of England, north-east of London. One of the home counties, it borders Suffolk and Cambridgeshire to the north, Hertfordshire to the west, Kent across the estuary of the River Thames to the south, and London to the south-west. The county town is Chelmsford, the only city in the county. For government statistical purposes Essex is placed in the East of England region.

England Country in north-west Europe, part of the United Kingdom

England is a country that is part of the United Kingdom. It shares land borders with Wales to the west and Scotland to the north-northwest. The Irish Sea lies west of England and the Celtic Sea lies to the southwest. England is separated from continental Europe by the North Sea to the east and the English Channel to the south. The country covers five-eighths of the island of Great Britain, which lies in the North Atlantic, and includes over 100 smaller islands, such as the Isles of Scilly and the Isle of Wight.

Contents

After the election, the composition of the council was

Conservative Party (UK) Political party in the United Kingdom

The Conservative Party, officially the Conservative and Unionist Party, is a centre-right political party in the United Kingdom. Presently led by Theresa May, it has been the governing party since 2010. It presently has 314 Members of Parliament in the House of Commons, 249 members of the House of Lords, and 18 members of the European Parliament. It also has 31 Members of the Scottish Parliament, 12 members of the Welsh Assembly, eight members of the London Assembly and 9,008 local councillors. One of the major parties of UK politics, it has formed the government on 45 occasions, more than any other party.

Liberal Democrats (UK) Political party in the United Kingdom

The Liberal Democrats are a liberal political party in the United Kingdom. They presently have 11 Members of Parliament in the House of Commons, 96 members of the House of Lords, and one member of the European Parliament. They also have five Members of the Scottish Parliament and a member each in the Welsh Assembly and London Assembly. The party reached the height of its influence in the early 2010s, forming a junior partner in a coalition government from 2010 to 2015. It is presently led by Vince Cable.

The Labour Party is a centre-left political party in the United Kingdom which has been described as an alliance of social democrats, democratic socialists and trade unionists. The party's platform emphasises greater state intervention, social justice and strengthening workers' rights.

Campaign

Before the election the Conservatives had 30 of the 60 seats on the council, while the Liberal Democrats had 21, Labour had 7 and there were 2 independents. [3]

With the Conservative party needing to gain one seat to gain a majority on the council for the first time since 1986, [4] Colchester attracted national attention with the Shadow Foreign Secretary, William Hague, coming to the marginal Shrub End ward to campaign for the Conservatives. [5] Meanwhile, one of the Green party's Principal Speakers Sian Berry came to Colchester and campaigned on the importance of public transport, with the Greens contesting every seat at the election. [5]

William Hague British politician

William Jefferson Hague, Baron Hague of Richmond, is a British Conservative politician and life peer. He represented Richmond, Yorkshire, as its Member of Parliament (MP) from 1989 to 2015 and was the Leader of the Opposition from 1997 to 2001. He was Secretary of State for Foreign and Commonwealth Affairs from 2010 to 2014 and was the Leader of the House of Commons from 2014 to 2015.

The wards and electoral divisions in the United Kingdom are electoral districts at sub-national level represented by one or more councillors. The ward is the primary unit of English electoral geography for civil parishes and borough and district councils, electoral ward is the unit used by Welsh principal councils, while the electoral division is the unit used by English county councils and some unitary authorities. Each ward/division has an average electorate of about 5,500 people, but ward-population counts can vary substantially. As at the end of 2014 there were 9,456 electoral wards/divisions in the UK.

Green Party of England and Wales Political party in England and Wales

The Green Party of England and Wales is a green, left-wing political party in England and Wales. Headquartered in London, since September 2018, its co-leaders are Siân Berry and Jonathan Bartley. The Green Party has one representative in the House of Commons, one in the House of Lords, and three in the European Parliament. In addition, it has various councillors in UK local government and two members of the London Assembly.

Election result

The Conservatives narrowly failed to gain a majority on the council after failing to take Wivenhoe Quay from Labour by two votes after two recounts. [4] This meant the Conservatives remained on 30 councillors, while the Liberal Democrats stayed on 21 seats. [4] Labour's loss of Shrub End to the Conservatives meant they dropped to 6 councillors, while the Greens failed to win any seats despite getting 32% of the vote in Castle ward. [4] [6] Overall turnout at the election was 34.7%. [7]

Wivenhoe town in north eastern Essex, England, United Kingdom

Wivenhoe is a town and civil parish in north eastern Essex, England, approximately 3 miles (4.8 km) south east of Colchester. Historically Wivenhoe village, on the banks of the River Colne, and Wivenhoe Cross, on the higher ground to the north, were two separate settlements but with considerable development in the 19th century the two have merged.

A Councillor is a member of a local government council.

Voter turnout percentage of eligible voters who cast a ballot in an election

Voter turnout is the percentage of eligible voters who cast a ballot in an election. Eligibility varies by country, and the voting-eligible population should not be confused with the total adult population. Age and citizenship status are often among the criteria used to determine eligibility, but some countries further restrict eligibility based on sex, race, or religion.

Colchester Borough Council Election, 2007 [1] [7]
PartySeatsGainsLossesNet gain/lossSeats %Votes %Votes+/−
  Conservative 922045.041.814,342+2.9%
  Liberal Democrat 711035.029.310,052-4.5%
  Labour 301-115.016.35,581+3.0%
  Independent 110+15.03.11,052-2.4%
  Green 000009.53,267+1.0%

Ward results

Berechurch [7]
PartyCandidateVotes%±
Labour Dave Harris93149.7+17.4
Liberal Democrat Keith Hindle48325.8-16.4
Conservative Claire Bright35218.8+0.7
Green Philippa Lane1095.8-1.6
Majority44823.9
Turnout 1,87532.7-1.3
Labour hold Swing
Birch & Winstree [7]
PartyCandidateVotes%±
Conservative Peter Crowe1,16470.1+3.5
Liberal Democrat Jonathan Longman31318.9+1.2
Labour James Spencer1006.0-1.0
Green Tobie Glenny835.0-0.9
Majority85151.3+2.4
Turnout 1,66037.5-4.6
Conservative hold Swing
Castle [7]
PartyCandidateVotes%±
Liberal Democrat Nick Barlow94041.0-7.7
Green Peter Lynn74032.3+9.7
Conservative Glenn Granger46920.5+2.4
Labour Michael Powell1426.2-1.9
Majority2008.7-17.3
Turnout 2,29137.4-4.1
Liberal Democrat hold Swing
Christ Church [7]
PartyCandidateVotes%±
Liberal Democrat Martin Hunt58842.4-1.3
Conservative Andrew Bright47434.2+0.9
Green Alexander Cave24517.7+0.3
Labour David Canning795.7+0.1
Majority1148.2-2.2
Turnout 1,38646.0-2.3
Liberal Democrat hold Swing
Copford & West Stanway [7]
PartyCandidateVotes%±
Conservative Jackie Maclean39469.1-1.4
Liberal Democrat Sue Waite8214.4+7.0
Labour Ian Spademan488.4+0.4
Green Sophie Lovejoy468.1+8.1
Majority31254.7-1.8
Turnout 57038.4+4.4
Conservative hold Swing
Fordham & Stour [7]
PartyCandidateVotes%±
Conservative Nigel Chapman91367.2+0.6
Liberal Democrat David Shakespeare18013.2+0.8
Green Mervyn Carter14610.7+2.6
Labour Jo Aldous1208.8+0.4
Majority73353.9-0.3
Turnout 1,35934.3-2.4
Conservative hold Swing
Great Tey [7]
PartyCandidateVotes%±
Conservative Peter Chillingworth67071.9+3.3
Liberal Democrat Carolyn Catney10511.3-9.6
Labour John Wood909.7-1.8
Green Paul Goldsmith677.2-7.2
Majority56560.6+12.8
Turnout 93241.9-0.8
Conservative hold Swing
Highwoods [7]
PartyCandidateVotes%±
Independent Philip Oxford1,05252.6-5.6
Conservative Simon Lucas42721.4+6.5
Liberal Democrat John Baker30615.3+0.1
Labour Janet Smith1276.4-1.1
Green Gary Kittle884.4+0.1
Majority62531.3-11.7
Turnout 2,00030.9-1.7
Independent gain from Conservative Swing
Mile End [7]
PartyCandidateVotes%±
Liberal Democrat Anne Turrell1,08147.1+8.2
Conservative Marianne Anderson99543.4-2.8
Labour Steve Crawshaw1185.1-1.1
Green Mary Bryan994.3-2.1
Majority863.8
Turnout 2,29339.5+1.0
Liberal Democrat hold Swing
New Town [7]
PartyCandidateVotes%±
Liberal Democrat Margaret Fisher87255.6-9.8
Conservative George Askew27117.3+17.3
Green Linda Wonnacott25216.1-5.4
Labour Luke Dopson17311.0-2.1
Majority60138.3-5.5
Turnout 1,56827.0-1.8
Liberal Democrat hold Swing
Prettygate [7]
PartyCandidateVotes%±
Conservative Wyn Foster1,40454.2+0.6
Liberal Democrat Paul Ost87533.8-0.9
Labour Michael Dale1827.0-0.3
Green Peter Appleton1295.0+0.5
Majority52920.4+1.5
Turnout 2,59043.7+0.0
Conservative gain from Liberal Democrat Swing
St. Andrew's [7]
PartyCandidateVotes%±
Labour Tim Young 96961.6-8.2
Liberal Democrat Rebecca Price29919.0-10.2
Conservative Alex Wilson23715.1+2.7
Green Andrew Senter684.3-0.7
Majority67042.6+18.4
Turnout 1,57324.8-3.4
Labour hold Swing
St. Anne's [7]
PartyCandidateVotes%±
Liberal Democrat Barrie Cook1,00049.3-2.5
Labour Kim Naish54827.0+0.6
Conservative Anne Allan36818.2+4.5
Green Annick Collins-Leyssen1115.5-2.5
Majority45222.3-3.1
Turnout 2,02732.2-0.5
Liberal Democrat hold Swing
Shrub End [7]
PartyCandidateVotes%±
Conservative Pauline Hazell71838.5+4.8
Liberal Democrat Nigel Offen64334.5-7.5
Labour Richard Bourne40421.7+2.1
Green Walter Schwarz1005.4+0.6
Majority754.0
Turnout 1,86531.2-1.6
Conservative gain from Labour Swing
Stanway [7]
PartyCandidateVotes%±
Liberal Democrat Lesley Scott-Boutell1,21452.2+10.2
Conservative Beverly Davies89738.6-5.4
Labour John Spademan1416.1-2.4
Green Pam Nelson743.2-2.3
Majority31713.6
Turnout 2,32637.7-0.5
Liberal Democrat hold Swing
Tiptree [7]
PartyCandidateVotes%±
Conservative Margaret Crowe1,18565.4+11.0
Labour Audrey Spencer33018.2+3.6
Liberal Democrat Michael Turrell1518.3-1.4
Green Katherine Bamforth1468.1+2.0
Majority85547.2+7.9
Turnout 1,81230.2-0.2
Conservative hold Swing
West Bergholt & Eight Ash Green [7]
PartyCandidateVotes%±
Conservative Jill Tod87762.9-0.7
Liberal Democrat Barry Woodward17712.7-4.8
Labour Abigail Tootal17312.4+4.5
Green Roger Bamforth16712.0+1.1
Majority70050.2+4.1
Turnout 1,39436.4-1.8
Conservative hold Swing
West Mersea [7]
PartyCandidateVotes%±
Conservative Margaret Kimberley1,51074.1+3.6
Liberal Democrat Christopher Butler2019.9+9.9
Labour Barbara Nichols1788.7-1.4
Green Beverley Maltby1487.3-3.2
Majority1,30964.3+4.2
Turnout 2,03735.0+0.2
Conservative hold Swing
Wivenhoe Cross [7]
PartyCandidateVotes%±
Liberal Democrat Mark Cory39542.5+3.2
Conservative David Adams37139.9-6.5
Green Maria Iacovou838.9+8.9
Labour Rossanna Trudgian808.6-5.7
Majority242.6-4.5
Turnout 92927.3+0.1
Liberal Democrat gain from Conservative Swing
Wivenhoe Quay [7]
PartyCandidateVotes%±
Labour Stephen Ford64835.9+17.2
Conservative Penny Kraft64635.7-0.9
Green Chris Fox36620.3+20.3
Liberal Democrat Sharon Humphrey1478.1-8.9
Majority20.1
Turnout 1,80744.4+0.7
Labour hold Swing

Related Research Articles

The 1999 St Helens Metropolitan Borough Council election took place on 6 May 1999 to elect members of St Helens Metropolitan Borough Council in Merseyside, England. One third of the council was up for election and the Labour party stayed in overall control of the council.

2003 St Helens Metropolitan Borough Council election

The 2003 St Helens Metropolitan Borough Council election took place on 1 May 2003 to elect members of St Helens Metropolitan Borough Council in Merseyside, England. One third of the council was up for election and the Labour party stayed in overall control of the council.

2006 St Helens Metropolitan Borough Council election

The 2006 St Helens Metropolitan Borough Council election took place on 4 May 2006 to elect members of St Helens Metropolitan Borough Council in Merseyside, England. One third of the council was up for election and the council stayed under no overall control.

2006 Colchester Borough Council election

The 2006 Colchester Borough Council election took place on 4 May 2006 to elect members of Colchester Borough Council in Essex, England. One third of the council was up for election and the council stayed under no overall control.

2003 Harlow District Council election

The 2003 Harlow District Council election took place on 1 May 2003 to elect members of Harlow District Council in Essex, England. One third of the council was up for election and the council stayed under no overall control.

2007 St Helens Metropolitan Borough Council election

The 2007 St Helens Metropolitan Borough Council election took place on 3 May 2007 to elect members of St Helens Metropolitan Borough Council in Merseyside, England. One third of the council was up for election and the council stayed under no overall control.

2003 St Albans City and District Council election

The 2003 St Albans City and District Council election took place on 1 May 2003 to elect members of St Albans District Council in Hertfordshire, England. One third of the council was up for election and the council stayed under no overall control.

2007 St Albans City and District Council election

The 2007 St Albans City and District Council election took place on 3 May 2007 to elect members of St Albans District Council in Hertfordshire, England. One third of the council was up for election and the Liberal Democrats lost overall control of the council to no overall control.

2007 Pendle Borough Council election

The 2007 Pendle Borough Council election took place on 3 May 2007 to elect members of Pendle Borough Council in Lancashire, England. One third of the council was up for election and the Liberal Democrats stayed in overall control of the council.

The 2002 Colchester Borough Council election took place on 2 May 2002 to elect members of Colchester Borough Council in Essex, England. This was the same day as the other 2002 local elections in the United Kingdom. Due to boundary changes, every seat was up for election and the council stayed under no overall control.

2003 Colchester Borough Council election

The 2003 Colchester Borough Council election took place on 1 May 2003 to elect members of Colchester Borough Council in Essex, England. This was the same day as the other 2003 United Kingdom local elections. One third of the seats were up for election and the council stayed under no overall control.

2004 Colchester Borough Council election

The 2004 Colchester Borough Council election took place on 10 June 2004 to elect members of Colchester Borough Council in Essex, England. This was the same day as the other 2004 United Kingdom local elections and as the 2004 European Parliament Elections. One third of the seats were up for election and the council stayed under no overall control.

The 2000 Colchester Borough Council election took place on 4 May 2000 to elect members of Colchester Borough Council in Essex, England. One third of the council was up for election and the council stayed under no overall control.

2008 Colchester Borough Council election

The 2008 Colchester Borough Council election took place on 1 May 2008 to elect members of Colchester Borough Council in Essex, England. One third of the council was up for election and the Conservative party lost overall control of the council to no overall control.

2010 Colchester Borough Council election

The 2010 Colchester Borough Council election took place on 6 May 2010 to elect members of Colchester Borough Council in Essex, England. One third of the council was up for election and the council stayed under no overall control.

2011 Colchester Borough Council election

The 2011 Colchester Borough Council election took place on 5 May 2011 to elect members of Colchester Borough Council in Essex, England. One third of the council was up for election and the council stayed under no overall control.

The 2014 Colchester Borough Council election took place on 22 May 2014 to elect members of Colchester Borough Council in Essex, England. One third of the council was up for election and the council stayed under no overall control.

The 1999 Castle Point Borough Council election took place on 6 May 1999 to elect members of Castle Point Borough Council in Essex, England. The whole council was up for election and the Labour party stayed in overall control of the council.

2006 Brent London Borough Council election

The 2006 Brent London Borough Council election took place on 4 May 2006 to elect members of Brent London Borough Council in London, England. The whole council was up for election and the Labour party lost overall control of the council to no overall control.

2007 West Oxfordshire District Council election

The 2007 West Oxfordshire District Council election took place on 3 May 2007 to elect members of West Oxfordshire District Council in Oxfordshire, England. One third of the council was up for election and the Conservative party stayed in overall control of the council.

References

  1. 1 2 "Colchester". BBC News Online. 4 May 2007. Retrieved 29 May 2014.
  2. "Results - Election 2007". The Times . NewsBank. 5 May 2007. p. 83.
  3. "Colchester : It's D-day at polls". Essex County Publications. NewsBank. 3 May 2007.
  4. 1 2 3 4 "Colchester : Just two votes stop a Tory takeover". Essex County Publications. NewsBank. 4 May 2007.
  5. 1 2 "Colchester : William stops off on whistle-stop tour". Essex County Publications. NewsBank. 20 April 2007.
  6. "Is town ripe for the taking by Greens?". Essex County Publications. NewsBank. 21 May 2007.
  7. 1 2 3 4 5 6 7 8 9 10 11 12 13 14 15 16 17 18 19 20 21 22 "Election of Borough Councillors for the Wards of Colchester Borough Council: Summary of Results". Colchester Borough Council. Retrieved 29 May 2014.