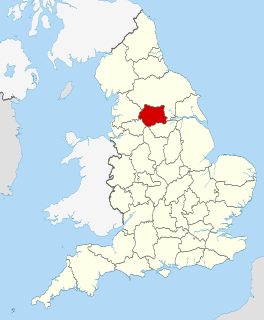
The 2007 Wakefield Metropolitan District Council election took place on 3 May 2007 to elect members of Wakefield Metropolitan District Council in West Yorkshire, England. One third of the council was up for election and the Labour party kept overall control of the council. [1]
West Yorkshire is a metropolitan county in England. It is an inland and in relative terms upland county having eastward-draining valleys while taking in moors of the Pennines and has a population of 2.2 million. West Yorkshire came into existence as a metropolitan county in 1974 after the passage of the Local Government Act 1972.
England is a country that is part of the United Kingdom. It shares land borders with Wales to the west and Scotland to the north-northwest. The Irish Sea lies west of England and the Celtic Sea lies to the southwest. England is separated from continental Europe by the North Sea to the east and the English Channel to the south. The country covers five-eighths of the island of Great Britain, which lies in the North Atlantic, and includes over 100 smaller islands, such as the Isles of Scilly and the Isle of Wight.
The Labour Party is a centre-left political party in the United Kingdom which has been described as an alliance of social democrats, democratic socialists and trade unionists. The party's platform emphasises greater state intervention, social justice and strengthening workers' rights.
After the election, the composition of the council was
The Conservative Party, officially the Conservative and Unionist Party, is a centre-right political party in the United Kingdom. The governing party since 2010, it is the largest in the House of Commons, with 313 Members of Parliament, and also has 249 members of the House of Lords, 18 members of the European Parliament, 31 Members of the Scottish Parliament, 12 members of the Welsh Assembly, eight members of the London Assembly and 8,916 local councillors.
The Liberal Democrats are a liberal political party in the United Kingdom. They have 11 Members of Parliament in the House of Commons, 96 members of the House of Lords, one member of the European Parliament, five Members of the Scottish Parliament and one member in the Welsh Assembly and London Assembly. At the height of its influence, the party formed a coalition government with the Conservative Party from 2010 to 2015 with its leader Nick Clegg serving as Deputy Prime Minister. It is currently led by Sir Vince Cable.
21 seats were contested in the election with both Labour and Conservatives standing in all of the seats. [3] Other parties that put up candidates were the Liberal Democrats, British National Party, Green Party, United Kingdom Independence Party, Socialist Alternative party, British Voice party and some independents. [3]
The British National Party (BNP) is a far-right, fascist political party in the United Kingdom. It is headquartered in Wigton, Cumbria, and its current leader is Adam Walker. A minor party, it has no elected representatives at any level of UK government. Founded in 1982, the party reached its greatest level of success in the 2000s, when it had over fifty seats in local government, one seat on the London Assembly, and two Members of the European Parliament.
The Green Party of England and Wales is a green, left-wing political party in England and Wales. Headquartered in London, since September 2018, its co-leaders are Siân Berry and Jonathan Bartley. The Green Party has one representative in the House of Commons, one in the House of Lords, and three in the European Parliament. In addition, it has various councillors in UK local government and two members of the London Assembly.
The Socialist Party is a Trotskyist political party in England and Wales which adopted its current name in 1997 after being formerly known as Militant, an entryist group in the Labour Party from 1964 until it abandoned that tactic in 1991. The party stands under the electoral banner of the Trade Unionist and Socialist Coalition (TUSC) or under the name Socialist Alternative.
The results saw Labour lose 2 seats to the Conservatives in Horbury and South Ossett and Wrenthorpe and Outwood West wards. [4] One of the two losses was the deputy leader of the council, Phil Dobson, who was defeated in Wrenthorpe and Outwood West by 173 votes. [4] However Labour gained a seat in Normanton from independent, Graeme Milner, and remained in control of the council. [4] Overall turnout was 31.62%. [5]
Horbury is a town in the City of Wakefield, a metropolitan district of West Yorkshire, England and part of the West Yorkshire Urban Area. Historically in the West Riding of Yorkshire, it is situated north of the River Calder about three miles (5 km) south west of Wakefield and two miles (3 km) to the south of Ossett. It includes the outlying areas of Horbury Bridge and Horbury Junction. At the 2001 census the Horbury and South Ossett ward of Wakefield Metropolitan District Council had a population of 10,002. At the 2011 census the population was 15,032. Old industries include woollens, engineering and building wagons for the railways but the area is now largely residential and retail.
Ossett is a market town in within the metropolitan district of the City of Wakefield, West Yorkshire, England. Historically part of the West Riding of Yorkshire, it is halfway between Dewsbury, to the west, and Wakefield, to the east. At the 2011 Census, the population was 21,231.
Wrenthorpe is a village north-west of Wakefield, in West Yorkshire, England. It is located in the Rhubarb Triangle.
Following the election, Denise Jeffrey, was appointed the new deputy leader in a reshuffle of the cabinet. [6]
A Cabinet is a body of high-ranking state officials, typically consisting of the top leaders of the executive branch. Members of a cabinet are usually called Cabinet ministers or secretaries. The function of a Cabinet varies: in some countries it is a collegiate decision-making body with collective responsibility, while in others it may function either as a purely advisory body or an assisting institution to a decision making head of state or head of government. Cabinets are typically the body responsible for the day-to-day management of the government and response to sudden events, whereas the legislative and judicial branches work in a measured pace, in sessions according to lengthy procedures.
Party | Seats | Gains | Losses | Net gain/loss | Seats % | Votes % | Votes | +/− | |
---|---|---|---|---|---|---|---|---|---|
Labour | 12 | 1 | 2 | -1 | 57.1 | 39.0 | 30,623 | -2.7% | |
Conservative | 6 | 2 | 0 | +2 | 28.6 | 30.0 | 23,494 | +0.9% | |
Independent | 2 | 0 | 1 | -1 | 9.5 | 10.2 | 8,035 | +2.6% | |
Liberal Democrat | 1 | 0 | 0 | 0 | 4.8 | 10.1 | 7,956 | +0.7% | |
BNP | 0 | 0 | 0 | 0 | 0 | 8.3 | 6,498 | -2.4% | |
Green | 0 | 0 | 0 | 0 | 0 | 1.4 | 1,116 | +0.3% | |
British Voice | 0 | 0 | 0 | 0 | 0 | 0.4 | 324 | +0.4% | |
Socialist Alternative | 0 | 0 | 0 | 0 | 0 | 0.3 | 240 | +0.0% | |
UKIP | 0 | 0 | 0 | 0 | 0 | 0.2 | 148 | +0.0% | |
Party | Candidate | Votes | % | ± | |
---|---|---|---|---|---|
Labour | Jean Martin | 1,407 | 37.2 | -4.4 | |
Conservative | Richard Molloy | 1,124 | 29.7 | -1.6 | |
Independent | John Evans | 708 | 18.7 | +4.9 | |
Liberal Democrat | Oliver Wadsworth | 544 | 14.4 | +1.2 | |
Majority | 283 | 7.5 | -2.8 | ||
Turnout | 3,783 | ||||
Labour hold | Swing | ||||
Party | Candidate | Votes | % | ± | |
---|---|---|---|---|---|
Labour | Yvonne Crewe | 1,689 | 57.2 | -0.8 | |
BNP | Stephen Rogerson | 553 | 18.7 | -6.2 | |
Conservative | Eamonn Mullins | 374 | 12.7 | -4.4 | |
Liberal Democrat | Paul Kirby | 337 | 11.4 | +11.4 | |
Majority | 1,136 | 38.5 | +5.4 | ||
Turnout | 2,953 | ||||
Labour hold | Swing | ||||
Party | Candidate | Votes | % | ± | |
---|---|---|---|---|---|
Labour | Heather Hudson | 1,563 | 48.2 | 1.4 | |
Liberal Democrat | Michael Burch | 619 | 19.1 | +2.6 | |
BNP | Dawn Byrom | 546 | 16.8 | -2.9 | |
Conservative | Tom Dixon | 513 | 15.8 | +1.6 | |
Majority | 944 | 29.1 | -0.8 | ||
Turnout | 3,241 | ||||
Labour hold | Swing | ||||
Party | Candidate | Votes | % | ± | |
---|---|---|---|---|---|
Labour | Tony Wallis | 2,077 | 63.4 | +10.6 | |
BNP | Rita Robinson | 745 | 22.7 | -1.9 | |
Conservative | Tony Ayoade | 453 | 13.8 | +4.5 | |
Majority | 1,332 | 40.7 | +12.5 | ||
Turnout | 3,275 | ||||
Labour hold | Swing | ||||
Party | Candidate | Votes | % | ± | |
---|---|---|---|---|---|
Labour | Maureen Cummings | 2,029 | 46.1 | +10.2 | |
Conservative | Elizabeth Hick | 1,500 | 34.1 | +6.0 | |
BNP | Dean Crossland | 873 | 19.8 | +0.2 | |
Majority | 529 | 12.0 | +4.2 | ||
Turnout | 4,402 | ||||
Labour hold | Swing | ||||
Party | Candidate | Votes | % | ± | |
---|---|---|---|---|---|
Independent | Pauline Guy | 1,828 | 41.5 | -8.6 | |
Labour | Maureen Tennant-King | 1,698 | 38.5 | -3.0 | |
BNP | Michael Wain | 392 | 8.9 | +8.9 | |
Liberal Democrat | Brendan Power | 260 | 5.9 | +5.9 | |
Conservative | Charles Scholes | 232 | 5.3 | -2.1 | |
Majority | 130 | 3.0 | -4.6 | ||
Turnout | 4,410 | ||||
Independent hold | Swing | ||||
Party | Candidate | Votes | % | ± | |
---|---|---|---|---|---|
Labour | Wayne Jenkins | 1,547 | 51.8 | -14.3 | |
Independent | John Helliwell | 993 | 33.3 | +33.3 | |
Conservative | Christian l'Anson | 446 | 14.9 | -19.0 | |
Majority | 554 | 18.5 | -13.7 | ||
Turnout | 2,986 | ||||
Labour hold | Swing | ||||
Party | Candidate | Votes | % | ± | |
---|---|---|---|---|---|
Conservative | Alyson Ripley | 1,822 | 42.7 | +8.4 | |
Labour | Brian Holmes | 1,623 | 38.0 | +7.7 | |
Liberal Democrat | David Rowland | 825 | 19.3 | -1.9 | |
Majority | 199 | 4.7 | +0.7 | ||
Turnout | 4,270 | ||||
Conservative gain from Labour | Swing | ||||
Party | Candidate | Votes | % | ± | |
---|---|---|---|---|---|
Labour | Glenn Burton | 1,545 | 61.5 | -2.6 | |
Conservative | Mellisa Wan Omer | 498 | 19.8 | -16.1 | |
Independent | Nathan Garbutt | 470 | 18.7 | +18.7 | |
Majority | 1,047 | 41.7 | +13.5 | ||
Turnout | 2,513 | ||||
Labour hold | Swing | ||||
Party | Candidate | Votes | % | ± | |
---|---|---|---|---|---|
Labour | David Dagger | 1,218 | 40.0 | -3.3 | |
Independent | Graeme Milner | 758 | 24.9 | +11.3 | |
BNP | Adam Frazer | 488 | 16.0 | -5.1 | |
Conservative | Michael Ledgard | 353 | 11.6 | -1.9 | |
Liberal Democrat | Jack Smith | 230 | 7.5 | -1.1 | |
Majority | 460 | 15.1 | -7.1 | ||
Turnout | 3,047 | ||||
Labour gain from Independent | Swing | ||||
Party | Candidate | Votes | % | ± | |
---|---|---|---|---|---|
Liberal Democrat | Elizabeth Knowles | 1,665 | 36.5 | -2.2 | |
Conservative | Susan Armitage | 1,162 | 25.5 | +8.0 | |
Labour | David Watts | 1,109 | 24.3 | -1.7 | |
BNP | Suzy Cass | 620 | 13.6 | -4.2 | |
Majority | 503 | 11.0 | -1.7 | ||
Turnout | 4,556 | ||||
Liberal Democrat hold | Swing | ||||
Party | Candidate | Votes | % | ± | |
---|---|---|---|---|---|
Labour | Patricia Garbutt | 1,695 | 52.8 | -9.2 | |
Conservative | Philip Thomas | 1,517 | 47.2 | +9.2 | |
Majority | 178 | 5.6 | -18.4 | ||
Turnout | 3,212 | ||||
Labour hold | Swing | ||||
Party | Candidate | Votes | % | ± | |
---|---|---|---|---|---|
Conservative | Philip Booth | 2,241 | 49.8 | +7.6 | |
Labour | Bill O'Brien | 1,685 | 37.4 | -3.8 | |
Liberal Democrat | Chris Rush | 575 | 12.8 | +12.8 | |
Majority | 556 | 12.4 | +11.4 | ||
Turnout | 4,501 | ||||
Conservative hold | Swing | ||||
Party | Candidate | Votes | % | ± | |
---|---|---|---|---|---|
Independent | Harold Mills | 2,042 | 55.0 | +55.0 | |
Labour | Malcolm Evans | 1,280 | 34.5 | -38.8 | |
Conservative | Sheila Scholes | 390 | 10.5 | -16.2 | |
Majority | 762 | 20.5 | |||
Turnout | 3,712 | ||||
Independent hold | Swing | ||||
Party | Candidate | Votes | % | ± | |
---|---|---|---|---|---|
Labour | Clive Hudson | 1,338 | 35.9 | +2.4 | |
Conservative | Simon Wilson | 1,130 | 30.3 | +3.8 | |
Liberal Democrat | David Evans | 679 | 18.2 | -0.8 | |
BNP | Glenn Fothergill | 581 | 15.6 | -5.3 | |
Majority | 208 | 5.6 | -1.4 | ||
Turnout | 3,728 | ||||
Labour hold | Swing | ||||
Party | Candidate | Votes | % | ± | |
---|---|---|---|---|---|
Labour | Ron Halliday | 1,603 | 46.6 | +2.4 | |
Conservative | Margaret Holwell | 773 | 22.5 | +3.9 | |
Liberal Democrat | Ather Mohammed | 426 | 12.4 | -3.1 | |
BNP | Robert Arnold | 399 | 11.6 | -3.5 | |
Socialist Alternative | Michael Griffiths | 240 | 7.0 | +0.4 | |
Majority | 830 | 24.1 | -1.5 | ||
Turnout | 3,441 | ||||
Labour hold | Swing | ||||
Party | Candidate | Votes | % | ± | |
---|---|---|---|---|---|
Labour | Margaret Isherwood | 1,262 | 36.6 | -2.3 | |
Conservative | Nick Pickles | 957 | 27.8 | +5.6 | |
Liberal Democrat | Mark Goodair | 612 | 17.8 | +0.0 | |
BNP | Graham Thewlis-Hardy | 405 | 11.8 | -5.7 | |
UKIP | Keith Wells | 148 | 4.3 | +0.6 | |
Independent | Mark Harrop | 61 | 1.8 | +1.8 | |
Majority | 305 | 8.8 | -7.9 | ||
Turnout | 3,445 | ||||
Labour hold | Swing | ||||
Party | Candidate | Votes | % | ± | |
---|---|---|---|---|---|
Conservative | Bryan Denson | 2,373 | 52.4 | +1.3 | |
Labour | Martyn Johnson | 1,210 | 26.7 | -4.4 | |
Green | John Lumb | 642 | 14.2 | -3.6 | |
Independent | Michael Greensmith | 300 | 6.6 | +6.6 | |
Majority | 1,163 | 25.7 | +5.7 | ||
Turnout | 4,525 | ||||
Conservative hold | Swing | ||||
Party | Candidate | Votes | % | ± | |
---|---|---|---|---|---|
Conservative | Monica Graham | 1,817 | 41.6 | +12.2 | |
Independent | Norman Hazell | 875 | 20.1 | -8.9 | |
Labour | Charles Keith | 756 | 17.3 | +0.6 | |
BNP | Neville Poynton | 402 | 9.2 | -4.1 | |
Liberal Democrat | Stephen Nuthall | 316 | 7.2 | -4.4 | |
Green | Miriam Hawkins | 197 | 4.5 | +4.5 | |
Majority | 942 | 21.5 | +21.1 | ||
Turnout | 4,363 | ||||
Conservative hold | Swing | ||||
Party | Candidate | Votes | % | ± | |
---|---|---|---|---|---|
Conservative | Bill Sanders | 2,202 | 54.9 | -2.2 | |
Labour | Javed Iqbal | 845 | 21.1 | -9.5 | |
Liberal Democrat | Susan Morgan | 366 | 9.1 | -3.2 | |
British Voice | Norman Tate | 324 | 8.1 | +8.1 | |
Green | Brian Else | 277 | 6.9 | +6.9 | |
Majority | 1,357 | 33.8 | +7.3 | ||
Turnout | 4,014 | ||||
Conservative hold | Swing | ||||
Party | Candidate | Votes | % | ± | |
---|---|---|---|---|---|
Conservative | Richard Hunt | 1,617 | 39.9 | -6.4 | |
Labour | Philip Dobson | 1,444 | 35.6 | +0.2 | |
Liberal Democrat | Margaret Dodd | 502 | 12.4 | +12.4 | |
BNP | Grant Rowe | 494 | 12.2 | -6.1 | |
Majority | 173 | 4.3 | -6.6 | ||
Turnout | 4,057 | ||||
Conservative gain from Labour | Swing | ||||
Normanton was a county constituency represented in the House of Commons of the Parliament of the United Kingdom. It elected one Member of Parliament (MP) by the first past the post system of election.
The 2007 Craven District Council election took place on 3 May 2007 to elect members of Craven District Council in North Yorkshire, England. One third of the council was up for election and the council stayed under no overall control.
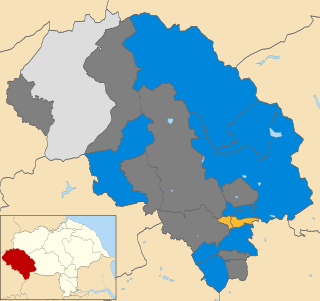
The 2008 Craven District Council election took place on 1 May 2008 to elect members of Craven District Council in North Yorkshire, England. One third of the council was up for election and the council stayed under no overall control.
Elections to Calderdale Metropolitan Borough Council were held on 3 May 2007 with the exception of the Warley ward which was postponed until 14 June 2007 due to the sudden death of one of the candidates. One third of the council was up for election and the council stayed under no overall control with a minority Conservative administration. The total turnout of the election was 38.01%. The winning candidate in each ward is highlighted in bold.
The 2003 Hull City Council election took place on 1 May 2003 to elect members of Hull City Council in England. One third of the council was up for election and the council stayed under no overall control.
The 2004 Hull City Council election took place on 10 June 2004 to elect members of Hull City Council in England. One third of the council was up for election and the council stayed under no overall control.
The 2006 Hull City Council election took place on 4 May 2006 to elect members of Hull City Council in England. One third of the council was up for election and the council stayed under no overall control. Overall turnout was 27.3%.
The 2007 Hull City Council election took place on 3 May 2007 to elect members of Hull City Council in England. One third of the council was up for election and the Liberal Democrats gained overall control of the council from no overall control. Overall turnout was 27%.
The 2007 St Albans City and District Council election took place on 3 May 2007 to elect members of St Albans District Council in Hertfordshire, England. One third of the council was up for election and the Liberal Democrats lost overall control of the council to no overall control.
The 2002 Wakefield Metropolitan District Council election took place on 2 May 2002 to elect members of Wakefield Metropolitan District Council in West Yorkshire, England. One third of the council was up for election and the Labour party kept overall control of the council.
The 2003 Wakefield Metropolitan District Council election took place on 1 May 2003 to elect members of Wakefield Metropolitan District Council in West Yorkshire, England. One third of the council was up for election and the Labour party kept overall control of the council.
The 2004 Wakefield Metropolitan District Council election took place on 10 June 2004 to elect members of Wakefield Metropolitan District Council in West Yorkshire, England. The whole council was up for election with boundary changes since the last election in 2003. The Labour party stayed in overall control of the council.
The 2006 Wakefield Metropolitan District Council election took place on 4 May 2006 to elect members of Wakefield Metropolitan District Council in West Yorkshire, England. One third of the council was up for election and the Labour party kept overall control of the council.
The 2008 Wakefield Metropolitan District Council election took place on 1 May 2008 to elect members of Wakefield Metropolitan District Council in West Yorkshire, England. One third of the council was up for election and the Labour party stayed in overall control of the council.
The Leeds City Council election took place on 2 May 2002 to elect members of City of Leeds Metropolitan Borough Council in West Yorkshire, England. Prior to the election, there had been several by-elections held with no change to the council composition. One third of the council was up for election and the Labour party stayed in overall control of the council.
The Leeds City Council election took place on 1 May 2003 to elect members of City of Leeds Metropolitan Borough Council in West Yorkshire, England. One third of the council was up for election and the Labour party stayed in overall control of the council.
The 2004 Harrogate Council election took place on 10 June 2004 to elect members of Harrogate Borough Council in North Yorkshire, England. One third of the council was up for election and the Conservative party stayed in overall control of the council.
The 2006 Brent London Borough Council election took place on 4 May 2006 to elect members of Brent London Borough Council in London, England. The whole council was up for election and the Labour Party lost overall control of the council to no overall control.
The 2012 Craven District Council election took place on 3 May 2012 to elect members of Craven District Council in North Yorkshire, England. One third of the council was up for election and the Conservative party stayed in overall control of the council.
The 2007 South Kesteven District Council election took place on 3 May 2007 to elect members of South Kesteven District Council in Lincolnshire, England. The whole council was up for election and the Conservative party stayed in overall control of the council.