The 2010 Calderdale Metropolitan Borough Council election took place on 6 May 2010 to elect members of Calderdale Metropolitan Borough Council in England. This was on the same day as other local elections and a general election. One councillor was elected in each ward for a four-year term so the councillors elected in 2010 last stood for election in 2006. Each ward is represented by three councillors, the election of which is staggered, so only one third of the councillors was elected in this election. After the election the council stayed in no overall control but the Conservative minority administration was replaced with a coalition between Labour and the Liberal Democrats. [1]
Calderdale Metropolitan Borough Council is the local authority of the Metropolitan Borough of Calderdale in West Yorkshire, England. It is a metropolitan district council, one of five in West Yorkshire and one of 36 in the metropolitan counties of England, and provides the majority of local government services in Calderdale. Since 1 April 2014 it has been a constituent council of the West Yorkshire Combined Authority.
Brighouse Councillor Joyce Cawthra left the Conservative Party and became an Independent in December 2010 due to her not being selected by the party to stand in the next election. [2]
Calderdale [3] | |||||||||||||||
---|---|---|---|---|---|---|---|---|---|---|---|---|---|---|---|
Candidates | Votes | ||||||||||||||
Party | Stood | Elected | Gained | Unseated | Net | % of total | % | № | Net % | ||||||
Conservative | 17 | 4 | 1 | 2 | 23.53 | 31.99 | 30,275 | ||||||||
Liberal Democrat | 17 | 7 | 2 | 0 | 41.18 | 29.48 | 27,893 | ||||||||
Labour | 17 | 4 | 1 | 0 | 23.53 | 26.31 | 24,898 | ||||||||
Independent | 5 | 2 | 0 | 0 | 0 | 11.76 | 4.93 | 4,661 | |||||||
BNP | 6 | 0 | 0 | 1 | 0.00 | 4.33 | 4,100 | ||||||||
Green | 7 | 0 | 0 | 0 | 0 | 0.00 | 2.66 | 2,520 | |||||||
BPP | 1 | 0 | 0 | 0 | 0 | 0.00 | 0.30 | 283 | |||||||
Prior to the election the composition of the council was:
21 | 15 | 9 | 3 | 2 | 1 |
Conservative | Lib Dem | Labour | Ind | BN | ED |
After the election the composition of the council was:
20 | 17 | 10 | 3 | 1 |
Conservative | Lib Dem | Labour | Ind | BN |
Party | Previous council | New council | |||
---|---|---|---|---|---|
Conservative | 21 | 20 | |||
Liberal Democrat | 15 | 17 | |||
Labour | 9 | 10 | |||
Independent | 3 | 3 | |||
BNP | 2 | 1 | |||
English Democrat | 1 | 0 | |||
Total | 51 | 51 |
Party | Candidate | Votes | % | ± | |
---|---|---|---|---|---|
Independent | Colin Stout | 1,935 | |||
Conservative | Kris Pillai | 1,317 | |||
Liberal Democrat | Nick Yates | 1,270 | |||
Labour | Pamela Margaret Fellows | 1,086 | |||
Majority | |||||
Turnout | 5,641 | 66.11 | |||
Independent hold | Swing | ||||
The incumbent was Colin Stout as an Independent.
Party | Candidate | Votes | % | ± | |
---|---|---|---|---|---|
Liberal Democrat | Nader Fekri | 2,775 | |||
Conservative | Gail Lund | 1,575 | |||
Labour | Robin Dixon | 1,538 | |||
Green | Alan Patrick McDonald | 762 | |||
Majority | |||||
Turnout | 6,694 | 72.90 | |||
Liberal Democrat hold | Swing | ||||
The incumbent was Nader Fekri for the Liberal Democrats.
Party | Candidate | Votes | % | ± | |
---|---|---|---|---|---|
Liberal Democrat | David Hardy | 2,069 | |||
Conservative | Christian Corkish | 1,534 | |||
Labour | Angie Gallagher | 1,227 | |||
Green | Susan Ann Thomas | 211 | |||
Majority | |||||
Turnout | 5,087 | 59.34 | |||
Liberal Democrat hold | Swing | ||||
The incumbent was Robert Thompson for the Liberal Democrats who stood down at this election.
Party | Candidate | Votes | % | ± | |
---|---|---|---|---|---|
Liberal Democrat | Conrad Vero Winterburn | 2,551 | |||
Conservative | Beverley Anne Carter | 1,854 | |||
Labour | James Gallagher | 893 | |||
Green | Mark Richard Mullany | 262 | |||
Majority | |||||
Turnout | 5,599 | 66.47 | |||
Liberal Democrat hold | Swing | ||||
The incumbent was Conrad Winterbottom for the Liberal Democrats.
Party | Candidate | Votes | % | ± | |
---|---|---|---|---|---|
Independent | Colin Raistrick | 2,213 | |||
Conservative | John Frank Brearley Ford | 1,971 | |||
Labour | Sean Patrick O'Malley | 933 | |||
Liberal Democrat | Jennie Dawn Rigg | 860 | |||
Majority | |||||
Turnout | 6,022 | 69.48 | |||
Independent hold | Swing | ||||
The incumbent was Colin Raistrick as an Independent.
Party | Candidate | Votes | % | ± | |
---|---|---|---|---|---|
Labour | Daniel James Sutherland | 1,995 | |||
Conservative | Andrew James Tagg | 1,403 | |||
BNP | Richard Mulhall | 1,226 | |||
Liberal Democrat | Philip Anthony Walters | 701 | |||
Independent | Sean Vincent Loftus | 114 | |||
Majority | |||||
Turnout | 5,470 | 58.20 | |||
Labour gain from BNP | Swing | ||||
The incumbent was Geoffrey Wallace for the BNP who stood down at this election.
Party | Candidate | Votes | % | ± | |
---|---|---|---|---|---|
Liberal Democrat | John Christopher Beacroft-Mitchell | 2,138 | |||
Conservative | Sarah Jane Jennings | 1,626 | |||
Labour | Lesley Anne Sleigh | 1,036 | |||
BNP | John Derek Gregory | 398 | |||
Green | Jennifer Byrom | 315 | |||
Majority | |||||
Turnout | 5,532 | 70.21 | |||
Liberal Democrat hold | Swing | ||||
The incumbent was Peter Coles for the Liberal Democrats who stood down at this election.
Party | Candidate | Votes | % | ± | |
---|---|---|---|---|---|
Conservative | Stephen Baines | 3,281 | |||
Labour | Martin Burton | 1,301 | |||
Liberal Democrat | Elizabeth Margaret Ward | 1,183 | |||
BNP | Ann Jackson | 521 | |||
Majority | |||||
Turnout | 6,360 | 70.12 | |||
Conservative hold | Swing | ||||
The incumbent was Stephen Baines for the Conservative Party.
Party | Candidate | Votes | % | ± | |
---|---|---|---|---|---|
Labour | Helen Josephine Rivron | 1,887 | |||
Conservative | Peter Caffrey | 860 | |||
Liberal Democrat | Kathleen Haigh-Hutchinson | 680 | |||
BNP | Jane Shooter | 727 | |||
Majority | |||||
Turnout | 4,169 | 49.28 | |||
Labour hold | Swing | ||||
The incumbent was Helen Rivron for the Labour Party.
Party | Candidate | Votes | % | ± | |
---|---|---|---|---|---|
Labour | Ferman Ali | 2,381 | |||
Liberal Democrat | Mohammed Shazad Fazal | 1,856 | |||
Conservative | Mohammed Khalid Rashid | 1,196 | |||
Majority | |||||
Turnout | 5,562 | 61.42 | |||
Labour hold | Swing | ||||
The incumbent was Zafar Iqbal-Din for the Labour Party who stood down at this election.
Party | Candidate | Votes | % | ± | |
---|---|---|---|---|---|
Conservative | Christine Beal | 2,574 | |||
Liberal Democrat | Martin David Robinson | 1,438 | |||
Labour Co-op | Ann Martin | 1,409 | |||
Majority | |||||
Turnout | 5,460 | 64.36 | |||
Conservative gain from English Democrat | Swing | ||||
The incumbent was Paul Rogan for the English Democrats who stood down at this election.
Party | Candidate | Votes | % | ± | |
---|---|---|---|---|---|
Conservative | Kay Barret | 2,687 | |||
Labour | Judy Gannon | 1,559 | |||
Liberal Democrat | Malcolm Graham James | 1,418 | |||
Green | Freda Mary Davis | 291 | |||
Majority | |||||
Turnout | 5,999 | 68.39 | |||
Conservative hold | Swing | ||||
The incumbent was Kay Barret for the Conservative Party.
Party | Candidate | Votes | % | ± | |
---|---|---|---|---|---|
Liberal Democrat | Pauline Nash | 2,748 | |||
Conservative | Sheila Ruth Helen Jackson | 2,334 | |||
Labour Co-op | Anne Collins | 1,124 | |||
Green | Charles Gate | 324 | |||
Majority | |||||
Turnout | 6,602 | 68.62 | |||
Liberal Democrat gain from Conservative | Swing | ||||
The incumbent was Grenville Horsfall for the Conservative Party who stood down at this election.
Party | Candidate | Votes | % | ± | |
---|---|---|---|---|---|
Conservative | Martin Peel | 1,862 | |||
Labour Co-op | David Draycott | 1,654 | |||
Liberal Democrat | Michael Christopher Lumb | 1,510 | |||
Majority | |||||
Turnout | 5,134 | 61.66 | |||
Conservative hold | Swing | ||||
The incumbent was Martin Peel for the Conservative Party.
Party | Candidate | Votes | % | ± | |
---|---|---|---|---|---|
Liberal Democrat | Ruth Goldthorpe | 1,916 | |||
Conservative | Julie Louise Stansfield | 1,665 | |||
Labour | Jayne Booth | 1,502 | |||
Green | Mark Hill | 355 | |||
BPP | David Jones | 283 | |||
Majority | |||||
Turnout | 5,754 | 65.17 | |||
Liberal Democrat hold | Swing | ||||
The incumbent was Ruth Goldthorpe for the Liberal Democrats.
Party | Candidate | Votes | % | ± | |
---|---|---|---|---|---|
Labour | Bob Metcalfe | 1,936 | |||
Conservative | Geoffrey Thompson | 1,187 | |||
Liberal Democrat | Mat Bowles | 875 | |||
BNP | Michael Hall | 678 | |||
Independent | Chris O'Conner | 243 | |||
Majority | |||||
Turnout | 4,958 | 55.92 | |||
Labour hold | Swing | ||||
The incumbent was Bob Metcalfe for the Labour Party.
Party | Candidate | Votes | % | ± | |
---|---|---|---|---|---|
Liberal Democrat | Ashley John Richard Evans | 1,905 | |||
Labour | Rod Sutcliffe | 1,437 | |||
Conservative | David Ian Ginley | 1,349 | |||
BNP | Paul Leslie Steven Wadsworth | 550 | |||
Independent | Kelly Marie Catlow | 156 | |||
Majority | |||||
Turnout | 5,437 | 63.65 | |||
Liberal Democrat gain from Conservative | Swing | ||||
The incumbent was David Ginley for the Conservative Party.
Elections to Slough Borough Council were held on 4 May 2006. One third of the council was up for election. This was the 121st Slough general local authority election since Slough became a local government unit in 1863.
Elections to Calderdale Metropolitan Borough Council were held on 1 May 2008. One third of the council was up for election and the council stayed under no overall control with a minority Conservative administration.
Elections to Calderdale Metropolitan Borough Council were held on 4 May 2006. One third of the council was up for election and the council stayed under no overall control with a minority Conservative administration.
Elections to Calderdale Metropolitan Borough Council were held on 6 May 1999. One third of the council was up for election and the Labour party lost overall control of the council to no overall control. The overall turnout of the election was 30.09%. The winning candidate in each ward is highlighted in bold.
Elections to Calderdale Metropolitan Borough Council were held on 3 May 2007 with the exception of the Warley ward which was postponed until 14 June 2007 due to the sudden death of one of the candidates. One third of the council was up for election and the council stayed under no overall control with a minority Conservative administration. The total turnout of the election was 38.01%. The winning candidate in each ward is highlighted in bold.
The 2003 South Tyneside Metropolitan Borough Council election took place on 1 May 2003 to elect members of South Tyneside Metropolitan Borough Council in Tyne and Wear, England. One third of the council was up for election and the Labour party kept overall control of the council.
Local elections were held in the United Kingdom in 1980. These were the first annual local elections for the new Conservative Prime Minister Margaret Thatcher. Though the Conservatives in government lost seats, the projected share of the vote was close: Labour Party 42%, Conservative Party 40%, Liberal Party 13%. Labour were still being led by the former prime minister James Callaghan, who resigned later in the year to be succeeded by Michael Foot.
The 2007 Solihull Metropolitan Borough Council election took place on 4 May 2007 to elect members of Solihull Metropolitan Borough Council in the West Midlands, England. One third of the council was up for election and the Conservative party lost overall control of the council to no overall control.
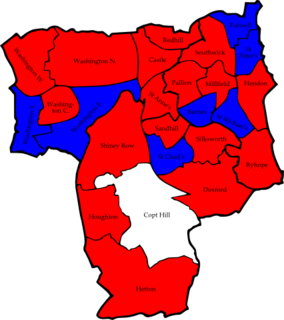
The 2007 Sunderland Council election took place on 3 May 2007 to elect members of Sunderland Metropolitan Borough Council in Tyne and Wear, England. One third of the council was up for election and the Labour party stayed in overall control of the council.
The 2008 Sunderland Council election took place on 1 May 2008 to elect members of Sunderland Metropolitan Borough Council in Tyne and Wear, England. One third of the council was up for election and the Labour party stayed in overall control of the council.
The 2010 Sunderland Council election took place on 6 May 2010 to elect members of Sunderland Metropolitan Borough Council in Tyne and Wear, England. One third of the council was up for election and the Labour party stayed in overall control of the council. The election took place on the same day as the 2010 General Election.
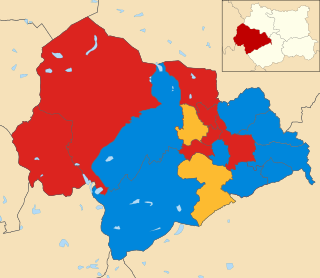
Elections to Calderdale Metropolitan Borough Council took place on Thursday 5 May 2011.
The 2012 Calderdale Metropolitan Borough Council election took place on 3 May 2012 to elect members of Calderdale Metropolitan Borough Council in West Yorkshire, England. This was on the same day as other United Kingdom local elections, 2012. After the election the council continued to have no overall control and continue to be run by a coalition between the Labour Party and the Liberal Democrats.
The 2014 Calderdale Metropolitan Borough Council election took place on 22 May 2014 to elect members of Calderdale Metropolitan Borough Council in England. This was on the same day as local elections across the United Kingdom and a European election. One councillor was elected in each of the 17 wards for a four-year term. There are three councillors representing each ward elected on a staggered basis so one third of the councillor seats were up for re-election. The seats had previously been contested in 2010 which was held in conjunction with a general election. The turnout was significantly lower in 2014 than in 2010 which is not unusual when comparing local elections that coincide with general elections to ones that do not. Prior to the election Labour was the largest party in the council with 21 out of 51 seats, 5 seats short of an overall majority. After the election there was no overall control of the council. Labour had 25 seats, only one short of a majority and so Labour continued to operate a minority administration.
The 2015 Calderdale Metropolitan Borough Council election took place on 7 May 2015 to elect members of Calderdale in England. This was on the same day as other local elections and a general election. One councillor was elected in each ward for a four-year term so the councillors elected in 2015 last stood for election in 2011. Each ward is represented by three councillors, the election of which is staggered, so only one third of the councillors were elected in this election. Before the election there was no overall control with a minority Labour administration which was over-ruled at a Budget vote by a coalition of Conservatives & Liberal Democrats leading to a Conservative minority administration. After the election there was still no overall control & a Labour minority administration was formed again.
Elections for Boston Borough Council, which governs as a second-tier authority the Borough of Boston were held on Thursday 7 May 2015. Following Boundary Commission changes between this election and the previous in 2011 to the wards, 30 councillors were elected to serve 15 wards. The election was held on the same day as other local elections.
The 2016 Calderdale Metropolitan Borough Council election took place on 5 May 2016 to elect members of Calderdale Metropolitan Borough Council in England. This was on the same day as other local elections. One councillor was elected in each ward for a four-year term so the councillors elected in 2016 last stood for election in 2012. Each ward is represented by three councillors, the election of which is staggered, so only one third of the councillors was elected in this election. Before the election there was no overall control with a minority Labour administration. After the election there was still no overall control so the minority Labour administration continued.
Skircoat is an electoral ward in Calderdale, West Yorkshire, England, and returns three members to sit on Calderdale Metropolitan Borough Council. The population at the 2011 Census was 12,712. It covers the area of Skircoat Green.
The 2018 Calderdale Metropolitan Borough Council election took place on 3 May 2018 to elect members of Calderdale Metropolitan Borough Council in England. This was on the same day as other local elections. One councillor was elected in each ward for a four-year term so the councillors elected in 2018 last stood for election in 2014. Each ward is represented by three councillors, the election of which is staggered, so only one third of the councillors were elected in this election. Before the election there was no overall control with a minority Labour administration. Following the election Labour, having gained one councillor, was still two councillors away from a majority so it remained no overall control.
The 2018 City of Bradford Metropolitan District Council took place on 3 May 2018 to elect members of Bradford District Council in England. This was on the same day as other local elections. One councillor was elected in each ward for a four-year term so the councillors elected in 2018 last stood for election in 2014. Each ward is represented by three councillors, the election of which is staggered, so only one third of the councillors were elected in this election. Before the election there was a Labour majority and afterwards Labour had increased their majority.