City of Bradford Metropolitan District Council election, 1996

Last updated
Map of the results for the 1996 Bradford council election. Bradford UK local election 1996 map.png
Map of the results for the 1996 Bradford council election.

The City of Bradford Metropolitan District Council elections were held on Thursday, 2 May 1996, with one third of the council up for election. Labour retained control of the council. [1] [2]

City of Bradford Metropolitan District Council Local government body in England

City of Bradford Metropolitan District Council is the local authority of the City of Bradford in West Yorkshire, England. It is a metropolitan district council, one of five in West Yorkshire and one of 36 in the metropolitan counties of England, and provides the majority of local government services in Bradford. Since 1 April 2014 it has been a constituent council of the West Yorkshire Combined Authority.

The Labour Party is a centre-left political party in the United Kingdom which has been described as an alliance of social democrats, democratic socialists and trade unionists. The party's platform emphasises greater state intervention, social justice and strengthening workers' rights.

Contents

Election result

Bradford Local Election Result 1996 [1]
PartySeatsGainsLossesNet gain/lossSeats %Votes %Votes+/−
  Labour 23130Increase2.svg1376.749.458,339-5.0%
  Conservative 4015Decrease2.svg1513.331.837,575+3.3%
  Liberal Democrat 320Increase2.svg29.916.319,302+2.5%
  Green 000Steady2.svg0.01.51,825-0.4%
  Independent Labour 000Steady2.svg0.00.6732-0.2%
Militant Labour 000Steady2.svg0.00.3362+0.1%

This result had the following consequences for the total number of seats on the council after the elections:

PartyPrevious councilNew council
Labour5871
Conservative2813
Liberal Democrat46
Total9090
Working majority 26  52 

Ward results

Baildon [1]
PartyCandidateVotes%±
Liberal Democrat A. Micklem2,54053.3+9.7
Conservative R. Cope1,69735.6+1.6
Labour M. Yaqoob53111.1-7.1
Majority84317.7+8.1
Turnout 4,768
Liberal Democrat gain from Conservative Swing +4.0
Bingley [1]
PartyCandidateVotes%±
Labour E. Sinclair1,95944.0-12.5
Conservative C. Gill1,90342.7+6.4
Liberal Democrat C. Svensgaard4129.2+9.2
Green M. Thompson1794.0-3.2
Majority561.3-18.9
Turnout 4,453
Labour gain from Conservative Swing -9.4
Bingley Rural [1]
PartyCandidateVotes%±
Conservative P. Pettit2,03046.4+2.8
Labour M. Leslie1,80241.2-2.0
Liberal Democrat J. Hutton54112.4-0.8
Majority2285.2+4.9
Turnout 4,373
Conservative hold Swing +2.4
Bolton [1]
PartyCandidateVotes%±
Liberal Democrat H. Middleton2,07354.0+15.7
Labour B. Singh1,09628.5-13.7
Conservative M. Gaunt67317.5-2.0
Majority97725.4+21.4
Turnout 3,842
Liberal Democrat gain from Conservative Swing +14.7
Bowling [1]
PartyCandidateVotes%±
Labour J. Ryan1,81957.1+5.6
Independent Labour D. Coughlin73223.0-3.7
Conservative J. Ridyard36211.4+3.8
Liberal Democrat R. Harrington2738.6-3.0
Majority1,08734.1+9.3
Turnout 3,186
Labour hold Swing +4.6
Bradford Moor [1]
PartyCandidateVotes%±
Labour G. Khaliq2,04650.0+5.7
Conservative M. Choudhary1,64240.1-2.9
Liberal Democrat J. Collins4039.8-2.8
Majority4049.9+8.6
Turnout 4,091
Labour hold Swing +4.3
Clayton [1]
PartyCandidateVotes%±
Labour G. Whitfield1,99251.2+0.5
Conservative E. Byrom1,48738.2-1.5
Liberal Democrat A. Wilson-Fletche3087.9+1.4
Green M. Rawnsley1042.7-0.4
Majority50513.0+2.0
Turnout 3,891
Labour gain from Conservative Swing +1.0
Craven [1]
PartyCandidateVotes%±
Conservative D. Harrison2,11347.0+4.6
Labour R. Kelly1,76239.2-5.9
Liberal Democrat G. Morgan62313.8+1.2
Majority3517.8+5.1
Turnout 4,498
Conservative hold Swing +5.2
Eccleshill [1]
PartyCandidateVotes%±
Labour S. Rooney1,52453.1-7.3
Conservative H. Lycett90331.4+5.3
Liberal Democrat M. Attenborough44415.5+2.1
Majority62121.6-12.7
Turnout 2,871
Labour gain from Conservative Swing -6.3
Great Horton [1]
PartyCandidateVotes%±
Labour F. Collard2,23060.2-3.8
Conservative M. Crabtree99326.8+5.5
Liberal Democrat C. Wright37010.0-1.7
Green W. Taylor1123.0+0.0
Majority1,23733.4-9.2
Turnout 3,705
Labour gain from Conservative Swing -4.6
Heaton [1]
PartyCandidateVotes%±
Labour M. Ajeeb2,25145.1-16.7
Conservative J. King2,10242.1+15.0
Liberal Democrat A. Cruden4058.1+0.5
Green J. Robinson2314.6+1.2
Majority1493.0-31.7
Turnout 4,989
Labour gain from Conservative Swing -15.8
Idle [1]
PartyCandidateVotes%±
Liberal Democrat D. Ward2,17352.7+15.0
Labour F. Dale1,30031.5-16.9
Conservative A. White64815.7+1.9
Majority87321.2+10.4
Turnout 4,121
Liberal Democrat hold Swing +15.9
Ilkley [1]
PartyCandidateVotes%±
Conservative C. Powell2,42151.5-4.3
Labour R. Fox1,51532.2-12.0
Liberal Democrat M. Cohen76516.3+16.3
Majority90619.3+7.7
Turnout 4,701
Conservative hold Swing +3.8
Keighley North [1]
PartyCandidateVotes%±
Labour A. Macpherson2,51255.6-7.3
Conservative K. Jepson1,51433.5+8.0
Liberal Democrat A. Carter49010.8-0.7
Majority99822.1-15.4
Turnout 4,516
Labour gain from Conservative Swing -7.6
Keighley South [1]
PartyCandidateVotes%±
Labour S. Thomas2,41175.5+1.0
Conservative C. Coleman46314.5+2.7
Liberal Democrat M. Hamid32010.0-3.7
Majority1,94861.0+0.2
Turnout 3,194
Labour hold Swing -0.8
Keighley West [1]
PartyCandidateVotes%±
Labour A. Mudd2,51161.5-3.9
Conservative W. Redman1,09926.9+5.1
Liberal Democrat J. Brooksbank47011.5-1.2
Majority1,41234.6-9.1
Turnout 4,080
Labour hold Swing -4.5
Little Horton [1]
PartyCandidateVotes%±
Labour M. Mir1,85765.8-5.6
Conservative G. Johnson45416.1+5.9
Liberal Democrat A. Griffiths35912.7+5.4
Militant Labour M. Dominguez1515.3-3.8
Majority1,40349.7-11.6
Turnout 2,821
Labour hold Swing -5.7
Odsal [1]
PartyCandidateVotes%±
Labour J. O'Neill2,31659.6-5.9
Conservative J. Robertshaw1,03726.7+6.1
Liberal Democrat K. Hall53213.7+2.3
Majority1,27932.9-12.0
Turnout 3,885
Labour gain from Conservative Swing -6.0
Queensbury [1]
PartyCandidateVotes%±
Labour M. Mason2,14555.2-10.0
Conservative L. Jagger1,24132.0+8.6
Liberal Democrat J. Saul49712.8+2.3
Majority90423.3-18.6
Turnout 3,883
Labour gain from Conservative Swing -9.3
Rombalds [1]
PartyCandidateVotes%±
Conservative D. Smith2,44650.8+7.1
Labour A. Atkins1,58833.0+1.8
Liberal Democrat J. Main78216.2-8.9
Majority85817.8+5.2
Turnout 4,816
Conservative hold Swing +2.6
Shipley East [1]
PartyCandidateVotes%±
Labour P. Thornton1,94463.7-3.3
Conservative D. Servant56818.6+3.5
Liberal Democrat J. Hall43114.1-0.1
Green M. Love1083.5+3.5
Majority1,37645.1-6.8
Turnout 3,051
Labour hold Swing -3.4
Shipley West [1]
PartyCandidateVotes%±
Labour H. Gundry2,12143.5-7.0
Conservative J. Carroll1,76636.2+2.2
Green D. Ford55411.4+3.1
Liberal Democrat J. Gregory4338.9+1.7
Majority3557.3-9.3
Turnout 4,874
Labour gain from Conservative Swing -4.6
Thornton [1]
PartyCandidateVotes%±
Labour D. Kettlewell1,56147.0-4.7
Conservative M. Ellis1,15534.8-0.1
Liberal Democrat H. Wright47714.4+3.8
Green A. Suchi872.6-0.4
Militant Labour L. Wilkinson381.1+1.1
Majority40612.2-4.8
Turnout 3,318
Labour gain from Conservative Swing -2.4
Toller [1]
PartyCandidateVotes%±
Labour D. Brown2,89152.2+8.6
Conservative A. Rashid2,19039.6-6.7
Liberal Democrat S. Devonshire2805.1-2.9
Green N. Taimuri1312.4+0.2
Militant Labour C. Thompson430.8+0.8
Majority70112.7+9.9
Turnout 5,535
Labour hold Swing +7.6
Tong [1]
PartyCandidateVotes%±
Labour J. Cairns1,55573.7-3.7
Conservative E. Harker30114.3+0.6
Liberal Democrat C. Devonshire2049.7+0.7
Green P. Braham492.3+2.3
Majority1,25459.5-4.3
Turnout 2,109
Labour hold Swing -2.1
Undercliffe [1]
PartyCandidateVotes%±
Labour P. Foord1,94263.2-4.3
Conservative E. Blackburn69022.5+8.3
Liberal Democrat E. Hallmann44014.3+1.2
Majority1,25240.8-12.7
Turnout 3,072
Labour hold Swing -6.3
University [1]
PartyCandidateVotes%±
Labour S. Hussain3,33172.3+3.9
Conservative I. Grieve60113.0-8.1
Liberal Democrat L. McKeever2776.0+6.0
Green N. Tart2705.9-4.6
Militant Labour S. Jackson1302.8+2.8
Majority2,73059.2+12.0
Turnout 4,609
Labour hold Swing +6.0
Wibsey [1]
PartyCandidateVotes%±
Labour V. McMath2,12961.2-4.1
Conservative R. Sheard90926.1+3.6
Liberal Democrat B. Boulton43912.6+0.5
Majority1,22035.1-7.7
Turnout 3,477
Labour gain from Conservative Swing -3.8
Worth Valley [1]
PartyCandidateVotes%±
Labour J. Cope1,80843.6-2.5
Conservative G. Hodgson1,24230.0-4.0
Liberal Democrat D. Samuels1,09326.4+6.5
Majority56613.7+1.6
Turnout 4,143
Labour gain from Conservative Swing -3.2
Wyke [1]
PartyCandidateVotes%±
Labour A. Niland1,89057.9-7.0
Conservative V. Owen92528.3+8.9
Liberal Democrat H. Boulton44813.7-1.8
Majority96529.6-15.9
Turnout 3,263
Labour gain from Conservative Swing -7.9

By-elections between 1996 and 1998

Heaton by-election 26 September 1996 [3] [4]
PartyCandidateVotes%±
Conservative John King2,04150.4+8.3
Labour 1,80844.6-0.5
Liberal Democrat 2025.0-3.1
Majority2335.8+2.8
Turnout 4,05134.8
Conservative gain from Labour Swing +4.4
Shipley West by-election 9 October 1997 [3] [5]
PartyCandidateVotes%±
Labour Rowland Dale1,26336.8-6.7
Conservative 1,22235.6-0.6
Green 66719.4+8.0
Liberal Democrat 2848.3-0.6
Majority411.2-6.1
Turnout 3,436
Labour hold Swing -3.0
Baildon by-election 20 November 1997 [3] [6]
PartyCandidateVotes%±
Liberal Democrat John Cole1,61452.3-1.0
Conservative 1,07734.9-0.7
Labour 37212.1+1.0
Independent 220.7+0.7
Majority53717.4-0.3
Turnout 3,08524.6
Liberal Democrat hold Swing -0.1

Related Research Articles

Allerdale Borough Council in Cumbria, England is elected every four years. Since the last boundary changes in 1999, 56 councillors have been elected from 31 wards.

One third of Rushmoor Borough Council in Hampshire, England is elected each year, followed by one year without election. From 1979, the council had 15 3-member wards, reduced to 14 wards in 2002 and 13 in 2012. Each ward elects 3 of the 39 councillors, one in each election year, for a term of 4 years, except in years when ward boundaries are changed when all councillors are elected for terms depending on their position in the poll.

South Hams District Council elections

South Hams District Council in Devon, England is elected every four years. Since the last boundary changes in 2015, 31 councillors have been elected from 20 wards: eleven of which elect one councillor, seven elect two councillors and two elect three counillors. Between 1999 and 2014, 40 councillors were elected from 30 wards.

One third of Preston City Council in Lancashire, England is elected each year, followed by one year without election to allow for the Lancashire County Council elections.

One third of Harrogate Borough Council in North Yorkshire, England is elected each year, followed by one year without election. Since the last boundary changes in 2002, 54 councillors have been elected from 35 wards.

One third of Basingstoke and Deane Borough Council in Hampshire, England is elected each year, followed by one year without election. Since the last boundary changes in 2008, 60 councillors have been elected from 30 wards.

Braintree District Council in Essex, England is elected every four years. Since the last boundary changes in 2015, 49 councillors have been elected from 26 wards.

Broxtowe Borough Council in Nottinghamshire, England is elected every four years. The Conservative party held overall control of the council from its foundation in 1973 until 1995 when the Labour party took control. Boundary changes took place for the 2003 election reducing the number of seats by five. The election saw Labour lose overall control of the council. Since 2003 the council has been under no overall control with Labour and the Liberal Democrats sharing power.

Half of Cheltenham Borough Council in Gloucestershire, England is elected every two years, while before 2002 the council was elected by thirds. Since the last boundary changes in 2002, 40 councillors have been elected from 20 wards.

One third of Cherwell District Council in Oxfordshire, England is elected each year, followed by one year without election. Since the last boundary changes in 2002, 50 councillors have been elected from 28 wards.

1998 City of Bradford Metropolitan District Council election

The City of Bradford Metropolitan District Council elections were held on Thursday, 7 May 1998, with one third of the council up for election. Since the previous election there had been a number of by-elections resulting in two Labour defenses and a Conservative gain in Heaton, due to be defended at this election. Labour retained control of the council.

Brooklands, (Manchester ward) Electoral ward in England

Brooklands is an area and electoral ward of Manchester, England. It is represented in Westminster by Mike Kane MP for Wythenshawe and Sale East. The 2011 Census recorded a population of 14,362.

One third of Runnymede Borough Council in Surrey, England is elected each year, followed by one year where there is an election to Surrey County Council instead. The council is divided up into 14 wards, electing 42 councillors, since the last boundary changes in 2000.

Elections to Maidstone Borough Council in Kent, United Kingdom are held each year to elect one-third of its members, followed by one year without election. Since the last boundary changes in 2002, 55 councillors have been elected from 26 wards.

One third of Hart District Council in Hampshire, England is elected each year, followed by one year without election. Since the last boundary changes in 2002, 35 councillors have been elected from 18 wards.

2003 City of Bradford Metropolitan District Council election

Elections to City of Bradford Metropolitan District Council were held on 1 May 2003. Before the election, Wibsey Labour councillor, Keith Thomson, had defected to Independent. One third of the council was up for election, and it remained under no overall control.

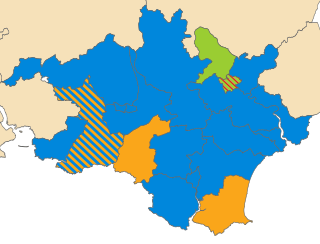
The 2015 Torridge District Council election took place on 7 May 2015 to elect members of Torridge District Council in England. This was on the same day as other local elections and the 2015 UK General Election hence turnout was much higher than usual Local Elections.

1995 City of Bradford Metropolitan District Council election

The City of Bradford Metropolitan District Council elections were held on Thursday, 4 May 1995, with one third of the council up for election. Prior to the election there had been a by-election in Tong after incumbent Labour councillor, Gerry Sutcliffe, was selected as their candidate for the Bradford South by-election, which Labour successfully defended. Labour retained control of the council.

2000 City of Bradford Metropolitan District Council election

The City of Bradford Metropolitan District Council elections were held on Thursday, 4 May 2000, with one third of the council up for election. Labour lost control of the council to no overall control.

2016 City of Bradford Metropolitan District Council election

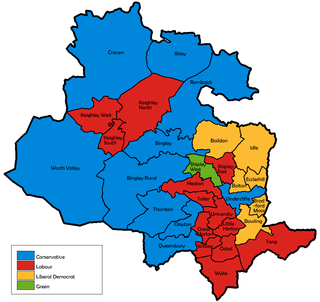
The 2016 City of Bradford Metropolitan District Council election took place on 5 May 2016. This was on the same day as other local elections. One councillor was elected in each ward for a four-year term. Each ward is represented by three councillors, the election of which is staggered, so only one third of the councillors were elected in this election.

References

  1. 1 2 3 4 5 6 7 8 9 10 11 12 13 14 15 16 17 18 19 20 21 22 23 24 25 26 27 28 29 30 31 32 "District results: Bradford". The Yorkshire Post . 3 May 1996.
  2. "Vote 2012: Bradford". BBC News Online . Retrieved 2015-08-01.
  3. 1 2 3 "Local Authority Byelection Results". gwydir.demon.co.uk. Retrieved 2015-08-10.
  4. "Councillors: Heaton Ward". bradford.gov.uk. Archived from the original on 1998-01-31. Retrieved 2015-08-10.
  5. "Councillors: Shipley West Ward". bradford.gov.uk. Archived from the original on 1998-01-31. Retrieved 2015-08-10.
  6. "Councillors: Baildon Ward". bradford.gov.uk. Archived from the original on 1998-01-31. Retrieved 2015-08-10.