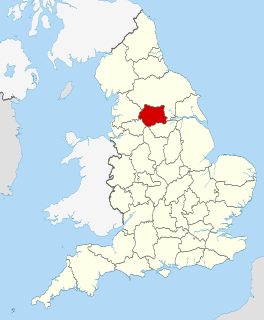
The 2002 Wakefield Metropolitan District Council election took place on 2 May 2002 to elect members of Wakefield Metropolitan District Council in West Yorkshire, England. One third of the council was up for election and the Labour party kept overall control of the council. [1]
West Yorkshire is a metropolitan county in England. It is an inland and in relative terms upland county having eastward-draining valleys while taking in moors of the Pennines and has a population of 2.2 million. West Yorkshire came into existence as a metropolitan county in 1974 after the passage of the Local Government Act 1972.
England is a country that is part of the United Kingdom. It shares land borders with Wales to the west and Scotland to the north-northwest. The Irish Sea lies west of England and the Celtic Sea lies to the southwest. England is separated from continental Europe by the North Sea to the east and the English Channel to the south. The country covers five-eighths of the island of Great Britain, which lies in the North Atlantic, and includes over 100 smaller islands, such as the Isles of Scilly and the Isle of Wight.
The Labour Party is a centre-left political party in the United Kingdom which has been described as an alliance of social democrats, democratic socialists and trade unionists. The party's platform emphasises greater state intervention, social justice and strengthening workers' rights.
After the election, the composition of the council was
The Conservative Party, officially the Conservative and Unionist Party, is a centre-right political party in the United Kingdom. The governing party since 2010, it is the largest in the House of Commons, with 313 Members of Parliament, and also has 249 members of the House of Lords, 18 members of the European Parliament, 31 Members of the Scottish Parliament, 12 members of the Welsh Assembly, eight members of the London Assembly and 8,916 local councillors.
The Liberal Democrats are a liberal political party in the United Kingdom. They have 11 Members of Parliament in the House of Commons, 96 members of the House of Lords, one member of the European Parliament, five Members of the Scottish Parliament and one member in the Welsh Assembly and London Assembly. At the height of its influence, the party formed a coalition government with the Conservative Party from 2010 to 2015 with its leader Nick Clegg serving as Deputy Prime Minister. It is currently led by Sir Vince Cable.
Before the election the council had 55 Labour, 4 Conservative, 3 Independent and 1 Liberal Democrat members. [3] Each of the Labour and Conservative parties stood candidates in all 21 wards, along with 11 Liberal Democrats and 15 other candidates from various parties. [3] Labour were defending 20 seats in the election, with two seats being contested in Pontefract South due to the resignation of a councillor, [4] while the other 2 seats were held by independents. [3] One of the 2 independents who was defending his seat in Wakefield South was Norman Hazell, a former leader of the Conservatives in Wakefield, who had defected from the party in 2001. [3]
Pontefract is a historic market town in West Yorkshire, England, near the A1 and the M62 motorway. Historically part of the West Riding of Yorkshire, it is one of the five towns in the metropolitan borough of the City of Wakefield and has a population of 28,250, increasing to 30,881 at the 2011 Census. Pontefract's motto is Post mortem patris pro filio, Latin for "After the death of the father, support the son", a reference to the English Civil War Royalist sympathies.
A Councillor is a member of a local government council.
During the campaign an investigation was started by West Yorkshire Police after allegations of fraud in South Kirkby ward. [5] [6] Here over a quarter of the 900 postal vote applications had been found to be invalid. [5] [6]
West Yorkshire Police is the territorial police force responsible for policing West Yorkshire in England. It is the fourth largest force in England and Wales by number of officers, with 5,671 officers.
South Kirkby and Moorthorpe is a civil parish in the City of Wakefield in West Yorkshire, England which is governed locally by South Kirkby and Moorthorpe Town Council. The parish and town council are made up of the town of South Kirkby and the village of Moorthorpe. As of 2009 the parish had a population of 10,979, increasing to 11,105 at the 2011 Census.
Postal voting is voting in an election whereby ballot papers are distributed to electors or returned by post, in contrast to electors voting in person at a polling station or electronically via an electronic voting system. Historically, postal votes must be distributed and placed in return mail before the scheduled election day, it is sometimes referred to as a form of early voting. It can also be used as an absentee ballot. However, in recent times the model in the US has morphed, in municipalities that use postal voting exclusively, to be one of ballots being mailed out to voters, but the return method taking on alternatives of return by mail or dropping off the ballot in person via secure drop boxes and/or voting centers.
The Labour party remained firmly in control of the council and were pleased with only losing 2 seats in the election. [2] The Conservatives gained Wakefield Rural, while the Liberal Democrats took Ossett. [2] Meanwhile, both independents held their seats, with Norman Hazell's defence of Wakefield South as an independent being seen as a surprise result. [2] Overall turnout in the election was 23.5%. [2]
Ossett is a market town in within the metropolitan district of the City of Wakefield, West Yorkshire, England. Historically part of the West Riding of Yorkshire, it is halfway between Dewsbury, to the west, and Wakefield, to the east. At the 2011 Census, the population was 21,231.
Voter turnout is the percentage of eligible voters who cast a ballot in an election. Eligibility varies by country, and the voting-eligible population should not be confused with the total adult population. Age and citizenship status are often among the criteria used to determine eligibility, but some countries further restrict eligibility based on sex, race, or religion.
Party | Seats | Gains | Losses | Net gain/loss | Seats % | Votes % | Votes | +/− | |
---|---|---|---|---|---|---|---|---|---|
Labour | 18 | 0 | 2 | -2 | 81.8 | 53.5 | 34,330 | +2.3% | |
Independent | 2 | 0 | 0 | 0 | 9.1 | 6.0 | 3,852 | +1.8% | |
Conservative | 1 | 1 | 0 | +1 | 4.5 | 24.7 | 15,817 | -7.3% | |
Liberal Democrat | 1 | 1 | 0 | +1 | 4.5 | 11.4 | 7,337 | +0.5% | |
Socialist Labour | 0 | 0 | 0 | 0 | 0 | 2.9 | 1,831 | +1.3% | |
Socialist Alternative | 0 | 0 | 0 | 0 | 0 | 0.6 | 386 | +0.6% | |
UKIP | 0 | 0 | 0 | 0 | 0 | 0.5 | 313 | +0.5% | |
Socialist Alliance | 0 | 0 | 0 | 0 | 0 | 0.4 | 285 | +0.4% | |
Party | Candidate | Votes | % | ± | |
---|---|---|---|---|---|
Labour | Stephen Groves | 1,404 | 75.6 | +17.2 | |
Conservative | Madge Richards | 267 | 14.4 | +6.3 | |
Socialist Labour | Trevor Holderson | 186 | 10.0 | +10.0 | |
Majority | 1,137 | 61.2 | +36.4 | ||
Turnout | 1,857 | 19.4 | -0.2 | ||
Labour hold | Swing | ||||
Party | Candidate | Votes | % | ± | |
---|---|---|---|---|---|
Labour | Mark Burns-Williamson | 1,864 | 82.1 | +5.6 | |
Conservative | Charles Scholes | 255 | 11.2 | -4.2 | |
Socialist Labour | Angela Herbert | 152 | 6.7 | -1.5 | |
Majority | 1,609 | 70.9 | +9.8 | ||
Turnout | 2,271 | 21.2 | +3.8 | ||
Labour hold | Swing | ||||
Party | Candidate | Votes | % | ± | |
---|---|---|---|---|---|
Labour | Colin Churm | 1,812 | 82.9 | +5.6 | |
Conservative | Jean Molloy | 237 | 10.8 | -4.7 | |
Socialist Labour | Mary Appleyard | 137 | 6.3 | -0.9 | |
Majority | 1,575 | 72.1 | +10.3 | ||
Turnout | 2,186 | 22.1 | +2.0 | ||
Labour hold | Swing | ||||
Party | Candidate | Votes | % | ± | |
---|---|---|---|---|---|
Labour | Paul Beckett | 1,564 | 51.2 | +2.6 | |
Liberal Democrat | James McDougall | 669 | 21.9 | -1.1 | |
Conservative | Catherine Campbell-Reitzik | 554 | 18.1 | -10.3 | |
UKIP | Howard Burden | 194 | 6.3 | +6.3 | |
Socialist Labour | David Bruce | 76 | 2.5 | +2.5 | |
Majority | 895 | 29.3 | +9.1 | ||
Turnout | 3,057 | 25.4 | +4.4 | ||
Labour hold | Swing | ||||
Party | Candidate | Votes | % | ± | |
---|---|---|---|---|---|
Labour | Robin Tuffs | 1,867 | 83.0 | +28.6 | |
Conservative | Elizabeth Hick | 383 | 17.0 | +4.0 | |
Majority | 1,484 | 66.0 | +44.2 | ||
Turnout | 2,250 | 20.4 | -2.4 | ||
Labour hold | Swing | ||||
Party | Candidate | Votes | % | ± | |
---|---|---|---|---|---|
Labour | Wayne Jenkins | 1,629 | 72.5 | -2.3 | |
Conservative | Eamonn Mullins | 372 | 16.5 | -8.7 | |
Socialist Labour | Maurice Kent | 247 | 11.0 | +11.0 | |
Majority | 1,257 | 56.0 | +6.4 | ||
Turnout | 2,248 | 20.8 | +2.7 | ||
Labour hold | Swing | ||||
Party | Candidate | Votes | % | ± | |
---|---|---|---|---|---|
Labour | Brian Holmes | 1,408 | 43.2 | +10.8 | |
Conservative | Caroline Sheen | 1,225 | 37.6 | -7.4 | |
Liberal Democrat | Mark Goodair | 567 | 17.4 | -5.2 | |
Socialist Labour | Karen Bruce | 60 | 1.8 | +1.8 | |
Majority | 183 | 5.6 | |||
Turnout | 3,260 | 27.0 | +0.5 | ||
Labour hold | Swing | ||||
Party | Candidate | Votes | % | ± | |
---|---|---|---|---|---|
Labour | Graham Stokes | 1,667 | 75.9 | +4.4 | |
Conservative | David Howarth | 530 | 24.1 | -4.4 | |
Majority | 1,137 | 51.8 | +8.8 | ||
Turnout | 2,197 | 20.7 | +2.9 | ||
Labour hold | Swing | ||||
Party | Candidate | Votes | % | ± | |
---|---|---|---|---|---|
Labour | Peter Loosemore | 1,306 | 49.8 | -11.5 | |
Independent | Graeme Milner | 665 | 25.3 | +25.3 | |
Conservative | Allan Couch | 346 | 13.2 | -6.5 | |
Socialist Labour | Mick Appleyard | 308 | 11.7 | -7.3 | |
Majority | 641 | 24.5 | -17.1 | ||
Turnout | 2,625 | 20.6 | +1.5 | ||
Labour hold | Swing | ||||
Party | Candidate | Votes | % | ± | |
---|---|---|---|---|---|
Liberal Democrat | Peter Walker | 2,138 | 54.9 | +18.6 | |
Labour | Maureen Cummings | 1,235 | 31.7 | -3.5 | |
Conservative | Terence Brown | 518 | 13.3 | -15.2 | |
Majority | 903 | 23.2 | +22.1 | ||
Turnout | 3,891 | 31.1 | +6.0 | ||
Liberal Democrat gain from Labour | Swing | ||||
Party | Candidate | Votes | % | ± | |
---|---|---|---|---|---|
Labour | Jack Kershaw | 1,875 | 68.2 | -2.9 | |
Conservative | Richard Molloy | 638 | 23.2 | -5.7 | |
Socialist Alternative | John Gill | 134 | 4.9 | +4.9 | |
Socialist Labour | Zane Carpenter | 103 | 3.7 | +3.7 | |
Majority | 1,237 | 45.0 | +2.8 | ||
Turnout | 2,750 | 21.0 | +4.2 | ||
Labour hold | Swing | ||||
Party | Candidate | Votes | % | ± | |
---|---|---|---|---|---|
Labour | Trevor Izon | 1,581 | |||
Labour | Martyn Ward | 1,317 | |||
Conservative | Ian Bloomer | 1,250 | |||
Conservative | Philip Booth | 1,243 | |||
Socialist Alliance | Carol Ives | 285 | |||
Turnout | 5,676 | 28.4 | +4.2 | ||
Labour hold | Swing | ||||
Party | Candidate | Votes | % | ± | |
---|---|---|---|---|---|
Labour | John Devine | 1,655 | 68.1 | -2.6 | |
Conservative | Ian Hall | 438 | 18.0 | -11.3 | |
Liberal Democrat | Mary Neale | 339 | 13.9 | +13.9 | |
Majority | 1,217 | 50.1 | +8.7 | ||
Turnout | 2,432 | 21.2 | +4.9 | ||
Labour hold | Swing | ||||
Party | Candidate | Votes | % | ± | |
---|---|---|---|---|---|
Independent | Harold Mills | 1,288 | 49.9 | +49.9 | |
Labour | Malcolm Evans | 1,167 | 45.2 | -17.9 | |
Conservative | Michael Ledgard | 128 | 5.0 | -5.9 | |
Majority | 121 | 4.7 | |||
Turnout | 2,583 | 24.1 | +4.9 | ||
Independent hold | Swing | ||||
Party | Candidate | Votes | % | ± | |
---|---|---|---|---|---|
Labour | David Atkinson | 1,670 | 51.9 | +3.3 | |
Conservative | Norma Crossley | 750 | 23.3 | -4.8 | |
Liberal Democrat | Michael Burch | 715 | 22.2 | -1.2 | |
Socialist Labour | Kathryn Summerscales | 83 | 2.6 | +2.6 | |
Majority | 920 | 28.6 | +8.1 | ||
Turnout | 3,218 | 23.1 | +3.0 | ||
Labour hold | Swing | ||||
Party | Candidate | Votes | % | ± | |
---|---|---|---|---|---|
Labour | Rosaline Lund | 1,655 | 46.0 | +0.9 | |
Conservative | James Dick | 1,131 | 31.4 | -5.7 | |
Liberal Democrat | Margaret Dodd | 813 | 22.6 | +4.8 | |
Majority | 524 | 14.6 | +6.6 | ||
Turnout | 3,599 | 24.0 | +2.6 | ||
Labour hold | Swing | ||||
Party | Candidate | Votes | % | ± | |
---|---|---|---|---|---|
Labour | Antony Richardson | 1,758 | 48.9 | +6.7 | |
Conservative | Jane Brown | 1,396 | 38.9 | -3.5 | |
Liberal Democrat | Susan Morgan | 376 | 10.5 | -0.4 | |
Socialist Labour | Paul Turek | 62 | 1.7 | -2.8 | |
Majority | 362 | 10.0 | |||
Turnout | 3,592 | 38.5 | +14.3 | ||
Labour hold | Swing | ||||
Party | Candidate | Votes | % | ± | |
---|---|---|---|---|---|
Labour | Olivia Rowley | 1,533 | 45.4 | -8.9 | |
Conservative | John Berry | 552 | 16.4 | -9.5 | |
Socialist Labour | Abdul Aziz | 417 | 12.4 | +12.4 | |
Independent | Georgina Fenton | 324 | 9.6 | +9.6 | |
Liberal Democrat | Alan Dale | 298 | 8.8 | -3.1 | |
Socialist Alternative | Michael Griffiths | 252 | 7.5 | +7.5 | |
Majority | 981 | 29.0 | +0.6 | ||
Turnout | 3,376 | 26.6 | +3.9 | ||
Labour hold | Swing | ||||
Party | Candidate | Votes | % | ± | |
---|---|---|---|---|---|
Labour | Keith Rhodes | 1,562 | 55.8 | +3.4 | |
Conservative | Michael Mitchell | 674 | 24.1 | -8.8 | |
Liberal Democrat | Douglas Dale | 442 | 15.8 | +1.1 | |
UKIP | Keith Wells | 119 | 4.3 | +4.3 | |
Majority | 888 | 31.7 | +12.2 | ||
Turnout | 2,797 | 24.8 | +3.4 | ||
Labour hold | Swing | ||||
Party | Candidate | Votes | % | ± | |
---|---|---|---|---|---|
Conservative | Paul Harvey | 1,566 | 43.6 | -8.1 | |
Labour | John Newsome | 1,536 | 42.8 | +6.3 | |
Liberal Democrat | David Neale | 486 | 13.5 | +1.7 | |
Majority | 30 | 0.8 | -14.4 | ||
Turnout | 3,588 | 27.9 | +3.3 | ||
Conservative gain from Labour | Swing | ||||
Party | Candidate | Votes | % | ± | |
---|---|---|---|---|---|
Independent | Norman Hazell | 1,575 | 33.5 | +32.3 | |
Conservative | Christian L'Anson | 1,364 | 29.0 | -36.2 | |
Labour | Hazel Chowcat | 1,265 | 26.9 | +3.7 | |
Liberal Democrat | Stephen Nuthall | 494 | 10.5 | +0.1 | |
Majority | 211 | 4.5 | |||
Turnout | 4,698 | 38.0 | +5.6 | ||
Independent hold | Swing | ||||
The 1999 Craven District Council election took place on 6 May 1999 to elect members of Craven District Council in North Yorkshire, England. One third of the council was up for election and the Conservative party gained overall control of the council from no overall control.
The 2004 Craven District Council election took place on 10 June 2004 to elect members of Craven District Council in North Yorkshire, England. One third of the council was up for election and the council stayed under no overall control.
The 2007 Craven District Council election took place on 3 May 2007 to elect members of Craven District Council in North Yorkshire, England. One third of the council was up for election and the council stayed under no overall control.
The 2003 Harlow District Council election took place on 1 May 2003 to elect members of Harlow District Council in Essex, England. One third of the council was up for election and the council stayed under no overall control.
The 2004 Hull City Council election took place on 10 June 2004 to elect members of Hull City Council in England. One third of the council was up for election and the council stayed under no overall control.
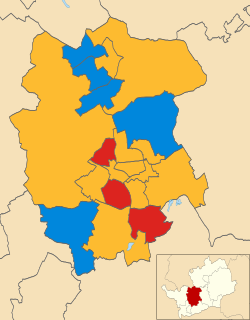
The 2003 St Albans City and District Council election took place on 1 May 2003 to elect members of St Albans District Council in Hertfordshire, England. One third of the council was up for election and the council stayed under no overall control.
The 2003 Wakefield Metropolitan District Council election took place on 1 May 2003 to elect members of Wakefield Metropolitan District Council in West Yorkshire, England. One third of the council was up for election and the Labour party kept overall control of the council.
The 2004 Wakefield Metropolitan District Council election took place on 10 June 2004 to elect members of Wakefield Metropolitan District Council in West Yorkshire, England. The whole council was up for election with boundary changes since the last election in 2003. The Labour party stayed in overall control of the council.
The 2006 Wakefield Metropolitan District Council election took place on 4 May 2006 to elect members of Wakefield Metropolitan District Council in West Yorkshire, England. One third of the council was up for election and the Labour party kept overall control of the council.
The 2007 Wakefield Metropolitan District Council election took place on 3 May 2007 to elect members of Wakefield Metropolitan District Council in West Yorkshire, England. One third of the council was up for election and the Labour party kept overall control of the council.
The 2008 Wakefield Metropolitan District Council election took place on 1 May 2008 to elect members of Wakefield Metropolitan District Council in West Yorkshire, England. One third of the council was up for election and the Labour party stayed in overall control of the council.
The Leeds City Council election took place on 2 May 2002 to elect members of City of Leeds Metropolitan Borough Council in West Yorkshire, England. Prior to the election, there had been several by-elections held with no change to the council composition. One third of the council was up for election and the Labour party stayed in overall control of the council.
The 2003 South Tyneside Metropolitan Borough Council election took place on 1 May 2003 to elect members of South Tyneside Metropolitan Borough Council in Tyne and Wear, England. One third of the council was up for election and the Labour party kept overall control of the council.
The 2004 South Tyneside Metropolitan Borough Council election took place on 10 June 2004 to elect members of South Tyneside Metropolitan Borough Council in Tyne and Wear, England. The whole council was up for election with boundary changes since the last election in 2003 reducing the number of seats by 6. The Labour party stayed in overall control of the council.
The Leeds City Council election took place on 1 May 2003 to elect members of City of Leeds Metropolitan Borough Council in West Yorkshire, England. One third of the council was up for election and the Labour party stayed in overall control of the council.
The 2004 Fareham Council election took place on 10 June 2004 to elect members of Fareham Borough Council in Hampshire, England. Half of the council was up for election and the Conservative party stayed in overall control of the council.
The 2004 Harrogate Council election took place on 10 June 2004 to elect members of Harrogate Borough Council in North Yorkshire, England. One third of the council was up for election and the Conservative party stayed in overall control of the council.
The 2012 Doncaster Metropolitan Borough Council election took place on 3 May 2012 to elect one third of Doncaster Metropolitan Borough Council in South Yorkshire, England. This was on the same day as other United Kingdom local elections, 2012.
The 2014 Craven District Council election took place on 22 May 2014 to elect members of Craven District Council in North Yorkshire, England. One third of the council was up for election and the Conservative party stayed in overall control of the council.
The 2018 Wakefield Metropolitan Borough Council election will take place on 3 May 2018 to elect members of Wakefield Metropolitan District Council in England. This will be on the same day as other local elections. The Labour Party and the Conservative Party are fielding a full slate of 21 candidates, as well as 12 Liberal Democrats, 6 Yorkshire Party candidates, 4 Green Party candidates, 3 UK Independence Party candidates, 1 Trade Unionist and Socialist Coalition candidate and 1 Democrats and Veteran's Party candidate.