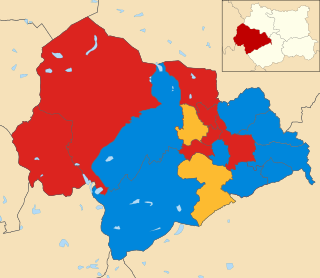
The 2012 Calderdale Metropolitan Borough Council election took place on 3 May 2012 to elect members of Calderdale Metropolitan Borough Council in West Yorkshire, England. [1] This was on the same day as other United Kingdom local elections, 2012. After the election the council continued to have no overall control and continue to be run by a coalition between the Labour Party and the Liberal Democrats.
Calderdale Metropolitan Borough Council is the local authority of the Metropolitan Borough of Calderdale in West Yorkshire, England. It is a metropolitan district council, one of five in West Yorkshire and one of 36 in the metropolitan counties of England, and provides the majority of local government services in Calderdale. Since 1 April 2014 it has been a constituent council of the West Yorkshire Combined Authority.
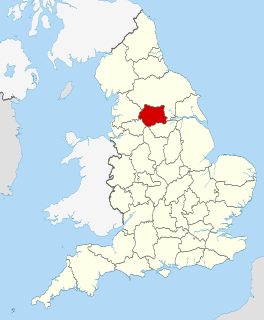
West Yorkshire is a metropolitan county in England. It is an inland and in relative terms upland county having eastward-draining valleys while taking in moors of the Pennines and has a population of 2.2 million. West Yorkshire came into existence as a metropolitan county in 1974 after the passage of the Local Government Act 1972.
England is a country that is part of the United Kingdom. It shares land borders with Wales to the west and Scotland to the north-northwest. The Irish Sea lies west of England and the Celtic Sea lies to the southwest. England is separated from continental Europe by the North Sea to the east and the English Channel to the south. The country covers five-eighths of the island of Great Britain, which lies in the North Atlantic, and includes over 100 smaller islands, such as the Isles of Scilly and the Isle of Wight.
The Warley Councillor Keith Hutson stepped down in 2012 due to health reasons. A by-election was held on 19 July 2012. The seat was held by the Liberal Democrats with James Baker winning the seat. [2]
The Liberal Democrats are a liberal political party in the United Kingdom. They presently have 11 Members of Parliament in the House of Commons, 96 members of the House of Lords, and one member of the European Parliament. They also have five Members of the Scottish Parliament and a member each in the Welsh Assembly and London Assembly. The party reached the height of its influence in the early 2010s, forming a junior partner in a coalition government from 2010 to 2015. It is presently led by Vince Cable.
In this year Councillor Nader Fekri for Calder ward defected to Labour from the Liberal Democrats in 2012 saying that he could no longer support the coalition in the national parliament with the Conservatives. [3]
The Labour Party is a centre-left political party in the United Kingdom which has been described as an alliance of social democrats, democratic socialists and trade unionists. The party's platform emphasises greater state intervention, social justice and strengthening workers' rights.
The Conservative Party, officially the Conservative and Unionist Party, is a centre-right political party in the United Kingdom. Presently led by Theresa May, it has been the governing party since 2010. It presently has 314 Members of Parliament in the House of Commons, 249 members of the House of Lords, and 18 members of the European Parliament. It also has 31 Members of the Scottish Parliament, 12 members of the Welsh Assembly, eight members of the London Assembly and 9,008 local councillors. One of the major parties of UK politics, it has formed the government on 45 occasions, more than any other party.
In April 2013 the coalition between Labour and the Liberal Democrats collapsed as Labour pulled out over disagreements over benefit cuts. [4] Labour continued to run the council as a minority administration. [5]
Prior to the election the composition of the council was:
13 | 21 | 13 | 1 | 3 |
Labour | Conservative | Lib Dem | ILD | Ind |
After the election the composition of the council was:
20 | 17 | 12 | 2 |
Labour | Conservative | Lib Dem | Ind |
Party | Previous council | New council | |||
---|---|---|---|---|---|
Labour | 13 | 20 | |||
Conservative | 21 | 17 | |||
Liberal Democrat | 13 | 12 | |||
Independent | 3 | 2 | |||
Independent Liberal Democrat | 1 | 0 | |||
Total | 51 | 51 |
Party | Candidate | Votes | % | ± | |
---|---|---|---|---|---|
Labour | Ann Martin | 1,329 | 47.1 | +25.1 | |
Conservative | Howard Blagbrough | 1,195 | 42.3 | +2.1 | |
Liberal Democrat | Jennie Rigg | 273 | 9.8 | −28.0 | |
Majority | 134 | 4.7 | |||
Turnout | 2,822 | 32.7 | −6.4 | ||
Labour gain from Conservative | Swing | ||||
The incumbent was Howard Blagbrough for the Conservative Party.
Party | Candidate | Votes | % | ± | |
---|---|---|---|---|---|
Liberal Democrat | Janet Battye | 1,599 | 39.1 | +7.0 | |
Labour | Susan Press | 1,454 | 35.5 | +4.8 | |
Green | Kate Sweeny | 541 | 13.2 | −10.9 | |
Conservative | Gail Lund | 477 | 11.7 | −1.4 | |
Majority | 145 | 3.5 | |||
Turnout | 4,093 | 44.9 | +3.4 | ||
Liberal Democrat hold | Swing | ||||
The incumbent was Janet Battye for the Liberal Democrats.
Party | Candidate | Votes | % | ± | |
---|---|---|---|---|---|
Liberal Democrat | Pat Allen | 950 | 36.4 | −7.6 | |
Labour | Angi Gallagher | 829 | 31.8 | +20.4 | |
Conservative | Mike Payne | 595 | 22.8 | −6.4 | |
Green | Susan Thomas | 225 | 8.6 | +3.1 | |
Majority | 121 | 4.6 | |||
Turnout | 2,607 | 30.9 | −2.5 | ||
Liberal Democrat hold | Swing | ||||
The incumbent was Pat Allen for the Liberal Democrats.
Party | Candidate | Votes | % | ± | |
---|---|---|---|---|---|
Liberal Democrat | Malcolm James | 1,121 | 41.4 | −4.3 | |
Conservative | Keith Watson | 751 | 27.8 | −3.4 | |
Labour | Jim Gallagher | 527 | 19.5 | +11.3 | |
Green | Mark Mullany | 297 | 11.0 | +5.4 | |
Majority | 370 | 13.7 | |||
Turnout | 2,705 | 31.9 | −4.79 | ||
Liberal Democrat gain from Conservative | Swing | ||||
The incumbent was Keith Watson for the Conservative Party.
Party | Candidate | Votes | % | ± | |
---|---|---|---|---|---|
Conservative | Graham Hall | 1,322 | 42.8 | −25.7 | |
Independent | Chris O'Connor | 930 | 30.1 | N/A | |
Labour | Anthony Rutherford | 722 | 25.4 | +9.8 | |
Liberal Democrat | Mat Bowles | 106 | 3.4 | −14.5 | |
Majority | 392 | 12.7 | |||
Turnout | 3,090 | 35.3 | −3.1 | ||
Conservative hold | Swing | ||||
The incumbent was Graham Hall for the Conservative Party.
Party | Candidate | Votes | % | ± | |
---|---|---|---|---|---|
Labour | Lisa Lambert | 1,224 | 40.8 | +11.4 | |
Independent | Tom Bates | 968 | 32.3 | −6.1 | |
Conservative | Andrew Tagg | 673 | 22.4 | −0.6 | |
Independent | Sean Loftus | 76 | 2.5 | −1.1 | |
Liberal Democrat | Glen Mattock | 50 | 1.7 | −3.9 | |
Majority | 256 | 8.5 | |||
Turnout | 2,998 | 32.7 | −4.4 | ||
Labour gain from Independent | Swing | ||||
The incumbent was Tom Bates, an independent.
Party | Candidate | Votes | % | ± | |
---|---|---|---|---|---|
Labour | Simon Young | 1,263 | 41.3 | +25.0 | |
Liberal Democrat | Christine Bampton-Smith | 948 | 31.0 | −10.4 | |
Conservative | Gillian Smith-Moorhouse | 823 | 26.9 | −5.4 | |
Majority | 315 | 10.3 | |||
Turnout | 3,060 | 37.9 | −3.1 | ||
Labour gain from Liberal Democrat | Swing | ||||
The incumbent was Christine Bampton-Smith for the Liberal Democrats.
Party | Candidate | Votes | % | ± | |
---|---|---|---|---|---|
Conservative | Peter Caffrey | 1,705 | 56.6 | +7.6 | |
Labour | Gary Walsh | 1,094 | 36.3 | +21.6 | |
Liberal Democrat | Kenneth Albret | 181 | 6.0 | −0.7 | |
Majority | 611 | 20.3 | |||
Turnout | 3,014 | 33.1 | −7.0 | ||
Conservative hold | Swing | ||||
The incumbent was Graham Hall for the Conservative Party.
Party | Candidate | Votes | % | ± | |
---|---|---|---|---|---|
Labour | Anne Collins | 1,255 | 68.1 | +23.3 | |
Conservative | Christopher Blakey | 367 | 19.9 | −5.4 | |
Liberal Democrat | John Reynolds | 186 | 10.1 | −3.0 | |
Majority | 888 | 43.2 | |||
Turnout | 1,843 | 21.8 | −3.6 | ||
Labour hold | Swing | ||||
The incumbent was Danielle Coombs for the Labour Party.
Party | Candidate | Votes | % | ± | |
---|---|---|---|---|---|
Labour | Jenny Lynn | 2,657 | 63.6 | +25.9 | |
Conservative | Shakir Saghir | 838 | 20.1 | +9.1 | |
Liberal Democrat | Mohammad Ilyas | 651 | 15.6 | −25.7 | |
Majority | 1,819 | 43.6 | |||
Turnout | 4,176 | 46.1 | −4.8 | ||
Labour gain from Liberal Democrat | Swing | ||||
The incumbent was Mohammad Ilyas for the Liberal Democrats.
Party | Candidate | Votes | % | ± | |
---|---|---|---|---|---|
Conservative | Ann McAllister | 1,311 | 49.8 | +0.8 | |
Labour | Peter Judge | 1,046 | 39.8 | +18.6 | |
TUSC | Rob Bailey | 258 | 9.8 | N/A | |
Majority | 265 | 10.1 | |||
Turnout | 2,631 | 30.6 | −6.5 | ||
Conservative hold | Swing | ||||
The incumbent was Ann McAllister for the Conservative Party.
Party | Candidate | Votes | % | ± | |
---|---|---|---|---|---|
Conservative | Geraldine Carter | 1,253 | 44.9 | −9.3 | |
Labour | Judy Gannon | 944 | 33.8 | +17.5 | |
Green | Freda Davis | 349 | 12.5 | N/A | |
Liberal Democrat | Rosemary Tatchell | 229 | 8.2 | −21.3 | |
Majority | 309 | 11.1 | |||
Turnout | 2,790 | 31.6 | −4.4 | ||
Conservative hold | Swing | ||||
The incumbent was Geraldine Carter for the Conservative Party.
Party | Candidate | Votes | % | ± | |
---|---|---|---|---|---|
Conservative | John Hardy | 1,496 | 41.0 | −13.0 | |
Liberal Democrat | Stephen Gow | 1,104 | 30.3 | −2.8 | |
Labour | Alistair Millington | 778 | 21.3 | +13.5 | |
Green | Charles Gate | 251 | 6.9 | +1.8 | |
Majority | 392 | 10.7 | |||
Turnout | 3,647 | 38.4 | −3.8 | ||
Conservative hold | Swing | ||||
The incumbent was John Hardy for the Conservative Party.
Party | Candidate | Votes | % | ± | |
---|---|---|---|---|---|
Labour | Adam Wilkinson | 1,422 | 52.5 | +23.1 | |
Conservative | Andrew Feather | 915 | 38.8 | −8.8 | |
Liberal Democrat | Elizabeth Ward | 330 | 12.2 | −0.2 | |
Majority | 507 | 18.7 | |||
Turnout | 2,709 | 32.0 | −3.7 | ||
Labour gain from Conservative | Swing | ||||
The incumbent was Amanda Byrne for the Conservative Party.
Party | Candidate | Votes | % | ± | |
---|---|---|---|---|---|
Labour | Steve Sweeney | 1,072 | 35.2 | +8.7 | |
Liberal Democrat | Olwen Jennings | 874 | 28.7 | +0.4 | |
Conservative | Ian Cooper | 583 | 19.1 | −13.4 | |
BPP | David Jones | 257 | 8.4 | N/A | |
Green | John Nesbitt | 246 | 8.1 | N/A | |
Majority | 198 | 6.5 | |||
Turnout | 3,045 | 34.3 | −3.7 | ||
Labour gain from Conservative | Swing | ||||
The incumbent was Ian Cooper for the Conservative Party.
Party | Candidate | Votes | % | ± | |
---|---|---|---|---|---|
Labour | Megan Swift | 1,389 | 63.0 | +23.5 | |
Conservative | Stephen Collins | 576 | 26.1 | +1.8 | |
Liberal Democrat | Ruth Coleman-Taylor | 206 | 9.3 | −0.9 | |
Majority | 2,205 | 25.2 | |||
Turnout | 2,205 | 25.2 | −5.9 | ||
Labour hold | Swing | ||||
The incumbent was Megan Swift for the Labour Party.
Party | Candidate | Votes | % | ± | |
---|---|---|---|---|---|
Labour | Martin Burton | 1,259 | 40.8 | +27.8 | |
Liberal Democrat | James Baker | 1,146 | 37.1 | −14.7 | |
Conservative | Christopher Pearson | 658 | 21.3 | −0.5 | |
Majority | 113 | 3.7 | |||
Turnout | 3,089 | 35.5 | −2.6 | ||
Labour gain from Independent Liberal Democrat | Swing | ||||
The incumbent was Robert Pearson, an independent Liberal Democrat.
Party | Candidate | Votes | % | ± | |
---|---|---|---|---|---|
Liberal Democrat | James Douglas Baker | 1,066 | 41.56 | ||
Labour | Jonathan Charles Timbers | 896 | 34.93 | ||
Conservative | Christopher James Pearson | 454 | 17.70 | ||
Green | Charles Gate | 140 | 5.46 | ||
Majority | 170 | 6.63 | |||
Turnout | 2,565 | 29.06 | |||
Liberal Democrat hold | Swing | ||||
Elections to Calderdale Metropolitan Borough Council were held on 1 May 2008. One third of the council was up for election and the council stayed under no overall control with a minority Conservative administration.
Elections to Calderdale Metropolitan Borough Council were held on 4 May 2006. One third of the council was up for election and the council stayed under no overall control with a minority Conservative administration.
Elections to Calderdale Metropolitan Borough Council were held on 4 May 2000. One third of the council was up for election and the Conservative party gained overall control of the council from no overall control. The total turnout of the election was 28.97%. The winning candidate in each ward is highlighted in bold.
Elections to Calderdale Metropolitan Borough Council were held on 2 May 2002. One third of the council was up for election and the Conservative party lost overall control of the council to no overall control. The total turnout of the election was 32.16%. The winning candidate in each ward is highlighted in bold.
Elections to Calderdale Metropolitan Borough Council were held on 1 May 2003. One third of the council was up for election and the council stayed under no overall control. The total turnout of the election was 34.44%. The winning candidate(s) in each ward is highlighted in bold.
Elections to Calderdale Metropolitan Borough Council were held on 3 May 2007 with the exception of the Warley ward which was postponed until 14 June 2007 due to the sudden death of one of the candidates. One third of the council was up for election and the council stayed under no overall control with a minority Conservative administration. The total turnout of the election was 38.01%. The winning candidate in each ward is highlighted in bold.
Elections to Calderdale Metropolitan Borough Council took place on Thursday 5 May 2011.
The 2010 Calderdale Metropolitan Borough Council election took place on 6 May 2010 to elect members of Calderdale Metropolitan Borough Council in England. This was on the same day as other local elections and a general election. One councillor was elected in each ward for a four-year term so the councillors elected in 2010 last stood for election in 2006. Each ward is represented by three councillors, the election of which is staggered, so only one third of the councillors was elected in this election. After the election the council stayed in no overall control but the Conservative minority administration was replaced with a coalition between Labour and the Liberal Democrats.
The 2007 Redcar and Cleveland Borough Council election took place on 3 May 2007 to elect members of Redcar and Cleveland Unitary Council in England. The whole council was up for election and the council stayed under no overall control.
The 2011 Wealden District Council election took place on 5 May 2011 to elect members of Wealden District Council in East Sussex, England. The whole council was up for election and the Conservative party stayed in overall control of the council.
Elections to East Lothian Council were held on 3 May 2012, on the same day as the other Scottish local government elections. The election used the 7 wards created as a result of the Local Governance (Scotland) Act 2004, with each ward electing three or four councillors using the single transferable vote system a form of proportional representation, with 23 councillors elected.
The 2014 Calderdale Metropolitan Borough Council election took place on 22 May 2014 to elect members of Calderdale Metropolitan Borough Council in England. This was on the same day as local elections across the United Kingdom and a European election. One councillor was elected in each of the 17 wards for a four-year term. There are three councillors representing each ward elected on a staggered basis so one third of the councillor seats were up for re-election. The seats had previously been contested in 2010 which was held in conjunction with a general election. The turnout was significantly lower in 2014 than in 2010 which is not unusual when comparing local elections that coincide with general elections to ones that do not. Prior to the election Labour was the largest party in the council with 21 out of 51 seats, 5 seats short of an overall majority. After the election there was no overall control of the council. Labour had 25 seats, only one short of a majority and so Labour continued to operate a minority administration.
The 2012 Pendle Borough Council election took place on 3 May 2012 to elect members of Pendle Borough Council in Lancashire, England. One third of the council was up for election and the council stayed under no overall control.
The 2006 Brent London Borough Council election took place on 4 May 2006 to elect members of Brent London Borough Council in London, England. The whole council was up for election and the Labour party lost overall control of the council to no overall control.
The 2014 Brent London Borough Council election took place on 22 May 2014 to elect members of Brent London Borough Council in London, England. The whole council was up for election and the Labour Party stayed in overall control of the council.
The 2012 St Helens Metropolitan Borough Council election took place on 3 May 2012 to elect members of St Helens Metropolitan Borough Council in Merseyside, England. One third of the council was up for election and the Labour party stayed in overall control of the council.
The 2015 Calderdale Metropolitan Borough Council election took place on 7 May 2015 to elect members of Calderdale in England. This was on the same day as other local elections and a general election. One councillor was elected in each ward for a four-year term so the councillors elected in 2015 last stood for election in 2011. Each ward is represented by three councillors, the election of which is staggered, so only one third of the councillors were elected in this election. Before the election there was no overall control with a minority Labour administration which was over-ruled at a Budget vote by a coalition of Conservatives & Liberal Democrats leading to a Conservative minority administration. After the election there was still no overall control & a Labour minority administration was formed again.
The 2016 Calderdale Metropolitan Borough Council election took place on 5 May 2016 to elect members of Calderdale Metropolitan Borough Council in England. This was on the same day as other local elections. One councillor was elected in each ward for a four-year term so the councillors elected in 2016 last stood for election in 2012. Each ward is represented by three councillors, the election of which is staggered, so only one third of the councillors was elected in this election. Before the election there was no overall control with a minority Labour administration. After the election there was still no overall control so the minority Labour administration continued.
Skircoat is an electoral ward in Calderdale, West Yorkshire, England, and returns three members to sit on Calderdale Metropolitan Borough Council. The population at the 2011 Census was 12,712. It covers the area of Skircoat Green.
The 2018 Calderdale Metropolitan Borough Council election took place on 3 May 2018 to elect members of Calderdale Metropolitan Borough Council in England. This was on the same day as other local elections. One councillor was elected in each ward for a four-year term so the councillors elected in 2018 last stood for election in 2014. Each ward is represented by three councillors, the election of which is staggered, so only one third of the councillors were elected in this election. Before the election there was no overall control with a minority Labour administration. Following the election Labour, having gained one councillor, was still two councillors away from a majority so it remained no overall control.