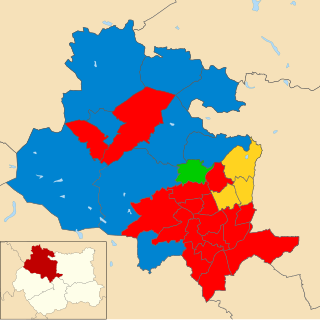
The City of Bradford Metropolitan District Council elections were held on Thursday, 4 May 1995, with one third of the council up for election. Prior to the election there had been a by-election in Tong after incumbent Labour councillor, Gerry Sutcliffe, was selected as their candidate for the Bradford South by-election, which Labour successfully defended. [1] Labour retained control of the council. [2] [3]
City of Bradford Metropolitan District Council is the local authority of the City of Bradford in West Yorkshire, England. It is a metropolitan district council, one of five in West Yorkshire and one of 36 in the metropolitan counties of England, and provides the majority of local government services in Bradford. Since 1 April 2014 it has been a constituent council of the West Yorkshire Combined Authority.
Tong is a ward within the City of Bradford Metropolitan District Council, West Yorkshire, England, named after Tong village which is its oldest settlement. The population at the 2011 Census was 20,608.
Gerard Sutcliffe is a British Labour Party politician who was Member of Parliament (MP) for Bradford South from 1994 to 2015. He was the Minister for Sport and Tourism in the Brown Government.
Party | Seats | Gains | Losses | Net gain/loss | Seats % | Votes % | Votes | +/− | |
---|---|---|---|---|---|---|---|---|---|
Labour | 25 | 9 | 1 | 83.3 | 54.4 | 69,751 | +3.8% | ||
Conservative | 4 | 1 | 9 | 13.3 | 28.5 | 36,565 | -0.9% | ||
Liberal Democrat | 1 | 1 | 1 | 3.3 | 13.8 | 17,626 | -3.2% | ||
Green | 0 | 0 | 0 | 0.0 | 1.9 | 2,484 | -0.5% | ||
Independent Labour | 0 | 0 | 0 | 0.0 | 0.8 | 1,002 | +0.8% | ||
Militant Labour | 0 | 0 | 0 | 0.0 | 0.2 | 312 | +0.2% | ||
Independent | 0 | 0 | 0 | 0.0 | 0.2 | 312 | -0.5% | ||
Natural Law | 0 | 0 | 0 | 0.0 | 0.0 | 46 | +0.0% | ||
This result had the following consequences for the total number of seats on the council after the elections:
Party | Previous council | New council | |||
---|---|---|---|---|---|
Labour | 50 | 58 | |||
Conservative | 36 | 28 | |||
Liberal Democrat | 4 | 4 | |||
Total | 90 | 90 | |||
Working majority | 10 | 26 |
Party | Candidate | Votes | % | ± | |
---|---|---|---|---|---|
Liberal Democrat | T. Browne | 2,320 | 43.5 | +7.1 | |
Conservative | M. Hope | 1,810 | 34.0 | -5.0 | |
Labour | H. Gundry | 973 | 18.3 | -1.2 | |
Green | C. Harris | 226 | 4.2 | -0.9 | |
Majority | 510 | 9.6 | +7.1 | ||
Turnout | 5,329 | ||||
Liberal Democrat gain from Conservative | Swing | +6.0 | |||
Party | Candidate | Votes | % | ± | |
---|---|---|---|---|---|
Labour | R. Flood | 2,520 | 56.5 | +10.1 | |
Conservative | M. Startin | 1,622 | 36.3 | -0.5 | |
Green | M. Thompson | 321 | 7.2 | +3.9 | |
Majority | 898 | 20.1 | +10.6 | ||
Turnout | 4,463 | ||||
Labour gain from Conservative | Swing | +5.3 | |||
Party | Candidate | Votes | % | ± | |
---|---|---|---|---|---|
Conservative | A. Cooke | 1,917 | 43. | -3.5 | |
Labour | M. Gregory | 1,902 | 43.2 | +8.8 | |
Liberal Democrat | J. Hutton | 581 | 13.2 | -5.3 | |
Majority | 15 | 0.3 | -12.4 | ||
Turnout | 4,400 | ||||
Conservative hold | Swing | -6.1 | |||
Party | Candidate | Votes | % | ± | |
---|---|---|---|---|---|
Labour | R. Kitson | 1,664 | 42.2 | +4.3 | |
Liberal Democrat | H. Middleton | 1,506 | 38.2 | -2.1 | |
Conservative | F. Lee | 769 | 19.5 | +0.5 | |
Majority | 158 | 4.0 | +1.6 | ||
Turnout | 3,939 | ||||
Labour gain from Conservative | Swing | +3.2 | |||
Party | Candidate | Votes | % | ± | |
---|---|---|---|---|---|
Labour | M. Ali | 1,932 | 51.4 | -17.0 | |
Independent Labour | D. Coughlin | 1,002 | 26.7 | +26.7 | |
Liberal Democrat | J. Harrington | 435 | 11.6 | -3.6 | |
Conservative | J. Ridyard | 282 | 7.5 | -1.2 | |
Green | K. Spencer | 104 | 2.8 | -0.6 | |
Majority | 930 | 24.8 | -28.4 | ||
Turnout | 3,755 | ||||
Labour hold | Swing | -21.8 | |||
Party | Candidate | Votes | % | ± | |
---|---|---|---|---|---|
Labour | R. Virdee | 1,826 | 44.3 | -22.6 | |
Conservative | S. Hussain | 1,775 | 43.1 | +21.7 | |
Liberal Democrat | J. Collins | 521 | 12.6 | +3.4 | |
Majority | 51 | 1.2 | -44.3 | ||
Turnout | 4,122 | ||||
Labour hold | Swing | -22.1 | |||
Party | Candidate | Votes | % | ± | |
---|---|---|---|---|---|
Labour | Y. Tough | 2,332 | 50.7 | -2.9 | |
Conservative | R. Farley | 1,825 | 39.7 | -6.7 | |
Liberal Democrat | L. McKeever | 301 | 6.5 | +6.5 | |
Green | J. Robinson | 140 | 3.0 | +3.0 | |
Majority | 507 | 11.0 | +3.7 | ||
Turnout | 4,598 | ||||
Labour gain from Conservative | Swing | +1.9 | |||
Party | Candidate | Votes | % | ± | |
---|---|---|---|---|---|
Labour | E. McNally | 2,030 | 45.0 | +9.6 | |
Conservative | D. Harrison | 1,908 | 42.3 | -1.3 | |
Liberal Democrat | G. Morgan | 568 | 12.6 | -8.3 | |
Majority | 122 | 2.7 | -5.5 | ||
Turnout | 4,506 | ||||
Labour gain from Conservative | Swing | +5.4 | |||
Party | Candidate | Votes | % | ± | |
---|---|---|---|---|---|
Labour | G. Midwood | 2,024 | 60.4 | +5.4 | |
Conservative | P. Kewitz | 876 | 26.2 | +1.6 | |
Liberal Democrat | M. Attenborough | 449 | 13.4 | -7.0 | |
Majority | 1,148 | 34.3 | +3.8 | ||
Turnout | 3,349 | ||||
Labour hold | Swing | +1.9 | |||
Party | Candidate | Votes | % | ± | |
---|---|---|---|---|---|
Labour | J. Godward | 2,560 | 63.9 | +3.3 | |
Conservative | V. Binney | 854 | 21.3 | -2.9 | |
Liberal Democrat | C. Wright | 468 | 11.7 | -1.2 | |
Green | P. Mills | 121 | 3.0 | +0.8 | |
Majority | 1,706 | 42.6 | +6.2 | ||
Turnout | 4,003 | ||||
Labour hold | Swing | +3.1 | |||
Party | Candidate | Votes | % | ± | |
---|---|---|---|---|---|
Labour | B. Maguire | 3,109 | 61.8 | +0.8 | |
Conservative | G. Gidley | 1,363 | 27.1 | -5.0 | |
Liberal Democrat | A. Cruden | 383 | 7.6 | +7.6 | |
Green | P. Braham | 174 | 3.5 | -3.4 | |
Majority | 1,746 | 34.7 | +5.9 | ||
Turnout | 5,029 | ||||
Labour gain from Conservative | Swing | +2.9 | |||
Party | Candidate | Votes | % | ± | |
---|---|---|---|---|---|
Labour | K. Baxter | 2,185 | 48.5 | +8.1 | |
Liberal Democrat | C. Beardmore | 1,700 | 37.7 | -8.2 | |
Conservative | A. White | 621 | 13.8 | +0.1 | |
Majority | 485 | 10.8 | +5.3 | ||
Turnout | 4,506 | ||||
Labour gain from Liberal Democrat | Swing | +8.1 | |||
Party | Candidate | Votes | % | ± | |
---|---|---|---|---|---|
Conservative | B. Smith | 2,585 | 55.8 | +7.7 | |
Labour | R. Fox | 2,050 | 44.2 | +26.9 | |
Majority | 535 | 11.5 | -19.3 | ||
Turnout | 4,635 | ||||
Conservative hold | Swing | -9.6 | |||
Party | Candidate | Votes | % | ± | |
---|---|---|---|---|---|
Labour | M. Slater | 2,995 | 63.0 | +8.9 | |
Conservative | J. Cope | 1,213 | 25.5 | -6.7 | |
Liberal Democrat | A. Carter | 548 | 11.5 | -2.3 | |
Majority | 1,782 | 37.5 | +15.6 | ||
Turnout | 4,756 | ||||
Labour hold | Swing | +7.8 | |||
Party | Candidate | Votes | % | ± | |
---|---|---|---|---|---|
Labour | B. Hancock | 2,625 | 74.5 | +5.5 | |
Liberal Democrat | J. Brooksbank | 484 | 13.7 | +0.5 | |
Conservative | R. Moorehouse | 414 | 11.7 | -6.0 | |
Majority | 2,141 | 60.8 | +9.6 | ||
Turnout | 3,523 | ||||
Labour hold | Swing | +2.5 | |||
Party | Candidate | Votes | % | ± | |
---|---|---|---|---|---|
Labour | B. Thorne | 2,770 | 65.5 | +8.5 | |
Conservative | G. Smith | 923 | 21.8 | -5.5 | |
Liberal Democrat | D. Burslam | 537 | 12.7 | -3.0 | |
Majority | 1,847 | 43.7 | +14.0 | ||
Turnout | 4,230 | ||||
Labour hold | Swing | +7.0 | |||
Party | Candidate | Votes | % | ± | |
---|---|---|---|---|---|
Labour | I. Greenwood | 2,443 | 71.4 | +9.2 | |
Conservative | T. Gledhill | 347 | 10.1 | -8.8 | |
Militant Labour | H. Oakes | 312 | 9.1 | +9.1 | |
Liberal Democrat | A. Griffiths | 251 | 7.3 | -7.1 | |
Green | C. Smith | 66 | 1.9 | -2.4 | |
Majority | 2,096 | 61.3 | +17.9 | ||
Turnout | 3,419 | ||||
Labour hold | Swing | +9.0 | |||
Party | Candidate | Votes | % | ± | |
---|---|---|---|---|---|
Labour | D. Green | 2,971 | 65.5 | +7.6 | |
Conservative | D. Manogue | 932 | 20.5 | -4.7 | |
Liberal Democrat | K. Hall | 518 | 11.4 | -2.0 | |
Green | P. Harrison | 116 | 2.6 | -0.9 | |
Majority | 2,039 | 44.9 | +12.2 | ||
Turnout | 4,537 | ||||
Labour hold | Swing | +6.1 | |||
Party | Candidate | Votes | % | ± | |
---|---|---|---|---|---|
Labour | J. Womersley | 3,011 | 65.2 | +9.9 | |
Conservative | M. Blundell | 1,078 | 23.3 | -4.8 | |
Liberal Democrat | J. Saul | 483 | 10.5 | -6.1 | |
Natural Law | G. Clark | 46 | 1.0 | +1.0 | |
Majority | 1,933 | 41.9 | +14.8 | ||
Turnout | 4,618 | ||||
Labour hold | Swing | +7.3 | |||
Party | Candidate | Votes | % | ± | |
---|---|---|---|---|---|
Conservative | R. Wightman | 2,114 | 43.7 | -1.4 | |
Labour | A. Niland | 1,505 | 31.1 | +3.7 | |
Liberal Democrat | A. Micklem | 1,216 | 25.1 | -2.3 | |
Majority | 609 | 12.6 | -5.1 | ||
Turnout | 4,835 | ||||
Conservative hold | Swing | -2.5 | |||
Party | Candidate | Votes | % | ± | |
---|---|---|---|---|---|
Labour | R. Redfern | 2,328 | 67.0 | +9.7 | |
Conservative | D. Servant | 525 | 15.1 | -1.9 | |
Liberal Democrat | J. Hall | 495 | 14.3 | -5.3 | |
Independent | M. Love | 124 | 3.6 | +3.6 | |
Majority | 1,803 | 51.9 | +14.0 | ||
Turnout | 3,472 | ||||
Labour hold | Swing | +5.3 | |||
Party | Candidate | Votes | % | ± | |
---|---|---|---|---|---|
Labour | J. Reilly | 2,721 | 50.5 | +1.5 | |
Conservative | J. Carroll | 1,830 | 34.0 | -0.7 | |
Green | D. Ford | 446 | 8.3 | +3.5 | |
Liberal Democrat | C. Svensgaard | 388 | 7.2 | -4.3 | |
Majority | 891 | 16.5 | +2.3 | ||
Turnout | 5,385 | ||||
Labour gain from Conservative | Swing | +1.1 | |||
Party | Candidate | Votes | % | ± | |
---|---|---|---|---|---|
Labour | P. Longthorn | 2,002 | 51.7 | +5.2 | |
Conservative | J. Buffham | 1,344 | 34.7 | -2.9 | |
Liberal Democrat | H. Wright | 409 | 10.6 | -2.2 | |
Green | M. Rawnsley | 116 | 3.0 | -0.2 | |
Majority | 658 | 17.0 | +8.1 | ||
Turnout | 3,871 | ||||
Labour gain from Conservative | Swing | +4.0 | |||
Party | Candidate | Votes | % | ± | |
---|---|---|---|---|---|
Conservative | A. Hussain | 2,618 | 46.3 | +11.3 | |
Labour | S. Hussain | 2,464 | 43.6 | -5.9 | |
Liberal Democrat | S. Devonshire | 448 | 7.9 | -4.2 | |
Green | N. Taimuri | 123 | 2.2 | -1.2 | |
Majority | 154 | 2.7 | -11.8 | ||
Turnout | 5,653 | ||||
Conservative gain from Labour | Swing | +8.6 | |||
Party | Candidate | Votes | % | ± | |
---|---|---|---|---|---|
Labour | T. Mahon | 1,908 | 77.4 | +5.9 | |
Conservative | D. Jagger | 336 | 13.6 | +1.3 | |
Liberal Democrat | K. Robinson | 221 | 9.0 | -3.6 | |
Majority | 1,572 | 63.8 | +4.9 | ||
Turnout | 2,465 | ||||
Labour hold | Swing | +2.3 | |||
Party | Candidate | Votes | % | ± | |
---|---|---|---|---|---|
Labour | D. Fairfax | 2,432 | 67.6 | +5.0 | |
Conservative | M. Matloob | 508 | 14.1 | -4.9 | |
Liberal Democrat | E. Hallman | 472 | 13.1 | -2.1 | |
Independent | R. Johnson | 188 | 5.2 | +5.2 | |
Majority | 1,924 | 53.4 | +9.9 | ||
Turnout | 3,600 | ||||
Labour hold | Swing | +4.9 | |||
Party | Candidate | Votes | % | ± | |
---|---|---|---|---|---|
Labour | A. Ahmed | 3,472 | 68.4 | -11.1 | |
Conservative | I. Ahmed | 1,074 | 21.1 | +10.2 | |
Green | N. Tart | 531 | 10.5 | +0.8 | |
Majority | 2,398 | 47.2 | -21.3 | ||
Turnout | 5,077 | ||||
Labour hold | Swing | -10.6 | |||
Party | Candidate | Votes | % | ± | |
---|---|---|---|---|---|
Labour | R. Berry | 2,578 | 65.3 | +1.1 | |
Conservative | D. Craven | 890 | 22.5 | +1.0 | |
Liberal Democrat | B. Boulton | 480 | 12.2 | -2.2 | |
Majority | 1,688 | 42.8 | +0.1 | ||
Turnout | 3,948 | ||||
Labour hold | Swing | +0.0 | |||
Party | Candidate | Votes | % | ± | |
---|---|---|---|---|---|
Labour | M. Young | 2,027 | 46.1 | +9.8 | |
Conservative | M. Ellis | 1,495 | 34.0 | -2.1 | |
Liberal Democrat | C. Brown | 871 | 19.8 | -7.7 | |
Majority | 532 | 12.1 | +11.9 | ||
Turnout | 4,393 | ||||
Labour gain from Conservative | Swing | +5.9 | |||
Party | Candidate | Votes | % | ± | |
---|---|---|---|---|---|
Labour | M. Beeley | 2,392 | 65.0 | +7.6 | |
Conservative | D. Owen | 717 | 19.5 | -7.5 | |
Liberal Democrat | H. Boulton | 573 | 15.6 | -0.1 | |
Majority | 1,675 | 45.5 | +15.1 | ||
Turnout | 3,682 | ||||
Labour hold | Swing | +7.5 | |||
Bowling and Barkerend is an electoral ward within the City of Bradford Metropolitan District Council. The population at the 2011 Census was 20,618.
Great Horton is a ward within the City of Bradford Metropolitan District Council, in the county of West Yorkshire, England. The population of the ward increased to 17,683 at the 2011 Census.
Windhill and Wrose is a ward within the City of Bradford Metropolitan District Council in the county of West Yorkshire, England, named after the districts of Windhill and Wrose around which it is drawn.
The City of Bradford Metropolitan District Council elections were held on Thursday, 7 May 1998, with one third of the council up for election. Since the previous election there had been a number of by-elections resulting in two Labour defenses and a Conservative gain in Heaton, due to be defended at this election. Labour retained control of the council.
The 2012 City of Bradford Metropolitan District Council election took place on 3 May 2012. The elections took place shortly after the Bradford West by-election, in which the Respect Party's George Galloway pulled off a shock victory against the incumbent Labour Party. Held alongside was a referendum on directly elected mayors. The Labour Party were one seat short of an overall majority following the election, leaving the council in no overall control.
The City of Bradford Metropolitan District Council election took place on Thursday 5 May 2011.
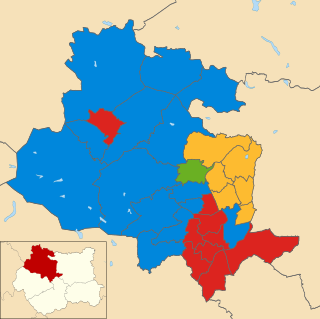
The City of Bradford Metropolitan District Council election took place on Thursday 1 May 2008.
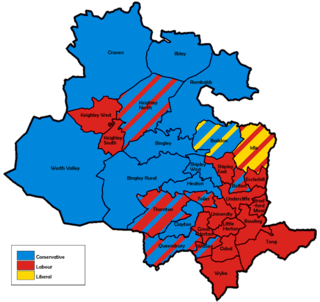
Elections to City of Bradford Metropolitan District Council were held on were held on Thursday, 1 May 1980, with boundary changes prompting the entirety of the council to be elected.
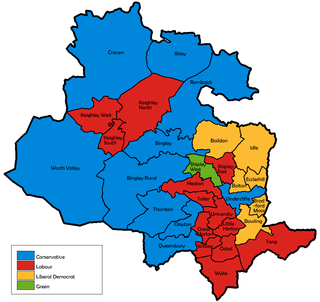
Elections to City of Bradford Metropolitan District Council were held on 1 May 2003. Before the election, Wibsey Labour councillor, Keith Thomson, had defected to Independent. One third of the council was up for election, and it remained under no overall control.
The 2015 City of Bradford Metropolitan District Council election took place on 7 May 2015. This was on the same day as other local elections and a general election. One councillor was elected in each ward for a four-year term so the councillors elected in 2015 last stood for election in 2011. Each ward is represented by three councillors, the election of which is staggered, so only one third of the councillors were elected in this election. Labour retained overall control of the council.
The 2015 Harlow District Council election took place on 7 May 2015 to elect members of Harlow District Council in Essex, England. One third of the council was up for election and Labour party councillors increased their control of the council as the governing group, gaining one councillor and suffering no losses.
The City of Bradford Metropolitan District Council elections were held on Thursday, 4 May 1990, with one third of the council up for election as well as vacancies in Great Horton & Ilkley to be elected. Labour had suffered a defection prior to the election in the University ward, with the sitting councillor attempting, unsuccessfully, to defend it as a Conservative. Labour regained control of the council from no overall control following numerous gains from the Conservatives.
The City of Bradford Metropolitan District Council elections were held on Thursday, 5 May 1994, with one third of the council up for election. Labour retained control of the council.
The City of Bradford Metropolitan District Council elections were held on Thursday, 2 May 1996, with one third of the council up for election. Labour retained control of the council.
The City of Bradford Metropolitan District Council elections were held on Thursday, 6 May 1999, with one third of the council up for election. Since the previous election there had been a by-election resulting in Labour successfully defending their seat in Little Horton. Labour retained control of the council.
The 2015 West Oxfordshire District Council election took place on 22 May 2015 to elect members of West Oxfordshire District Council in Oxfordshire, England. One third of the council was up for election and the Conservative party stayed in overall control of the council.
The City of Bradford Metropolitan District Council elections were held on Thursday, 4 May 2000, with one third of the council up for election. Labour lost control of the council to no overall control.
The 2016 City of Bradford Metropolitan District Council election took place on 5 May 2016. This was on the same day as other local elections. One councillor was elected in each ward for a four-year term. Each ward is represented by three councillors, the election of which is staggered, so only one third of the councillors were elected in this election.
The 2018 City of Bradford Metropolitan District Council took place on 3 May 2018 to elect members of Bradford District Council in England. This was on the same day as other local elections. One councillor was elected in each ward for a four-year term so the councillors elected in 2018 last stood for election in 2014. Each ward is represented by three councillors, the election of which is staggered, so only one third of the councillors were elected in this election. Before the election there was a Labour majority and afterwards Labour had increased their majority.