Bristol City Council election, 1995

Last updated
Bristol City Council election, 1995
Flag of England.svg
  1994 4 May 1995 1997  

All 68 seats to Bristol City Council
35 seats needed for a majority

  First party Second party Third party
 
Party Labour Liberal Democrat Conservative
Seats won 53 9 6
Seat changeIncrease2.svg12Increase2.svg1Decrease2.svg13

Council control before election

Labour Party (UK)

Council control after election

Labour Party (UK)

1995 local election results in Bristol Bristol ward results 1995.png
1995 local election results in Bristol

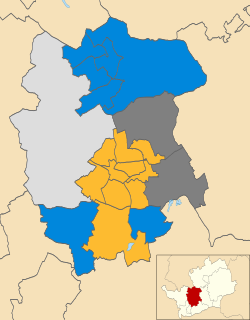
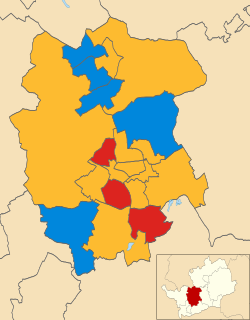
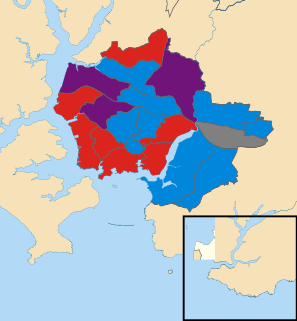
The 1995 Bristol City Council election took place on 4 May 1995 with all seats being up for election, in preparation for Bristol City Council becoming a Unitary Authority following the abolition of Avon County Council. [1] The same ward boundaries were used, however these are elections to a new authority and cannot be considered gains or losses compared to previously held seats.

Avon County Council was the county council of the non-metropolitan county of Avon in south west England. It came into its powers on 1 April 1974 and was abolished on 1 April 1996 at the same time as the county. The county council was based in Bristol at Avon House and Avon House North. It was replaced with four authorities: Bristol City Council, South Gloucestershire Council, North Somerset Council and Bath and North East Somerset Council.

Contents

The election saw national issues, such as the unpopularity of the national Conservative government and the state of the economy, being the major issues in the election. The Conservative candidates branded themselves as 'Bristol Conservatives', which was seen as an attempt to distance themselves from the national government. [1] The Labour Party was expected to win a large majority but they were criticised by the Conservatives for cutting money from the Scouts while giving money to a lesbian/bisexual women's group. [2]

Conservative Party (UK) Political party in the United Kingdom

The Conservative Party, officially the Conservative and Unionist Party, is a centre-right political party in the United Kingdom. Presently led by Theresa May, it has been the governing party since 2010. It presently has 314 Members of Parliament in the House of Commons, 249 members of the House of Lords, and 18 members of the European Parliament. It also has 31 Members of the Scottish Parliament, 12 members of the Welsh Assembly, eight members of the London Assembly and 9,008 local councillors. One of the major parties of UK politics, it has formed the government on 45 occasions, more than any other party.

The Labour Party is a centre-left political party in the United Kingdom which has been described as an alliance of social democrats, democratic socialists and trade unionists. The party's platform emphasises greater state intervention, social justice and strengthening workers' rights.

Scouting World-wide movement for the education of youth, founded by Robert Baden-Powell in 1907

Scouting or the Scout Movement is a movement that aims to support young people in their physical, mental and spiritual development, that they may play constructive roles in society, with a strong focus on the outdoors and survival skills. During the first half of the twentieth century, the movement grew to encompass three major age groups for boys and, in 1910, a new organization, Girl Guides, was created for girls. It is one of several worldwide youth organizations.

Labour easily gained a majority and as predicted before the election the Liberal Democrats became the second largest party on the council driving the Conservatives down to third as compared to the previous district council. [1]

Liberal Democrats (UK) Political party in the United Kingdom

The Liberal Democrats are a liberal political party in the United Kingdom. They presently have 11 Members of Parliament in the House of Commons, 96 members of the House of Lords, and one member of the European Parliament. They also have five Members of the Scottish Parliament and a member each in the Welsh Assembly and London Assembly. The party reached the height of its influence in the early 2010s, forming a junior partner in a coalition government from 2010 to 2015. It is presently led by Vince Cable.

Election results

The party standings following the election:

Party Cllrs % Vote
Labour Party 53 53.3
Liberal Democrats 9 19.6
Conservative Party 6 24.8
Total 68 97.7

Ward results

The change is calculated using the most recent election result in each ward, in most cases 1994, or otherwise 1992. Sebastian Matthews, who apparently stood as the "Macromedia Student" party, is possibly a nomination-paper error where 'Occupation' and 'Party' were swapped, c.f. Systems Designer.

Ashley
PartyCandidateVotes%±
Labour Nichola I. Barton 1,763 62.9 +2.4
Labour Raymond J. Sefia 1,472
Green David M. Simpson 426 15.2 +1.7
Liberal Democrat John H. Bonham-Carter 393 14.0 -0.4
Liberal Democrat Jane McGarry 368
Conservative Kerrie Carpenter 223 8.0 -3.7
Conservative Ian J. Henderson 214
Majority 1,046 37.3
Turnout 31.8
Avonmouth
PartyCandidateVotes%±
Labour Celia M. Lukins 2,200 68.8 +4.5
Labour Ernie Bristow 2,149
Conservative David L. Holme 578 18.1 -3.1
Liberal Democrat Paul W. Lloyd 419 13.1 -1.4
Liberal Democrat Pamela Henderson 371
Majority 1,571 49.1
Turnout 41.8
Bedminster
PartyCandidateVotes%±
Labour Peter J. Crispin 2,001 60.3 +7.7
Labour Claire M. Warren 1,683
Conservative Jack LoPresti 526 15.8 -6.2
Liberal Democrat Mary Sykes 513 15.4 -5.9
Conservative Christian V.J. Simpson 498
Green Charles N. Bolton 281 8.5 +4.4
Majority 1,157 34.8
Turnout 34.9
Bishopston
PartyCandidateVotes%±
Labour Patricia M. McLaren 2,115 50.5 +7.6
Labour Arthur Keefe 2,064
Liberal Democrat David J.G. Kitson 1,055 25.2 -3.9
Liberal Democrat Peter J. Maitland 966
Conservative Ian E. Kealey 718 17.2 -1.3
Conservative Pearl C.L. Abraham 695
Green Justin M. Quinnell 298 7.1 +3.2
Majority 1,009 24.1
Turnout 45.0
Bishopsworth
PartyCandidateVotes%±
Labour Terence Cleverley 1,674 53.1 +11.7
Labour Paul C. Walker 1,468
Conservative Richard S. Eddy 1,138 36.1 -13.3
Conservative Michael J. Jarrett 1,022
Liberal Democrat Nicholas L. Doddrell 218 6.9 +0.9
Green Barrie R. Lewis 124 3.9 +0.7
Majority 330 10.5
Turnout 40.8
Brislington East
PartyCandidateVotes%±
Labour William L. Martin 2,357 64.1 +21.2
Labour Peter T.J. Begley 2,297
Conservative Anthony R. Carey 823 22.4 -25.3
Conservative Colin R. Bretherton 761
Liberal Democrat Jeffery Exon 495 13.5 +6.5
Liberal Democrat Linda Hopkins 404
Majority 1,474 40.1
Turnout 39.9
Brislington West
PartyCandidateVotes%±
Labour Dan Norris 1,905 48.3 +18.9
Labour Jane V. Painter 1,859
Liberal Democrat Peter H. Main 1,217 30.8 +2.3
Liberal Democrat Catherine F. Johnstone 1,188
Conservative Holly Richmond 656 16.6 -21.7
Conservative Ian D. Millard 609
Green Mary B. Wood 169 4.3 +0.5
Majority 642 16.3
Turnout 45.5
Cabot
PartyCandidateVotes%±
Liberal Democrat Charles R. Boney 1,395 41.4 -5.8
Liberal Democrat Stephen R. Williams 1,264
Labour Paul A. Garland 1,182 35.1 +3.9
Labour William J. Waines 997
Conservative Ashley P. Fox 518 15.4 -1.3
Conservative David J. Smith 499
Green Rowan V. Beton 277 8.2 +3.2
Majority 82 2.4
Turnout 34.8
Clifton
PartyCandidateVotes%±
Liberal Democrat Barbara Janke 1,574 40.5 -6.7
Liberal Democrat Brian H. Price 1,554
Conservative John Bretten 1,241 32.0 -3.7
Conservative Alan D. Tasker 1,192
Labour Nicole A.M. Steven 808 20.8 +7.3
Labour Denton W. Brockway 807
Green Lucinda Hersey 259 6.7 +3.1
Majority 313 8.1
Turnout 39.5
Cotham
PartyCandidateVotes%±
Labour Shelley M. Lanchbury 1,609 46.1 +6.8
Labour Fabian G. Breckels 1,584
Conservative Philip A. Cobbold 899 25.7 -3.9
Conservative Anthony M.B. Orr 884
Liberal Democrat Michael C. Bosel 727 20.8 -5.9
Liberal Democrat Gizella K. Hughes 717
Green Geoff Collard 258 7.4 +3.0
Majority 685 19.6
Turnout 38.3
Easton
PartyCandidateVotes%±
Liberal Democrat John F. Kiely 1,840 51.8 +2.8
Liberal Democrat Michael B. Smith 1,710
Labour Michael Langley 1,399 39.4 +0.2
Labour David White 1,298
Green Robert Nicholls 165 4.6 +1.7
Conservative Paul N. Hancock 146 4.1 +0.3
Majority 311 8.8
Turnout 46.2
Eastville
PartyCandidateVotes%±
Labour Sally J. Andrews 1,785 56.2 +13.1
Labour David Sutton 1,608
Conservative Lesley A. Alexander 850 26.8 +2.5
Conservative Timothy C. Collins 799
Liberal Democrat Paul R. Potts 542 17.1 +2.4
Liberal Democrat Roland I. Potts 447
Majority 758 23.9
Turnout 37.1
Filwood
PartyCandidateVotes%±
Labour Stephen James Grant 1,385 69.8 +11.2
Labour George Micklewright 1,300
Militant Labour Ian P. Marshall 312 15.7 -4.4
Militant Labour Wayne Coombes 251
Conservative Jonathan R. Hucker 159 8.0 -0.5
Green Graham H. Davey 128 6.5 +4.5
Majority 988 49.8
Turnout 27.4
Frome Vale
PartyCandidateVotes%±
Labour Adrian Becker 2,264 53.1 +10.3
Labour Anne M. Walder 1,952
Conservative Kenneth I. Blanchard 1,390 32.6 +7.1
Conservative Victor C. Eaglestone 1,085
Liberal Democrat Stella J. Hender 425 10.0 -9.3
Liberal Democrat Jean C. Norman 376
Green Simon D. Kellett 184 4.3 +4.3
Majority 562 13.2
Turnout 44.1
Hartcliffe
PartyCandidateVotes%±
Labour Bernard W. Chalmers 1,950 75.3 +29.7
Labour Mervyn R. Hulin 1,754
Conservative Barrie R. Edwards 447 17.3 -15.8
Conservative Jonathan D.R. Price 353
Green Susan P. Ball 194 7.5 +1.7
Majority 1,307 50.4
Turnout 31.2
Henbury
PartyCandidateVotes%±
Labour Jack D. Fisk 2,353 63.3 +11.7
Labour Richard J. Pyle 2,197
Conservative Donald C. Miller 942 25.3 +0.4
Conservative Janet G. Reed 817
Liberal Democrat Anne W. Stephen 424 11.4 -2.2
Liberal Democrat John W.A. Toye 311
Majority 1,255 33.7
Turnout 47.4
Hengrove
PartyCandidateVotes%±
Liberal Democrat Judith M. Webb 2,079 51.4 +8.3
Liberal Democrat Sandra S. Loader 1,937
Labour Michael J. Chivers 1,167 28.9 +7.8
Labour Mohammad K. Ahmed 1,093
Conservative Brian W. Edwards 798 19.7 -15.2
Conservative Steven M. Willis 760
Majority 770 19.0
Turnout 40.0
Henleaze
PartyCandidateVotes%±
Liberal Democrat Rosalie M. Brown 2,198 43.9 -5.5
Conservative Joyce M. Fey 2,051 41.0 +3.3
Conservative John L. Portch 1,982
Liberal Democrat John E. Mortell 1,843
Labour Keith Evans 753 15.1 +4.8
Labour Roger J. Livingston 657
Majority 69 1.4
Turnout 55.7
Hillfields
PartyCandidateVotes%±
Labour Graham R. Robertson 2,043 77.4 +21.6
Labour J. Douglas Naysmith 2,009
Conservative Barbara J. Moore 596 22.6 +7.8
Conservative Alfred D. Seville 588
Majority 1,413 53.5
Turnout 34.6
Horfield
PartyCandidateVotes%±
Labour Arthur Massey 1,760 48.1 +5.0
Labour David R. Poole 1,751
Conservative Betty J.D. Topham 1,441 39.4 +7.9
Conservative Anthony J. Smith 1,279
Liberal Democrat Margaret S. Hodgkins 355 9.7 -3.9
Liberal Democrat Sylvia E. Young 351
Green Peter M. Scott 105 2.9 +1.0
Majority 310 8.5
Turnout 46.1
Kingsweston
PartyCandidateVotes%±
Labour Rosemary A. Clarke 1,944 65.7 +5.6
Labour John T. Bees 1,934
Conservative Jeanne Veale 655 22.1 -1.8
Conservative Richard L. Clifton 618
Liberal Democrat Andrew Ludlow 361 12.2 -3.8
Liberal Democrat Francis R. Young 344
Majority 1,279 43.2
Turnout 41.1
Knowle
PartyCandidateVotes%±
Labour Tessa Coombes 1,774 58.3 +14.8
Labour Patricia Roberts 1,672
Conservative John E. Gammon 576 18.9 -22.4
Liberal Democrat Evelyn M. Elworthy 486 16.0 +3.2
Green John M. Hills 205 6.7 +4.3
Majority 1,096 36.0
Turnout 35.8
Lawrence Hill
PartyCandidateVotes%±
Labour Robert J. Channon 1,759 72.6 +10.9
Labour Lesley Broomhead 1,718
Liberal Democrat Michael Baker 400 16.5 +3.5
Liberal Democrat Paul Elvin 308
Conservative George E. Burton 264 10.9 +2.1
Majority 1,318 54.4
Turnout 29.2
Lockleaze
PartyCandidateVotes%±
Labour Judy Patterson 1,880 65.7 +12.1
Labour Philip W. Gregory 1,824
Liberal Democrat Joan Grace 636 22.2 -2.4
Liberal Democrat Ian H. Parry 566
Conservative Christopher R. Stallabrass 347 12.1 +0.1
Conservative Geoffrey R. Gollop 336
Majority 1,188 41.5
Turnout 39.6
Redland
PartyCandidateVotes%±
Labour John Ashton 2,060 48.9 +9.9
Labour Joan B. McLaren 1,989
Conservative Mark F.H. Casewell 1,102 26.1 -3.4
Conservative Antony S. Waycott 1,086
Liberal Democrat Robert J. Wills 926 22.0 -4.8
Liberal Democrat Michael J. Woods 841
Macromedia Student Sebastian A.H. Matthews 127 3.0 +3.0
Majority 887 21.0
Turnout 45.3
Southmead
PartyCandidateVotes%±
Labour Peter W. Hammond 1,745 64.8 +11.0
Labour Jennifer M. Smith 1,699
Conservative Martin Kerry 599 22.3 +4.8
Conservative Jarmila Parry 567
Liberal Democrat Carol F. Taylor 348 12.9 -1.6
Liberal Democrat Simon R. Young 251
Majority 1,100 40.9
Turnout 34.8
Southville
PartyCandidateVotes%±
Labour Andrew J. May 2,123 62.6 +4.0
Labour David Johnson 2,104
Conservative Cora A.P. Stephenson 503 14.8 -2.1
Conservative Neil A. Cuthbertson 478
Liberal Democrat Richard F. Hughes 411 12.1 -6.9
Green Sigrid Shayer 357 10.5 +5.0
Majority 1,601 47.2
Turnout 38.1
St. George East
PartyCandidateVotes%±
Labour Charles S. Price 1,802 61.3 +18.1
Labour Margaret A. Shovelton 1,778
Conservative Edward J. Withers 632 21.5 -21.8
Conservative Derek A.E. Fey 629
Liberal Democrat Gordon H. Draper 508 17.3 +5.7
Liberal Democrat Tony R. Potts 414
Majority 1,146 39.0
Turnout 35.4
St. George West
PartyCandidateVotes%±
Labour John E. Deasy 2,062 72.5 +22.0
Labour Ronald E. Stone 1,983
Liberal Democrat Gordon Williams 436 15.3 -11.0
Liberal Democrat Kenneth M. Peacock 432
Conservative Derek V. Hooper 345 12.1 -9.0
Conservative Marilyn Hutton 308
Majority 1,547 54.4
Turnout 36.9
Stockwood
PartyCandidateVotes%±
Labour Robin Moss 2,002 42.6 +11.0
Conservative Colin J.N. Williams 1,985 42.3 -17.8
Labour David Spry 1,968
Conservative David H.R. Morris 1,820
Liberal Democrat Jane M. Collins 709 15.1 +7.8
Liberal Democrat Rosemary A. Windmill 383
Majority 17 0.4
Turnout 46.3
Stoke Bishop
PartyCandidateVotes%±
Conservative Peter J. Abraham 2,051 51.1 -1.9
Conservative Christopher M.B. Alderson 1,992
Liberal Democrat Keri A. Dow 1,034 25.8 -4.2
Liberal Democrat Dennis H. Brown 961
Labour Luke Akehurst 769 19.2 +5.3
Labour Edward F. Fowler 719
Green William F. McCaskie 160 4.0 +0.9
Majority 958 23.9
Turnout 39.6
Westbury-on-Trym
PartyCandidateVotes%±
Conservative David H. Poole 2,614 54.8 -0.1
Conservative Robert W. Wall 2,544
Labour Dick Drew 1,102 23.1 +9.6
Liberal Democrat Carol K. Stratton 1,050 22.0 -9.6
Liberal Democrat Antony A. Stratton 976
Majority 1,442 30.3
Turnout 53.0
Whitchurch Park
PartyCandidateVotes%±
Labour Helen Holland 2,025 77.8 +15.8
Labour Paul Smith 2,008
Conservative Robert R. Morris 392 15.1 -10.3
Green Christine J. Presley 187 7.2 +5.4
Majority 1,616 62.1
Turnout 31.7
Windmill Hill
PartyCandidateVotes%±
Labour Diane E. Bunyan 2,368 69.1 +23.8
Labour Christopher L. Orlik 2,035
Green Anita J. Lewis 543 15.8 +5.1
Conservative William R.J. Biggs 516 15.1 -15.8
Conservative Lilian F. Biggs 506
Majority 1,492 43.5
Turnout 32.3

Related Research Articles

Sketty (electoral ward) human settlement in United Kingdom

Sketty is the name of an electoral ward in the City and County of Swansea, Wales, UK. The electoral ward is coterminous with the community.

Politics of Bristol

The city of Bristol, England, is a unitary authority, represented by four MPs representing seats wholly within the city boundaries. As well as these, Filton and Bradley Stoke covers the northern urban fringe in South Gloucestershire and the north eastern urban fringe is in the Kingswood constituency. The overall trend of both local and national representation became left of centre, favouring the Labour Party and Liberal Democrats during the latter 20th century, but there was a shift to the right in the 2010 general election. The city has a tradition of local activism, with environmental issues and sustainable transport being prominent issues in the city.

1998 Solihull Metropolitan Borough Council election

The 1998 Solihull Metropolitan Borough Council election took place on 7 May 1998 to elect members of Solihull Metropolitan Borough Council in the West Midlands, England. One third of the council was up for election and the council stayed under no overall control.

2008 St Albans City and District Council election

The 2008 St Albans City and District Council election took place on 1 May 2008 to elect members of St Albans District Council in Hertfordshire, England. One third of the council was up for election and the Liberal Democrats gained overall control of the council from no overall control.

The 1999 Lichfield District Council election took place on 6 May 1999 to elect members of Lichfield District Council in Staffordshire, England. The whole council was up for election and the Conservative party gained overall control of the council from the Labour party.

2003 St Albans City and District Council election

The 2003 St Albans City and District Council election took place on 1 May 2003 to elect members of St Albans District Council in Hertfordshire, England. One third of the council was up for election and the council stayed under no overall control.

The 2003 Worcester City Council election took place on 1 May 2003 to elect members of Worcester District Council in Worcestershire, England. One third of the council was up for election and the Conservative party gained overall control of the council from no overall control.

The 2010 Winchester Council election took place on 6 May 2010 to elect members of Winchester District Council in Hampshire, England. One third of the council was up for election and the Liberal Democrats gained overall control of the council from the Conservative party.

The 2004 Winchester Council election took place on 10 June 2004 to elect members of Winchester District Council in Hampshire, England. One third of the council was up for election and the Liberal Democrats lost overall control of the council to no overall control.

2012 Scottish local elections

The 2012 Scottish local elections, were held on 3 May, in all 32 local authorities. The Scottish National Party (SNP) overtook Labour to win the highest share of the vote, and retained and strengthened its position as the party with most councillors. Labour also made gains, while the Liberal Democrats experienced meltdown, falling behind the Conservatives. For the first time since the introduction of the Single Transferable Vote system, the SNP won majority control of 2 councils, from no overall control. Labour also won majority control of 2 councils from no overall control, while retaining majority control over 2 councils.

The 2000 Oldham Council election took place on 4 May 2000 to elect members of Oldham Metropolitan Borough Council in Greater Manchester, England. One third of the council was up for election and the Liberal Democrats gained overall control of the council from the Labour party.

2010 Plymouth City Council election

The 2010 Plymouth City Council election was held on 6 May 2010 to elect members of Plymouth City Council in England.

2006 Solihull Metropolitan Borough Council election

The 2006 Solihull Metropolitan Borough Council election took place on 4 May 2006 to elect members of Solihull Metropolitan Borough Council in the West Midlands, England. One third of the council was up for election and the Conservative party stayed in overall control of the council.

2006 Sunderland City Council election

The 2006 Sunderland Council election took place on 4 May 2006 to elect members of Sunderland City Council in Tyne and Wear, England. One third of the Council was up for election and the Labour party stayed in overall control.

2008 Sunderland City Council election

The 2008 Sunderland Council election took place on 1 May 2008 to elect members of Sunderland Metropolitan Borough Council in Tyne and Wear, England. One third of the council was up for election and the Labour party stayed in overall control of the council.

2010 Sunderland City Council election

The 2010 Sunderland Council election took place on 6 May 2010 to elect members of Sunderland Metropolitan Borough Council in Tyne and Wear, England. One third of the council was up for election and the Labour party stayed in overall control of the council. The election took place on the same day as the 2010 General Election.

2011 Sunderland City Council election

The 2011 Sunderland Council election took place on 5 May 2011 to elect members of Sunderland Metropolitan Borough Council in Tyne and Wear, England. One third of the council was up for election and the Labour party stayed in overall control of the council.

2011 Carlisle City Council election

The 2011 Carlisle City Council election took place on 5 May 2011 to elect members of Carlisle District Council in Cumbria, England. One third of the council was up for election and the council stayed under no overall control.

2012 East Lothian Council election

Elections to East Lothian Council were held on 3 May 2012, on the same day as the other Scottish local government elections. The election used the 7 wards created as a result of the Local Governance (Scotland) Act 2004, with each ward electing three or four councillors using the single transferable vote system a form of proportional representation, with 23 councillors elected.

2014 Plymouth City Council election

The 2014 Plymouth City Council election took place on 22 May 2014 to elect members of Plymouth City Council in England. This was on the same day as other local elections. The election was won by the Labour Party, who maintained their overall majority. The UK Independence Party gained representation on the council for the first time, and this was the only election in which the party won seats in Plymouth.

References

  1. 1 2 3 Bennett, Will (1995-04-25). "Conservatives battling to survive in reborn Bristol". London: The Independent . Retrieved 2009-04-14.
  2. Woolf, Marie (1995-04-23). "Bad news? Labour's abolished it". The Independent on Sunday. p. 2.