| |||||||||||||||||
23 of 68 seats (one third) to Bristol City Council 35 seats needed for a majority | |||||||||||||||||
| |||||||||||||||||
|
Elections to Bristol City Council were held on 1 May 1997. [1]
Bristol City Council is the local authority of Bristol, England. The council is a unitary authority, and is unusual in the United Kingdom in that its executive function is controlled by a directly elected mayor of Bristol. Bristol has 35 wards, electing a total of 70 councillors.
Party | Candidate | Votes | % | ± | |
---|---|---|---|---|---|
Labour | Ernie Bristow | 3,363 | 59.03 | ||
Conservative | Frances Summers | 1,462 | 25.66 | ||
Liberal Democrat | Paul Wakefield | 770 | 13.52 | ||
Green | Lela McTernan | 102 | 1.79 | ||
Majority | 1,901 | 33.37 | |||
Turnout | 5,711 | 76.62 | |||
Party | Candidate | Votes | % | ± | |
---|---|---|---|---|---|
Labour | Arthur Keefe | 2,673 | 39.47 | ||
Liberal Democrat | David Gordon Kitson | 2,224 | 32.84 | ||
Conservative | Ian Kealey | 1,528 | 22.56 | ||
Green | Justin Quinnell | 347 | 5.12 | ||
Majority | 449 | 6.63 | |||
Turnout | 6,791 | 75.01 | |||
Party | Candidate | Votes | % | ± | |
---|---|---|---|---|---|
Labour | Paul Crawford Walker | 2,348 | 47.40 | ||
Conservative | Richard Eddy | 1,962 | 39.60 | ||
Liberal Democrat | Nicholas Doddrell | 448 | 9.04 | ||
Green | Barrie Lewis | 196 | 3.96 | ||
Majority | 386 | 7.80 | |||
Turnout | 4,963 | 70.14 | |||
Party | Candidate | Votes | % | ± | |
---|---|---|---|---|---|
Labour | Peter James Begley | 2,928 | 43.74 | ||
Conservative | Ian Henderson | 1,848 | 27.61 | ||
Liberal Democrat | Michael John Baker | 1,343 | 20.06 | ||
Socialist Labour | Brian Corbett | 487 | 7.28 | ||
Green | Martin Turnbull | 88 | 1.31 | ||
Majority | 1,080 | 16.13 | |||
Turnout | 6,730 | 71.13 | |||
Party | Candidate | Votes | % | ± | |
---|---|---|---|---|---|
Liberal Democrat | Peter Main | 2,558 | 40.86 | ||
Labour | Jane Painter | 2,302 | 36.77 | ||
Conservative | Colin Bretherton | 1,239 | 19.79 | ||
Green | Mary Beryl Wood | 162 | 2.59 | ||
Majority | 256 | 4.09 | |||
Turnout | 6,278 | 47.78 | |||
Party | Candidate | Votes | % | ± | |
---|---|---|---|---|---|
Liberal Democrat | Brian Price | 2,991 | 42.47 | ||
Conservative | John Bretten | 2,278 | 32.34 | ||
Labour | Alun Davies | 1,442 | 20.47 | ||
Green | David Woodgate | 332 | 4.71 | ||
Majority | 713 | 10.13 | |||
Turnout | 7,062 | 66.52 | |||
Party | Candidate | Votes | % | ± | |
---|---|---|---|---|---|
Liberal Democrat | Geoffrey Jones | 2,418 | 34.72 | ||
Conservative | Phillip Cobbold | 2,069 | 29.71 | ||
Labour | Fabian Breckels | 2,039 | 29.27 | ||
Green | Geoff Collard | 439 | 6.30 | ||
Majority | 349 | 5.01 | |||
Turnout | 6,996 | 69.49 | |||
Party | Candidate | Votes | % | ± | |
---|---|---|---|---|---|
Labour | Mervyn Hulin | 2,904 | 57.61 | ||
Conservative | Jack Lopresti | 1,073 | 21.29 | ||
Liberal Democrat | Evelyn Elworthy | 930 | 18.45 | ||
Green | Mary Elizabeth Thomson | 134 | 2.66 | ||
Majority | 1,831 | 36.32 | |||
Turnout | 5,060 | 66.70 | |||
Party | Candidate | Votes | % | ± | |
---|---|---|---|---|---|
Labour | Richard John Pyle | 3,047 | 54.00 | ||
Conservative | Anthony James Smith | 1,741 | 30.85 | ||
Liberal Democrat | Sylvia Young | 855 | 15.15 | ||
Majority | 1,306 | 23.15 | |||
Turnout | 5,664 | 74.01 | |||
Party | Candidate | Votes | % | ± | |
---|---|---|---|---|---|
Labour | Kelvin Blake | 2,646 | 35.91 | ||
Liberal Democrat | Mary Sykes | 2,375 | 32.23 | ||
Conservative | Steven Willis | 2,253 | 30.57 | ||
Green | Charles Bolton | 95 | 1.29 | ||
Majority | 271 | 3.68 | |||
Turnout | 7,377 | 74.93 | |||
Party | Candidate | Votes | % | ± | |
---|---|---|---|---|---|
Liberal Democrat | Dennis Hunter Brown | 3,082 | 41.64 | ||
Conservative | Joyce Fey | 2,981 | 40.27 | ||
Labour | Roger Livingston | 1,130 | 15.27 | ||
Green | Richard Cook | 209 | 2.82 | ||
Majority | 101 | 1.37 | |||
Turnout | 7,414 | 80.58 | |||
Party | Candidate | Votes | % | ± | |
---|---|---|---|---|---|
Labour | Kathleen Walker | 2,538 | 44.64 | ||
Conservative | Martin Kerry | 1,984 | 34.89 | ||
Liberal Democrat | Simon Young | 1,022 | 17.97 | ||
Green | Donald Monck Brown | 142 | 2.50 | ||
Majority | 554 | 9.75 | |||
Turnout | 5,700 | 72.74 | |||
Party | Candidate | Votes | % | ± | |
---|---|---|---|---|---|
Labour | John Bees | 2,879 | 55.95 | ||
Conservative | Edward Ward | 1,332 | 25.88 | ||
Liberal Democrat | Anthony James Wood | 935 | 18.17 | ||
Majority | 1,547 | 30.07 | |||
Turnout | 5,162 | 72.18 | |||
Party | Candidate | Votes | % | ± | |
---|---|---|---|---|---|
Labour | Patricia Roberts | 2,757 | 55.73 | ||
Conservative | Julian Hendy | 1,110 | 22.44 | ||
Liberal Democrat | David Traube | 850 | 17.18 | ||
Green | Graham Davey | 230 | 4.65 | ||
Majority | 1,647 | 33.29 | |||
Turnout | 4,962 | 68.23 | |||
Party | Candidate | Votes | % | ± | |
---|---|---|---|---|---|
Labour | Rosalind Mitchell | 2,540 | 34.78 | ||
Liberal Democrat | David Richer | 2,467 | 33.78 | ||
Conservative | Micahel Withers | 1,837 | 25.15 | ||
Green | Christopher Sykes | 460 | 36.30 | ||
Majority | 73 | 1.00 | |||
Turnout | 7.330 | 74.51 | |||
Party | Candidate | Votes | % | ± | |
---|---|---|---|---|---|
Labour | Jennifer Smith | 3,117 | 59.19 | ||
Conservative | Anthony Burrell Orr | 1,190 | 22.60 | ||
Liberal Democrat | Martyn Dunn | 834 | 15.84 | ||
Green | Siobhan Campbell | 125 | 2.34 | ||
Majority | 1,927 | 36.59 | |||
Turnout | 5,287 | 68.67 | |||
Party | Candidate | Votes | % | ± | |
---|---|---|---|---|---|
Labour | Margaret Shovelton | 2,995 | 48.51 | ||
Conservative | Timothy Collins | 1,773 | 28.07 | ||
Liberal Democrat | Gordon Draper | 1,192 | 19.31 | ||
Socialist Labour | Roy Thomas Nurse | 138 | 2.24 | ||
Green | Aidan Knapp | 116 | 1.88 | ||
Majority | 1,262 | 20.44 | |||
Turnout | 6,199 | 72.53 | |||
Party | Candidate | Votes | % | ± | |
---|---|---|---|---|---|
Labour | Ronald Stone | 3,010 | 55.67 | ||
Liberal Democrat | Kenneth Peacock | 1,166 | 21.56 | ||
Conservative | George Burton | 1,086 | 20.09 | ||
Socialist Labour | Paul Francis Williams | 145 | 2.68 | ||
Majority | 1,844 | 34.11 | |||
Turnout | 5,427 | 68.21 | |||
Party | Candidate | Votes | % | ± | |
---|---|---|---|---|---|
Conservative | Colin Williams | 3,422 | 45.99 | ||
Labour | Bridget Wilson | 2,723 | 36.59 | ||
Liberal Democrat | Jane Mary Collins | 1,075 | 14.45 | ||
Socialist Labour | Giles Shorter | 120 | 1.61 | ||
Green | Maureen Arnaiz | 101 | 1.36 | ||
Majority | 699 | 9.40 | |||
Turnout | 7,452 | 76.85 | |||
Party | Candidate | Votes | % | ± | |
---|---|---|---|---|---|
Conservative | Christopher Alderson | 3,808 | 49.81 | ||
Liberal Democrat | Guy Adams | 2,091 | 27.35 | ||
Labour | Jonathan Wyatt | 1,534 | 20.07 | ||
Green | William McCaskie | 212 | 2.77 | ||
Majority | 1,717 | 22.46 | |||
Turnout | 7,664 | 75.20 | |||
Party | Candidate | Votes | % | ± | |
---|---|---|---|---|---|
Conservative | Robert William Wall | 3,585 | 53.25 | ||
Liberal Democrat | Edward Ward | 1,819 | 27.02 | ||
Labour | John Waines | 1,163 | 17.27 | ||
Green | Robert Nicholls | 166 | 2.47 | ||
Majority | 1,766 | 26.23 | |||
Turnout | 6,745 | 80.96 | |||
Party | Candidate | Votes | % | ± | |
---|---|---|---|---|---|
Labour | Paul Smith | 3,139 | 62.47 | ||
Conservative | Robert Rhys Morris | 1,031 | 20.52 | ||
Liberal Democrat | Joseph McNamee | 751 | 14.95 | ||
Green | John Mark Hills | 104 | 2.07 | ||
Majority | 2,108 | 41.95 | |||
Turnout | 5,036 | 62.19 | |||
Party | Candidate | Votes | % | ± | |
---|---|---|---|---|---|
Labour | Christopher Orlik | 3,426 | 52.44 | ||
Liberal Democrat | Gizella Gughes | 1,142 | 17.48 | ||
Conservative | David Robert Morris | 1,093 | 16.73 | ||
Green | Maxine Gilman | 649 | 9.93 | ||
Socialist Labour | Robin Clapp | 223 | 3.41 | ||
Majority | 2,284 | 34.96 | |||
Turnout | 6.546 | 66.28 | |||
David James Fletcher Hunt, Baron Hunt of Wirral MBE PC,, is a British Conservative politician, and was a member of the Cabinet during the Margaret Thatcher and John Major administrations, while also being appointed to serve on the Privy Council in 1990.
Bristol West is a borough constituency represented in the House of Commons of the Parliament of the United Kingdom. It covers the central and western parts of Bristol.
Bristol North West is a constituency to the north and north-west of Bristol city centre represented in the House of Commons of the UK Parliament since 2017 by Darren Jones of the Labour Party.
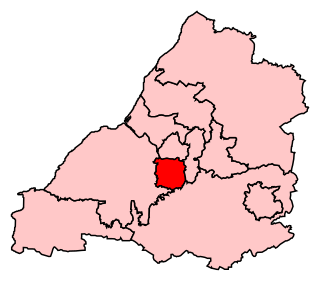
Bristol South is a constituency represented in the House of Commons of the UK Parliament since 2015 by Karin Smyth of the Labour Party.
Kingswood is a constituency represented in the House of Commons of the UK Parliament since 2010 by Chris Skidmore, a Conservative.
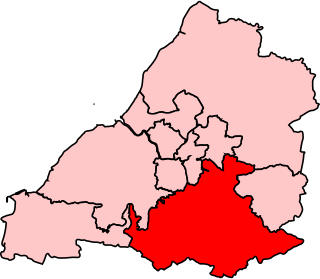
Wansdyke was a county constituency represented in the House of Commons of the Parliament of the United Kingdom. It elected one Member of Parliament (MP) by the first past the post system of election.
Bristol East is a constituency recreated in 1983 covering the eastern part of the City of Bristol, represented in the House of Commons of the UK Parliament since 2005 by Kerry McCarthy of the Labour Party. An earlier guise of the seat existed between 1885 and 1950.
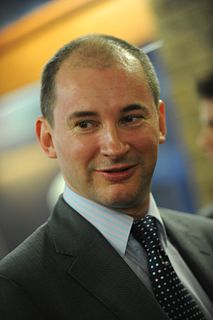
Stephen Roy Williams is a British Liberal Democrat politician who was first elected as the Member of Parliament (MP) for Bristol West in the 2005 general election, and re-elected with an increased majority in May 2010. In October 2013 he joined the Government as a Parliamentary Under Secretary of State in the Department of Communities and Local Government. In May 2015 Williams lost his Bristol West seat to the Labour Party's Thangam Debbonaire, and in May 2017 he came third in the election for the newly created role of Mayor of the West of England.
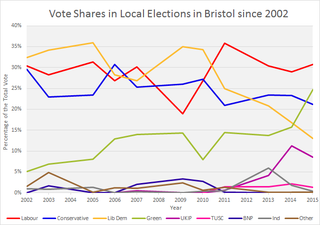
Bristol is a unitary authority and ceremonial county in England. Until 1 April 1996 it was a non-metropolitan district in Avon. Since 2012 it has also had a directly elected mayor.
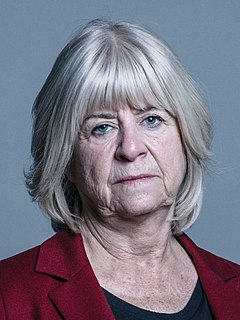
Barbara Lilian Janke, Baroness Janke is a British teacher and politician. She was the Liberal Democrat leader of Bristol City Council from 2005 to 2007 and from 2009 to 2012. She has been Councillor for Clifton ward since 1995. She was leader of the Liberal Democrat group since 1997, with a break from 2007 to 2008. In August 2014 Cllr Janke was named as one of six new Liberal Democrat working peers.
St George West is a district (Ward) of Bristol. Its councillors are Ron Stone and Peter Hammond . It can be found in the outer east of the city of Bristol. According to a report released by Bristol City Council, St George West has an average crime rate.
Bristol was a European Parliament constituency centred on Bristol in England, but covering much of Avon. Until 1984, it included parts of southern Gloucestershire and northwestern Wiltshire.
Sir Herbert Richard Nicholas OBE was a trade unionist and political organiser.
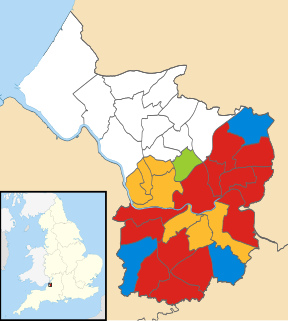
The 2011 Bristol City Council elections were held on Thursday 5 May 2011, for 24 seats, that being one third of the total number of councillors. The Liberal Democrats, who had won overall control of the council in 2009 and increased their majority in 2010, experienced a drop in support and lost 5 seats; 4 to the Labour Party and 1 to the Green Party, which gained its second ever council seat in Bristol. This meant that the Lib Dems no longer had a majority on the council. However, they continued to run the council, relying on opposition groups to vote through any proposal.
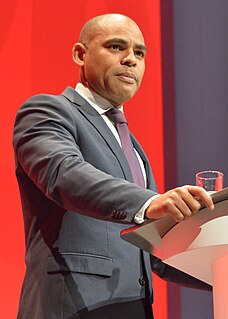
The Mayor of Bristol is the head of Bristol City Council. The Mayor is an elected politician who, along with the 70 members of Bristol City Council, is responsible for the strategic government of the city of Bristol, England. The role was created after a local referendum held on 3 May 2012, which followed the passage of the Localism Act 2011. 41,032 voted for an elected mayor and 35,880 voted against, with a turnout of 24%. An election for the new post was held on 15 November 2012.
The 2014 Bristol City Council election took place on 22 May 2014 to elect members of Bristol City Council in England, as part of the United Kingdom 2014 Local Elections.
The 2015 Bristol City Council election took place on 7 May 2015 to elect members of Bristol City Council in England. This was on the same day as other local elections.