| |||||||||||||||||||||||||||||||||
23 OF 70 seats (One Third) to Bristol City Council 36 seats needed for a majority | |||||||||||||||||||||||||||||||||
| |||||||||||||||||||||||||||||||||
|
The 2009 Bristol City Council elections were held on Thursday 4 June 2009, for 23 seats, that being one third of the total number of councillors. The Liberal Democrats who had been leading a minority administration, managed to win an overall majority of the council, the first time the party had achieved this on Bristol City Council. The Liberal Democrats were defending 11 seats, the Labour Party 10 and the Conservatives 2.
The Liberal Democrats are a liberal political party in the United Kingdom. They presently have 11 Members of Parliament in the House of Commons, 96 members of the House of Lords, and one member of the European Parliament. They also have five Members of the Scottish Parliament and a member each in the Welsh Assembly and London Assembly. The party reached the height of its influence in the early 2010s, forming a junior partner in a coalition government from 2010 to 2015. It is presently led by Vince Cable.
The Labour Party is a centre-left political party in the United Kingdom which has been described as an alliance of social democrats, democratic socialists and trade unionists. The party's platform emphasises greater state intervention, social justice and strengthening workers' rights.
The Conservative Party, officially the Conservative and Unionist Party, is a centre-right political party in the United Kingdom. Presently led by Theresa May, it has been the governing party since 2010. It presently has 314 Members of Parliament in the House of Commons, 249 members of the House of Lords, and 18 members of the European Parliament. It also has 31 Members of the Scottish Parliament, 12 members of the Welsh Assembly, eight members of the London Assembly and 9,008 local councillors. One of the major parties of UK politics, it has formed the government on 45 occasions, more than any other party.
The party standings following the election:
Party | 2007 Cllrs | Gain/Loss | 2009 Cllrs | |
---|---|---|---|---|
Conservative | 13 | +4 | 17 | |
Labour | 24 | -8 | 16 | |
Liberal Democrat | 32 | +4 | 36 | |
Green | 1 | - | 1 | |
Total | 70 | - | 70 | |
Party | Candidate | Votes | % | ± | |
---|---|---|---|---|---|
Liberal Democrat | Jon Charles Rogers | 1,978 | 47.84 | ||
Green | Daniella Elsa Radice | 1,283 | 31.03 | ||
Labour | Mazhar Iqbal | 542 | 13.11 | ||
Respect | Jo Benefield | 167 | 4.04 | ||
Conservative | Marian Ena Ovonlen | 165 | 3.99 | ||
Majority | 695 | 16.81 | |||
Liberal Democrat hold | Swing | ||||
Party | Candidate | Votes | % | ± | |
---|---|---|---|---|---|
Conservative | Siobhan Kennedy-Hall | 1,169 | 34.6 | ||
Labour | Brian Peter Mead | 943 | 27.91 | ||
BNP | Ron George | 375 | 11.10 | ||
Liberal Democrat | Pauline Mary Allen | 360 | 10.65 | ||
English Democrat | Stephen Michael Wright | 294 | 8.7 | ||
Green | Justin Michael Quinnell | 238 | 7.04 | ||
Majority | 226 | 6.69 | |||
Conservative gain from Labour | Swing | ||||
Party | Candidate | Votes | % | ± | |
---|---|---|---|---|---|
Liberal Democrat | Bev Knott | 2,210 | 52.02 | ||
Green | Martin Harvey | 949 | 22.34 | ||
Labour | David Ian Jepson | 618 | 14.55 | ||
Conservative | Richard Jonathan Zaltman | 471 | 11.09 | ||
Majority | 1261 | 29.68 | |||
Liberal Democrat hold | Swing | ||||
Party | Candidate | Votes | % | ± | |
---|---|---|---|---|---|
Liberal Democrat | Mark Michael Wright | 1,259 | 47.62 | ||
Green | Donald Brown | 567 | 21.44 | ||
Conservative | Adam Beda Tayler | 451 | 17.06 | ||
Labour | Rebecca Gordge | 367 | 13.88 | ||
Majority | 692 | 26.18 | |||
Liberal Democrat hold | Swing | ||||
Party | Candidate | Votes | % | ± | |
---|---|---|---|---|---|
Liberal Democrat | Trevor John Blythe | 1,340 | 42.46 | ||
Conservative | Harriet Alice Ann Levett | 858 | 27.19 | ||
Green | Gundula Dorey | 592 | 18.76 | ||
Labour | Rosemary Patricia Chamberlin | 366 | 11.60 | ||
Majority | 482 | 15.27 | |||
Liberal Democrat hold | Swing | ||||
Party | Candidate | Votes | % | ± | |
---|---|---|---|---|---|
Liberal Democrat | Simon Timothy Cook | 1,321 | 47.95 | ||
Conservative | Stephen Simmons | 884 | 32.09 | ||
Green | John Mark Hills | 332 | 12.05 | ||
Labour | Laurence David Newman | 218 | 7.91 | ||
Majority | 437 | 15.86 | |||
Liberal Democrat hold | Swing | ||||
Party | Candidate | Votes | % | ± | |
---|---|---|---|---|---|
Liberal Democrat | Anthony Leonard Negus | 1,389 | 44.89 | ||
Green | Geoff Collard | 706 | 22.82 | ||
Conservative | Eleanor Louise Downey | 573 | 18.52 | ||
Labour | Karin Marguerite Smyth | 426 | 13.77 | ||
Majority | 683 | 22.07 | |||
Liberal Democrat hold | Swing | ||||
Party | Candidate | Votes | % | ± | |
---|---|---|---|---|---|
Liberal Democrat | John Francis Keily | 1,290 | 35.24 | ||
Labour | Mohammed Arif | 1,116 | 30.48 | ||
Green | Katie Buse | 938 | 25.62 | ||
Conservative | David Thomas Harrison Lewis | 220 | 6.01 | ||
Respect | Mo Ouammi | 97 | 2.65 | ||
Majority | 174 | 4.76 | |||
Liberal Democrat hold | Swing | ||||
Party | Candidate | Votes | % | ± | |
---|---|---|---|---|---|
Liberal Democrat | Steve Comer | 1,310 | 43.74 | ||
Labour | Mike Wollacott | 717 | 23.94 | ||
Conservative | Derek Albert Edward Fey | 542 | 18.10 | ||
Green | Glenn Vowles | 426 | 14.22 | ||
Majority | 593 | 19.8 | |||
Liberal Democrat hold | Swing | ||||
Party | Candidate | Votes | % | ± | |
---|---|---|---|---|---|
Conservative | James Andrew Hale Stevenson | 1,234 | 37.10 | ||
Labour | Bill Payne | 926 | 27.84 | ||
Liberal Democrat | Barry John Cash | 442 | 13.29 | ||
BNP | Colin Richard Chidsey | 368 | 11.06 | ||
Green | Josephine McLellan | 356 | 10.7 | ||
Majority | 308 | 9.26 | |||
Conservative gain from Labour | Swing | ||||
Party | Candidate | Votes | % | ± | |
---|---|---|---|---|---|
Conservative | Chris Windows | 1,138 | 40.64 | ||
Labour | Derek Stephen Pickup | 817 | 29.18 | ||
Liberal Democrat | Christopher William Luffingham | 330 | 11.79 | ||
English Democrat | Raymond Christopher Carr | 301 | 10.75 | ||
Green | Nigel Pready | 214 | 7.64 | ||
Majority | 321 | 11.46 | |||
Conservative gain from Labour | Swing | ||||
Party | Candidate | Votes | % | ± | |
---|---|---|---|---|---|
Liberal Democrat | Steve Comer | 1,786 | 42.52 | ||
Conservative | Liz Radford | 1,713 | 40.79 | ||
Green | Steve Meek | 374 | 8.90 | ||
Labour | Judith Mary Sluglett | 327 | 7.79 | ||
Majority | 73 | 1.73 | |||
Liberal Democrat hold | Swing | ||||
Party | Candidate | Votes | % | ± | |
---|---|---|---|---|---|
Liberal Democrat | Patrick Hassell | 1,229 | 37.42 | ||
Labour | Noreen Patricia Daniels | 871 | 26.52 | ||
Conservative | Dave Lake | 495 | 15.07 | ||
BNP | Chris Pegler | 428 | 13.03 | ||
Green | Leon Roman Quinn | 261 | 7.95 | ||
Majority | 358 | 10.9 | |||
Liberal Democrat gain from Labour | Swing | ||||
Party | Candidate | Votes | % | ± | |
---|---|---|---|---|---|
Liberal Democrat | Cheryl Ann | 1,603 | 41.96 | ||
Conservative | Rowland Henry Webb | 1,151 | 30.13 | ||
Labour | Rosalie Walker | 647 | 16.94 | ||
Green | Jude English | 284 | 7.43 | ||
BNP | Christine Margaret Ogden | 135 | 3.53 | ||
Majority | 452 | 11.83 | |||
Liberal Democrat gain from Labour | Swing | ||||
Party | Candidate | Votes | % | ± | |
---|---|---|---|---|---|
Liberal Democrat | Simon Rayner | 1,396 | 47.27 | ||
Conservative | Adrian Peter Clarke | 667 | 22.59 | ||
Labour | Jude Price | 550 | 18.63 | ||
Green | Jacqueline Ann Hearn | 340 | 11.51 | ||
Majority | 729 | 24.68 | |||
Liberal Democrat gain from Labour | Swing | ||||
Party | Candidate | Votes | % | ± | |
---|---|---|---|---|---|
Labour | Brenda Patricia Hugill | 914 | 31.53 | ||
Liberal Democrat | Rae Gingell | 905 | 31.22 | ||
Conservative | Sheena Begum | 484 | 16.7 | ||
Green | Christine Prior | 360 | 12.42 | ||
BNP | Janet Ashman | 236 | 8.14 | ||
Majority | 9 | 0.31 | |||
Labour hold | Swing | ||||
Party | Candidate | Votes | % | ± | |
---|---|---|---|---|---|
Liberal Democrat | Guy James Baiden Poultney | 923 | 36.54 | ||
Labour | David Alexander Bradley | 516 | 20.43 | ||
Respect | Jerry Hicks | 377 | 14.92 | ||
Conservative | Tony Lee | 309 | 12.23 | ||
BNP | John Hooper | 210 | 8.31 | ||
Green | Christina Mary Quinnell | 191 | 7.56 | ||
Majority | 407 | 16.11 | |||
Liberal Democrat hold | Swing | ||||
Party | Candidate | Votes | % | ± | |
---|---|---|---|---|---|
Liberal Democrat | Fi Hance | 1,453 | 38.23 | ||
Green | David Michael Joseph | 967 | 25.44 | ||
Conservative | James Michael Barlow | 865 | 22.76 | ||
Labour | Helen Frances Sproates | 516 | 13.58 | ||
Majority | 486 | 12.79 | |||
Liberal Democrat hold | Swing | ||||
Party | Candidate | Votes | % | ± | |
---|---|---|---|---|---|
Liberal Democrat | Jacqueline Greta Bowles | 828 | 32.13 | ||
Labour | Peter Warren Hammond | 808 | 31.35 | ||
Conservative | Kyle Smith | 486 | 18.86 | ||
English Democrat | Toby Hector | 295 | 11.45 | ||
Green | Lela Helen McTernan | 160 | 6.21 | ||
Majority | 20 | 0.78 | |||
Liberal Democrat gain from Labour | Swing | ||||
Party | Candidate | Votes | % | ± | |
---|---|---|---|---|---|
Conservative | Alex Pearce | 1,185 | 35.83 | ||
Labour | Charlie Price | 733 | 22.17 | ||
BNP | Michael John Carey | 575 | 17.39 | ||
Liberal Democrat | Paul Elvin | 469 | 14.18 | ||
Green | Graham Hugh Davey | 345 | 10.43 | ||
Majority | 452 | 13.66 | |||
Conservative gain from Labour | Swing | ||||
Party | Candidate | Votes | % | ± | |
---|---|---|---|---|---|
Labour | Ron Stone | 892 | 31.65 | ||
Liberal Democrat | Emma Jane Nyhan | 801 | 28.42 | ||
Conservative | Colin Robert Bretherton | 436 | 15.47 | ||
Green | Nick Foster | 293 | 10.4 | ||
BNP | Chris Stocks | 211 | 7.49 | ||
English Democrat | Lee Pickering | 185 | 6.56 | ||
Majority | 91 | 3.23 | |||
Labour hold | Swing | ||||
Party | Candidate | Votes | % | ± | |
---|---|---|---|---|---|
Conservative | Peter John Abraham | 2,155 | 58.86 | ||
Liberal Democrat | Mark James | 854 | 23.33 | ||
Green | Keith Vivian Wiltshire | 373 | 10.19 | ||
Labour | Dianne Elizabeth Manning | 279 | 7.62 | ||
Majority | 1301 | 35.53 | |||
Conservative hold | Swing | ||||
Party | Candidate | Votes | % | ± | |
---|---|---|---|---|---|
Conservative | Geoffrey Richard Gollop | 2,198 | 51.84 | ||
Liberal Democrat | Graham Christopher Donald | 1231 | 29.03 | ||
Green | Alex Dunn | 374 | 8.82 | ||
Labour | Arthur Massey | 289 | 6.82 | ||
English Democrat | Sara Box | 148 | 3.49 | ||
Majority | 967 | 22.81 | |||
Conservative hold | Swing | ||||
The city of Bristol, England, is a unitary authority, represented by four MPs representing seats wholly within the city boundaries. As well as these, Filton and Bradley Stoke covers the northern urban fringe in South Gloucestershire and the north eastern urban fringe is in the Kingswood constituency. The overall trend of both local and national representation became left of centre, favouring the Labour Party and Liberal Democrats during the latter 20th century, but there was a shift to the right in the 2010 general election. The city has a tradition of local activism, with environmental issues and sustainable transport being prominent issues in the city.
Bristol West is a borough constituency represented in the House of Commons of the Parliament of the United Kingdom. It covers the central and western parts of Bristol.
Bristol East is a constituency recreated in 1983 covering the eastern part of the City of Bristol, represented in the House of Commons of the UK Parliament since 2005 by Kerry McCarthy of the Labour Party. An earlier guise of the seat existed between 1885 and 1950.
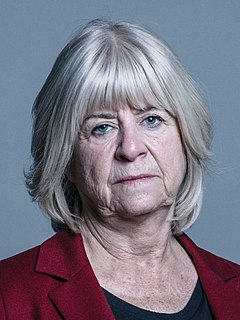
Barbara Lilian Janke, Baroness Janke is a British teacher and politician. She was the Liberal Democrat leader of Bristol City Council from 2005 to 2007 and from 2009 to 2012. She has been Councillor for Clifton ward since 1995. She was leader of the Liberal Democrat group since 1997, with a break from 2007 to 2008. In August 2014 Cllr Janke was named as one of six new Liberal Democrat working peers.
Sunderland City Council is the local authority of the City of Sunderland in Tyne and Wear, England. It is a metropolitan district council, one of five in Tyne and Wear and one of 36 in the metropolitan counties of England, and provides the majority of local government services in Sunderland.
The 2008 Hull City Council election took place on 1 May 2008 to elect members of Hull City Council in England. One third of the council was up for election and the Liberal Democrats retained control of the council with an increased majority from a situation of ruling under no overall control.
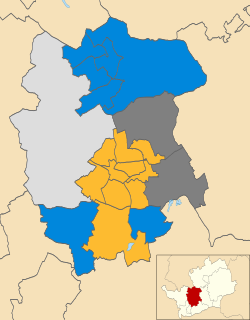
The 2008 St Albans City and District Council election took place on 1 May 2008 to elect members of St Albans District Council in Hertfordshire, England. One third of the council was up for election and the Liberal Democrats gained overall control of the council from no overall control.
The 2007 Hull City Council election took place on 3 May 2007 to elect members of Hull City Council in England. One third of the council was up for election and the Liberal Democrats gained overall control of the council from no overall control. Overall turnout was 27%.
The 2002 St Albans City and District Council election took place on 2 May 2002 to elect members of St Albans District Council in Hertfordshire, England. One third of the council was up for election and the council stayed under no overall control.
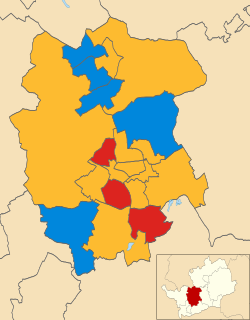
The 2003 St Albans City and District Council election took place on 1 May 2003 to elect members of St Albans District Council in Hertfordshire, England. One third of the council was up for election and the council stayed under no overall control.
The 2004 St Albans City and District Council election took place on 10 June 2004 to elect members of St Albans District Council in Hertfordshire, England. One third of the council was up for election and the council stayed under no overall control.
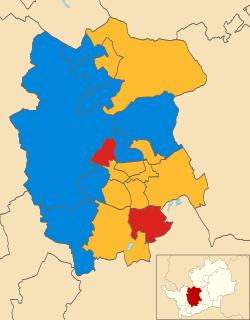
The 2006 St Albans City and District Council election took place on 4 May 2006 to elect members of St Albans District Council in Hertfordshire, England. One third of the council was up for election and the Liberal Democrats gained overall control of the council from no overall control.
The 2007 St Albans City and District Council election took place on 3 May 2007 to elect members of St Albans District Council in Hertfordshire, England. One third of the council was up for election and the Liberal Democrats lost overall control of the council to no overall control.
The 2010 Winchester Council election took place on 6 May 2010 to elect members of Winchester District Council in Hampshire, England. One third of the council was up for election and the Liberal Democrats gained overall control of the council from the Conservative party.
The 2010 Bristol City Council elections were held on Thursday 6 May 2010, for 23 seats, that being one third of the total number of councillors. The Liberal Democrats, who had won overall control of the council in 2009, increased their majority to six seats.
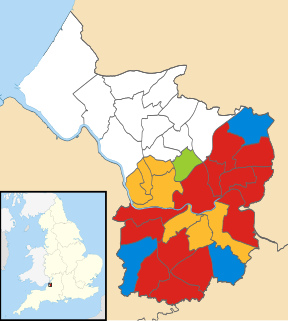
The 2011 Bristol City Council elections were held on Thursday 5 May 2011, for 24 seats, that being one third of the total number of councillors. The Liberal Democrats, who had won overall control of the council in 2009 and increased their majority in 2010, experienced a drop in support and lost 5 seats; 4 to the Labour Party and 1 to the Green Party, which gained its second ever council seat in Bristol. This meant that the Lib Dems no longer had a majority on the council. However, they continued to run the council, relying on opposition groups to vote through any proposal.
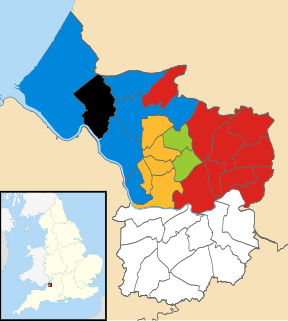
Elections for one third of Bristol City Council were held on 2 May 2013 as part of the United Kingdom local elections, 2013. No party gained overall control.
The 2015 Bristol City Council election took place on 7 May 2015 to elect members of Bristol City Council in England. This was on the same day as other local elections.
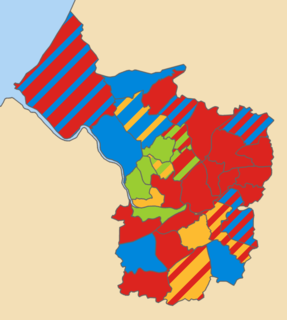
The 2016 Bristol City Council election took place on Thursday 5 May 2016, alongside nationwide local elections. Following a boundary review, the number of wards in the City was reduced to 34, with each electing one, two or three Councillors. The overall number of Councillors remained 70, with all seats are up for election at the same time. Elections would then be held every 4 years.
The 1999 Bristol City Council election took place on 6 May 1999, on the same day as other local elections. All seats were up for election due to boundary changes, with each ward electing 2 councillors. The total number of seats on the council increased by 2 due to the creation of a new ward: Clifton East.