Wiltshire Council election, 2009

Last updated

County Hall, Wiltshire Council's headquarters in Trowbridge WiltshireCouncilTrowbridge.jpg
County Hall, Wiltshire Council's headquarters in Trowbridge
Results by electoral division. Key:
Conservative
Liberal Democrat
Labour
Independent
Devizes Guardians Wiltshire UK local election 2009 map.svg
Results by electoral division. Key:
  Conservative
  Liberal Democrat
  Labour
  Independent
  Devizes Guardians

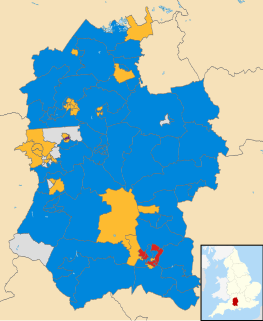
Elections to Wiltshire Council, a new unitary authority, were held on 4 June 2009.

Wiltshire Council British administrative body

Wiltshire Council is a council for the unitary authority of Wiltshire in South West England, created in 2009. It is the successor authority to Wiltshire County Council (1889–2009) and the four district councils of Kennet, North Wiltshire, Salisbury, and West Wiltshire, all of which were created in 1974 and abolished in 2009.

A unitary authority is a type of local authority that has a single tier and is responsible for all local government functions within its area or performs additional functions which elsewhere in the relevant country are usually performed by national government or a higher level of sub-national government.

Contents

The whole council of ninety-eight members was up for election, with each member to be elected in a single-member electoral division. None of the new electoral divisions was identical to any of the divisions or wards of the council's predecessors, Wiltshire County Council and the four district councils within its area, Kennet, North Wiltshire, Salisbury and West Wiltshire.

The wards and electoral divisions in the United Kingdom are electoral districts at sub-national level represented by one or more councillors. The ward is the primary unit of English electoral geography for civil parishes and borough and district councils, electoral ward is the unit used by Welsh principal councils, while the electoral division is the unit used by English county councils and some unitary authorities. Each ward/division has an average electorate of about 5,500 people, but ward-population counts can vary substantially. As at the end of 2014 there were 9,456 electoral wards/divisions in the UK.

Wiltshire County Council

Wiltshire County Council was the county council of Wiltshire in the South West of England, an elected local Government body responsible for most local government services in the county.

Districts of England Level of subnational division of England used for the purposes of local government

The districts of England are a level of subnational division of England used for the purposes of local government. As the structure of local government in England is not uniform, there are currently four principal types of district-level subdivision. There are a total of 317 districts made up of 36 metropolitan boroughs, 32 London boroughs, 192 non-metropolitan districts, and 55 unitary authorities, as well as the City of London and the Isles of Scilly which are also districts, but do not correspond to any of these categories. Some districts are styled as boroughs, cities, or royal boroughs; these are purely honorific titles, and do not alter the status of the district. All boroughs and cities, and a few districts, are led by a mayor who in most cases is a ceremonial figure elected by the district council, but—after local government reform—is occasionally a directly elected mayor who makes most of the policy decisions instead of the council.

As with other county elections in England, these local elections in Wiltshire took place on the same day as the European elections of 2009. The Wiltshire County Council election, 2005, the last to the old county council, coincided with the general election of 2005, and the county elections of 1997 and 2001 had also coincided with general elections.

Reorganization

Wiltshire's "two tier" system of local government until 2009 was typical of English shire counties, with the county, excluding the pre-existing unitary authority of Swindon, being sub-divided into four local government districts. However, the Department for Communities and Local Government announced on 25 July 2007 that with effect from 1 April 2009 Wiltshire was to be served by a new unitary authority, replacing Wiltshire County Council and the four district councils within its area, with Swindon continuing as a separate unitary authority. [1]

Swindon town in Wiltshire, England

Swindon is a large town in Wiltshire, South West England, between Bristol, 35 miles to the west, and Reading, the same distance to the east; the town is 71 miles (114 km) west of London. At the 2011 census, it had a population of 182,441. The Town Development Act 1952 led to a major increase in its population.

Although the new authority came into being on 1 April 2009, the date on which the four district councils ceased to exist, the first elections to the new council were not held until 4 June. For some two months, the role of elected members of the new authority was carried out by the 48 outgoing Wiltshire county councillors and by an "Implementation Executive" consisting of eight members appointed from the outgoing county council and two members from each of the outgoing districts.

Results

Wiltshire Council election, 2009
PartySeatsGainsLossesNet gain/lossSeats %Votes %Votes+/−
  Conservative 62 n/a n/a n/a 63.3 45.3 66,985 n/a
  Liberal Democrat 24 n/a n/a n/a 24.5 31.4 46,373 n/a
  Independent 7 n/a n/a n/a 7.1 8.7 12,905 n/a
  UKIP 0 n/a n/a n/a 0 7.0 10,350 n/a
  Labour 2 n/a n/a n/a 2.0 4.6 6,852 n/a
  Devizes Guardians 3 n/a n/a n/a 3.0 1.0 1,503 n/a
  Green 0 n/a n/a n/a 0 0.9 1,322 n/a
  BNP 0 n/a n/a n/a 0 0.8 1,153 n/a
  English Democrat 0 n/a n/a n/a 0 0.3 468 n/a

Electoral division results

Aldbourne and Ramsbury

Aldbourne and Ramsbury
PartyCandidateVotes%±
Conservative Christopher Paul Humphries 1003 48.7
Independent Michael Andrew Edmonds 873 42.4
UKIP Jennifer Lee Puttick 164 8.0
Majority 130
Turnout 50.7

Alderbury and Whiteparish

Alderbury and Whiteparish
PartyCandidateVotes%±
Conservative Richard Britton 905 58.3
Liberal Democrat Colin Richard Baxter 370 23.9
UKIP Michael Wykeham 263 17.0
Majority 535
Turnout 45.6

Amesbury East

Amesbury East
PartyCandidateVotes%±
Conservative John Cornelis Noeken 621 50.2
UKIP Peter Leslie Cowdrey 322 26.1
Liberal Democrat Janet Mary Swindlehurst 283 22.9
Majority 299
Turnout 34.5

Amesbury West

Amesbury West
PartyCandidateVotes%±
Conservative Fred Westmoreland 635 46.0
Liberal Democrat John Thomas Swindlehurst 329 23.9
UKIP Brian Head 269 19.5
BNP Harry McPhie 143 10.4
Majority 306
Turnout 38.3

Bourne and Woodford Valley

Bourne and Woodford Valley
PartyCandidateVotes%±
Conservative Mike Hewitt 984 60.2
Liberal Democrat Naomi Piner 295 18.1
UKIP Jennifer Margaret MacDougall 257 15.7
Labour Virginia McLennan 89 5.4
Majority 691
Turnout 47.0

Box and Colerne

Box and Colerne
PartyCandidateVotes%±
Conservative Sheila Gladys Parker 689 35.9
Liberal Democrat Patricia Lillian Moore 641 33.4
Green Phillip Christopher Chamberlain 317 16.5
UKIP Richard Crowder 158 8.2
Labour Stephen Charles Wheeler 68 3.5
BNP Michael Howson 47 2.4
Majority 48
Turnout 50.0

Bradford on Avon North

Bradford on Avon North
PartyCandidateVotes%±
Liberal Democrat Rosemary Brown 1244 59.2
Conservative Virginia Rose Fortescue 474 22.6
Independent David James Binding 276 13.1
Labour James Henry Tracey 96 4.6
Majority 968
Turnout 55.4

Bradford on Avon South

Bradford on Avon South
PartyCandidateVotes%±
Liberal Democrat Malcolm George Hewson 1330 64.0
Conservative Gwen Allison 545 26.2
Green Ellie Crouch 142 6.8
Labour Angela Womersley 50 2.4
Majority 785
Turnout 54.7

Brinkworth

Brinkworth
PartyCandidateVotes%±
Conservative Toby Russell Sturgis 1277 67.5
Liberal Democrat Frances Ann Goldstone 489 25.8
Labour Arnold Shaw 101 5.3
Majority 788
Turnout 51.3

Bromham, Rowde and Potterne

Bromham, Rowde and Potterne
PartyCandidateVotes%±
Conservative Philip Alfred Brown 751 43.2
UKIP Chris Cotton 322 18.5
Liberal Democrat Alan Rankin 318 18.3
Green Samantha Fletcher 255 14.7
Labour Andrew Derek Peter Jones 84 4.8
Majority 429
Turnout 44.8

Bulford, Allington and Figheldean

Bulford, Allington and Figheldean
PartyCandidateVotes%±
Conservative John Smale 581 44.9
Liberal Democrat John Richardson 429 33.2
UKIP Christopher Franklin 168 13.0
BNP Joyce Holt 115 8.9
Majority 152
Turnout 37.4

Burbage and the Bedwyns

Burbage and the Bedwyns
PartyCandidateVotes%±
Conservative Stuart Wheeler 1,050 62.8
Liberal Democrat Anthony Sycamore 397 23.7
UKIP Michael Bird 225 13.5
Majority 653
Turnout 43.6

By Brook

By Brook
PartyCandidateVotes%±
Conservative Jane Antoinette Scott 1172 67.9
Liberal Democrat Catherine Sarah Messenger 241 14.0
UKIP John William Knight 197 11.4
Labour Christine Reid 68 3.9
BNP Susan Joan Simpkins 44 2.5
Majority 931
Turnout 50.9

Calne Central

Calne Central
PartyCandidateVotes%±
Liberal Democrat Howard Robin Marshall 655 48.9
Conservative Charles Madron Reginald Boase 654 48.8
Majority 1
Turnout 41.3

Calne Chilvester and Abberd

Calne Chilvester and Abberd
PartyCandidateVotes%±
Conservative Tony Trotman 581 43.8
Liberal Democrat Ross Henning 472 35.6
UKIP Julie Reid 208 15.7
Green Charlotte Gantlett 63 4.7
Majority 109
Turnout 39.0

Calne North

Calne North
PartyCandidateVotes%±
Conservative Chuck Berry 420 41.7
Liberal Democrat Peter Dolman 412 40.9
Green Sophy Fearnley-Whittingstall 164 16.3
Majority 8
Turnout 30.2

Calne Rural

Calne Rural
PartyCandidateVotes%±
Conservative Christine Crisp 723 45.0
Independent Nancy Suzanne Bryant 621 38.7
Liberal Democrat Sally Ann Chandler 250 15.6
Majority 102
Turnout 47.6

Calne South and Cherhill

Calne South and Cherhill
PartyCandidateVotes%±
Conservative Alan Kenneth Hill 944 53.2
Liberal Democrat Glenis Jean Ansell 782 44.1
UKIP Jennifer Margaret MacDougall 257 15.7
Labour Virginia McLennan 89 5.4
Majority 162
Turnout 47.5

Chippenham Cepen Park and Derriads

Chippenham Cepen Park and Derriads
PartyCandidateVotes%±
Conservative Peter John Hutton 849 60.4
Liberal Democrat Jesse Lake 438 31.2
Labour Pamela Witts 102 7.3
Majority 411
Turnout 41.0

Chippenham Cepen Park and Redlands

Chippenham Cepen Park and Redlands
PartyCandidateVotes%±
Conservative Nina Phillips 783 58.1
Liberal Democrat June Margaret Wood 275 20.4
Labour Maureen Frances Lloyd 171 12.7
BNP George Dale 114 8.5
Majority 508
Turnout 38.2

Chippenham Hardenhuish

Chippenham Hardenhuish
PartyCandidateVotes%±
Liberal Democrat Paul Richard Darby 992 62.3
Conservative Elizabeth Annette Kennedy 515 32.3
Labour Stephen William Abbott 68 4.3
Majority 477
Turnout 46.6

Chippenham Hardens and England

Chippenham Hardens and England
PartyCandidateVotes%±
Liberal Democrat Bill Douglas 584 50.9
Conservative Helen Rose Plenty 449 39.1
Labour Julie Lawrence 93 8.1
Majority 135
Turnout 36.4

Chippenham Lowden and Rowden

Chippenham Lowden and Rowden
PartyCandidateVotes%±
Liberal Democrat Judy Rooke 466 39.4
Conservative Martin Singlehurst 370 31.2
UKIP John Clifford 228 19.3
Labour Jeremy Comerford 73 6.2
Independent Alan Phillips 47 4.0
Majority 96
Turnout 35.6

Chippenham Monkton

Chippenham Monkton
PartyCandidateVotes%±
Liberal Democrat Chris Caswill 1,073 69.4
Conservative Janet Giles 310 20.0
UKIP Henry Collier 114 7.4
Labour Benjamin Lawrence 50 3.2
Majority 763
Turnout 55.2

Chippenham Pewsham

Chippenham Pewsham
PartyCandidateVotes%±
Liberal Democrat Mark Packard 806 55.9
Conservative Viv Vines 576 39.9
Labour Ian Perry 60 4.2
Majority 230
Turnout 43.1

Chippenham Queens and Sheldon

Chippenham Queens and Sheldon
PartyCandidateVotes%±
Liberal Democrat Desna Allen 700 51.9
Conservative Andy Phillips 558 41.3
Labour Brian Healy Lab 92 6.8
Majority 142
Turnout 40.3

Corsham Pickwick

Corsham Pickwick
PartyCandidateVotes%±
Conservative Alan MacRae 527 34.4
Liberal Democrat Lorraine Roberts-Rance 374 24.4
Independent Allan Charles Bosley 353 23.0
Labour Christopher John Lynch 154 10.0
BNP Michael Simpkins 111 7.2
Majority 153
Turnout 40.6

Corsham Town

Corsham Town
PartyCandidateVotes%±
Conservative Peter Roy Davis 788 37.8
Liberal Democrat Issy Langsford 673 32.3
Independent Nicholas John James Keyworth 487 23.4
BNP Tristan David Simpkins 68 3.3
Labour Judith Margaret Hible 58 2.8
Majority 115
Turnout 54.7

Corsham Without and Box Hill

Corsham Without and Box Hill
PartyCandidateVotes%±
Conservative Richard Leslie Tonge 1208 62.2
Liberal Democrat Linda Mary Packard 480 24.7
Labour Hilary Ann Foord 147 7.6
BNP Michael Andrew Deacon 101 5.2
Majority 728
Turnout 49.6

Cricklade and Latton

Cricklade and Latton
PartyCandidateVotes%±
Liberal Democrat Peter Anthony Colmer 637 34.5
Independent Bob Jones 621 33.6
Conservative Tony Clements 577 31.2
Majority 16
Turnout 47.3

Devizes and Roundway South

Devizes and Roundway South
PartyCandidateVotes%±
Devizes Guardians Jeff Ody 549 35.9
Conservative Ray Parsons 475 31.1
Labour Ray Taylor 219 14.3
UKIP Carole Henson 153 10.0
Liberal Democrat Richard Pitts 127 8.3
Majority 74
Turnout 43.2

Devizes East

Devizes East
PartyCandidateVotes%±
Devizes Guardians Jane Mary Burton 369 34.3
Conservative Peter Evans 321 29.9
UKIP John Albert Ottaway 162 15.1
Labour Noel Woolrych 132 12.3
Liberal Democrat Jackie Watson 84 7.8
Majority 48
Turnout 34.5

Devizes North

Devizes North
PartyCandidateVotes%±
Devizes Guardians Nigel Denys Carter 381 31.6
Conservative Paula Mary Winchcombe 367 30.5
UKIP Ernie Giles 148 12.3
Liberal Democrat Rick Rowland 128 10.6
Labour Ian Mark Fletcher 101 8.4
Green Mark Fletcher 72 6.0
Majority 14
Turnout 41.0

Downton and Ebble Valley

Downton and Ebble Valley
PartyCandidateVotes%±
Conservative Julian Paul Johnson 887 54.5
Liberal Democrat Greg Condliffe 463 28.4
UKIP Pauline Pratt 263 16.1
Majority 424
Turnout 45.2

Durrington and Larkhill

Durrington and Larkhill
PartyCandidateVotes%±
Liberal Democrat Graham Wright 1056 59.5
Conservative Mark Baker 466 26.6
UKIP James Steele 152 8.6
BNP Paul Holt 93 5.2
Majority 590
Turnout 40.1

Ethandune

Ethandune
PartyCandidateVotes%±
Conservative Julie Swabey 1,004 60.9
Liberal Democrat Christine Chilcott 467 28.3
Labour Janet Elizabeth Snooks 157 9.5
Majority 537
Turnout 45.9

Fovant and Chalke Valley

Fovant and Chalke Valley
PartyCandidateVotes%±
Conservative Jose Green 1,210 71.6
Liberal Democrat Stephen Radford 462 27.3
Majority 748
Turnout 49.2

Hilperton

Hilperton
PartyCandidateVotes%±
Independent Ernie Clark 1,402 77.2
Conservative Trace Senior 250 13.8
Liberal Democrat Poz Watson 162 8.9
Majority 1,152
Turnout 50.1

Holt and Staverton

Holt and Staverton
PartyCandidateVotes%±
Liberal Democrat Trevor William Carbin 811 55.5
Conservative Carolyn Joy Walker 590 40.4
Labour Barrie Womersley 44 3.0
Majority 221
Turnout 45.8

Kington

Kington
PartyCandidateVotes%±
Conservative Howard Greenman 1178 67
Liberal Democrat Michael Frank Short 429 24.4
Labour Sam Knight 137 7.8
Majority 749
Turnout 49

Laverstock, Ford and Old Sarum

Laverstock, Ford and Old Sarum
PartyCandidateVotes%±
Labour Ian David McLennan 652 47.6
Conservative Catherine Louise Hollis 409 29.9
UKIP Patrick Anthony Houston 180 13.1
Liberal Democrat Hilary Susan Phelps 121 8.8
Majority 243
Turnout 49.6

Ludgershall and Perham Down

Ludgershall and Perham Down
PartyCandidateVotes%±
Conservative Chris Williams 590 51.7
UKIP Frank Baydon Bovingdon 277 24.3
Liberal Democrat Bryan Derek Castle 170 14.9
Labour Gary Gordon 100 8.8
Majority 313
Turnout 31.9

Lyneham

Lyneham
PartyCandidateVotes%±
Conservative Allison Mary Bucknell 900 62.0
Liberal Democrat John Allen Webb 396 27.3
Independent James Sidney William Elford 146 10.1
Majority 504
Turnout 40.1

Malmesbury

Malmesbury
PartyCandidateVotes%±
Liberal Democrat Simon John Killane 823 45.2
Conservative Rachel Lucy Miles 549 30.2
Independent Ray Sanderson 227 12.5
UKIP Bill Blake 162 8.9
Labour Frederick Albert Price 44 2.4
Majority 274
Turnout 49.2

Marlborough East

Marlborough East
PartyCandidateVotes%±
Liberal Democrat Peggy Ann Dow 636 51.3
Conservative Marian Hannaford 377 30.4
UKIP Caroline Georgina Goodfellow 159 12.8
Labour Brian Andrew Lawrence McClintock 65 5.2
Majority 259
Turnout 40.8

Marlborough West

Marlborough West
PartyCandidateVotes%±
Independent Nicholas Fogg 886 58.4
Conservative Stewart Dobson 482 31.8
UKIP Lincoln Williams 82 5.4
Labour Madeleine Rosina Urquhart 52 3.4
Majority 404
Turnout 50.0

Melksham Central

Melksham Central
PartyCandidateVotes%±
Liberal Democrat Steve Petty 554 45.4
Conservative Philip Alford 534 43.8
Labour Jo Sibley 110 9.0
Majority 20
Turnout 32.7

Melksham North

Melksham North
PartyCandidateVotes%±
Conservative Rod Eaton 535 51.2
Liberal Democrat Andrew Robert Barnett Clayton 425 40.7
Labour Margaret Ethel White 66 6.3
Majority 110
Turnout 31.5

Melksham South

Melksham South
PartyCandidateVotes%±
Liberal Democrat Jon Hubbard 1117 63.9
Conservative Richard Wiltshire 536 30.7
Labour James McGee 87 5.0
Majority 581
Turnout 44.2

Melksham Without North

Melksham Without North
PartyCandidateVotes%±
Conservative Mark Griffiths 906 57.8
Liberal Democrat David Bolwell 536 34.2
Labour Gregory Coombes 126 8.0
Majority 370
Turnout 46.4

Melksham Without South

Melksham Without South
PartyCandidateVotes%±
Conservative Roy While 571 41.5
Liberal Democrat Terry Welch 361 26.3
UKIP Paul Carter 162 11.8
Independent Michael Sankey 116 8.4
BNP Mark Kennedy 92 6.7
Labour Louise Smith 73 5.3
Majority 210
Turnout 37.3

Mere

Mere
PartyCandidateVotes%±
Independent George Jeans 1188 54.4
Conservative Catherine Spencer 887 40.7
UKIP Patricia Walker 107 4.9
Majority 301
Turnout 61.4

Minety

Minety
PartyCandidateVotes%±
Conservative Carole Soden 1464 75.5
Liberal Democrat Russell Dabson 402 20.7
Labour Pauline Smith 73 3.8
Majority 1062
Turnout 51.1

Nadder and East Knoyle

Nadder and East Knoyle
PartyCandidateVotes%±
Conservative Bridget Wayman 932 52.0
Independent David Parker 593 33.4
UKIP David Boyden 258 14.5
Majority 330
Turnout 51.6

Pewsey

Pewsey
PartyCandidateVotes%±
Conservative Jeremy Kunkler 878 50.4
Independent John Cooke 417 23.9
Liberal Democrat Tricia Cavill 185 10.6
UKIP Marilyn Day 174 10.0
Labour Christine Jenkins 88 5.1
Majority 461
Turnout 47.3

Pewsey Vale

Pewsey Vale
PartyCandidateVotes%±
Conservative Robert Wallace Strachan Hall 762 44.3
Liberal Democrat Fiona Clare Hornby 362 21.1
Independent Tony Molland 276 16.1
UKIP Brian John Doherty 249 14.5
Labour Frank Jeffrey 66 3.8
Majority 400
Turnout 47.9

Purton

Purton
PartyCandidateVotes%±
Conservative Jacqui Lay 753 52.4
Liberal Democrat Trudie Clarkson 357 24.8
Independent Geoffrey Greenaway 319 22.2
Majority 396
Turnout 43.5

Redlynch and Landford

Redlynch and Landford
PartyCandidateVotes%±
Conservative Leo Randall 1071 64.8
Liberal Democrat Malcolm Adams 555 33.6
Majority 516
Turnout 44.4

Roundway

Roundway
PartyCandidateVotes%±
Conservative Laura Evelyn Mayes 522 45.0
Liberal Democrat Mark Fell 210 18.1
Devizes Guardians Ted East 204 17.6
UKIP Philip Maslen 147 12.7
Labour Jim Thorpe 73 6.3
Majority 312
Turnout 38.7

Salisbury Bemerton

Salisbury Bemerton
PartyCandidateVotes%±
Labour Ricky Rogers 456 37.1
Conservative Penny Brown 273 22.2
Liberal Democrat John Patrick Abbott 212 17.2
UKIP Tony Morland 192 15.6
BNP Luci Taylor 84 6.8
Majority 183
Turnout 30.5

Salisbury Fisherton & Bemerton Village

Salisbury Fisherton & Bemerton Village
PartyCandidateVotes%±
Conservative Christopher Gordon Cochrane 496 38.8
Liberal Democrat Jo Broom 451 35.3
Labour John Michael Perings Walsh 300 23.5
Majority 45
Turnout 36.4

Salisbury Harnham

Salisbury Harnham
PartyCandidateVotes%±
Liberal Democrat Brian Edward Dalton 745 45.7
Conservative Frank Robson 668 41.0
UKIP Susan Elizabeth Shearn 206 12.6
Majority 77
Turnout 44.3

Salisbury St Edmund & Milford

Salisbury St Edmund & Milford
PartyCandidateVotes%±
Liberal Democrat Paul Sample 849 54.9
Conservative John Rodell 364 23.5
UKIP Fiona Claire McWilliam 201 13.0
Labour Clare Miranda Moody 119 7.7
Majority 485
Turnout 41.3

Salisbury St Francis and Stratford

Salisbury St Francis and Stratford
PartyCandidateVotes%±
Conservative Mary Jacquelin Douglas 1024 53.7
Liberal Democrat Tony Thorpe 783 41.1
Labour Mark Riches 99 5.2
Majority 241
Turnout 46.6

Salisbury St Marks and Bishopdown

Salisbury St Marks and Bishopdown
PartyCandidateVotes%±
Conservative William Raybould Moss 539 38.0
Liberal Democrat James Campbell Robertson 459 32.4
Labour Clive Robert Vincent 83 5.9
Majority 80
Turnout 41.6

Salisbury St Martins and Cathedral

Salisbury St Martins and Cathedral
PartyCandidateVotes%±
Conservative John Anthony Brady 605 31.2
Liberal Democrat Bobbie Chettleburgh 597 30.8
Labour Ian Robert Tomes 515 26.6
UKIP Frances Mary Patricia Howard 212 10.9
Majority 8
Turnout 44.8

Salisbury St Pauls

Salisbury St Pauls
PartyCandidateVotes%±
Conservative Richard John Clewer 353 27.2
Liberal Democrat Robert William Steel 294 22.6
Labour Paul Michael Clegg 280 21.5
Independent Andrew Charles Righton Roberts 268 20.6
Independent Graham Ernest Prior 89 6.8
Majority 59
Turnout 36.9

Sherston

Sherston
PartyCandidateVotes%±
Conservative John Percy Simon Stuart Thomson 1299 69.9
Liberal Democrat Ian Ashby 470 25.3
Labour Susan Marion Ford 77 4.1
Majority 829
Turnout 50.7

Southwick

Southwick
PartyCandidateVotes%±
Conservative Tony Phillips 807 59.9
Liberal Democrat David John Lovell 522 38.7
Majority 285
Turnout 39.8

Summerham and Seend

Summerham and Seend
PartyCandidateVotes%±
Conservative Jonathon Seed 1033 54.9
Liberal Democrat Robert Oglesby 212 17.2
UKIP John Maurice Ryan 230 12.2
Majority 426
Turnout 53.7

The Collingbournes and Netheravon

The Collingbournes and Netheravon
PartyCandidateVotes%±
Conservative Charles Howard 831 53.5
UKIP Alan Stephen Wood 503 32.4
Liberal Democrat Katherine Walling 214 13.8
Majority 328
Turnout 46.2

The Lavingtons and Erlestoke

The Lavingtons and Erlestoke
PartyCandidateVotes%±
Conservative Richard Gamble 929 48.6
UKIP Mike Bridgeman 535 28.0
Liberal Democrat John Kirk Wilson 170 8.9
Green Hilary Pound 157 8.2
Labour David Wearn 121 6.3
Majority 394
Turnout 46.4

Tidworth

Tidworth
PartyCandidateVotes%±
Conservative Mark Connolly 569 67.3
UKIP Dottie Halfon 160 18.9
Liberal Democrat Martin Lee 110 13
Majority 409
Turnout 23.2

Till and Wylye Valley

Till and Wylye Valley
PartyCandidateVotes%±
Liberal Democrat Ian West 1064 55.7
Conservative Ian Mitchell 693 36.3
BNP Barry Witheridge 141 7.4
Majority 371
Turnout 54.2

Tisbury

Tisbury
PartyCandidateVotes%±
Conservative Tony Deane 803 52
Liberal Democrat John Holt 498 32.2
UKIP Timothy Barter 240 15.5
Majority 305
Turnout 45

Trowbridge Adcroft

Trowbridge Adcroft
PartyCandidateVotes%±
Independent Tom James 419 35.8
Liberal Democrat Nicholas Blakemore 406 34.7
Conservative David Halik 345 29.5
Majority 13
Turnout 36.9

Trowbridge Central

Trowbridge Central
PartyCandidateVotes%±
Liberal Democrat John Knight 713 68.4
Conservative Chris March 329 31.6
Majority 384
Turnout 30.8

Trowbridge Drynham

Trowbridge Drynham
PartyCandidateVotes%±
Conservative Graham Payne 641 64.2
Liberal Democrat Marcus Francis 358 35.8
Majority 283
Turnout 32.1

Trowbridge Grove

Trowbridge Grove
PartyCandidateVotes%±
Liberal Democrat Jeff Osborn 816 68.2
Conservative Colin Callow 311 26.0
Labour Gordon Cox 70 5.8
Majority 505
Turnout 35.5

Trowbridge Lambrok

Trowbridge Lambrok
PartyCandidateVotes%±
Liberal Democrat Helen Osborn 700 57.3
Conservative Doug Ross 522 42.7
Majority 178
Turnout 34.5

Trowbridge Park

Trowbridge Park
PartyCandidateVotes%±
Conservative Peter Fuller 430 42.8
Liberal Democrat Rollie Cleere 305 30.3
Green David McQueen 152 15.1
Labour Sean Semple 105 10.4
Majority 125
Turnout 30.8

Trowbridge Paxcroft

Trowbridge Paxcroft
PartyCandidateVotes%±
Liberal Democrat Steve Oldrieve 683 62.5
Conservative Doug Ross 399 36.5
Majority 284
Turnout 39.3

Urchfont and The Cannings

Warminster Copheap and Wylye
PartyCandidateVotes%±
Conservative Lionel Grundy 642 37.9
UKIP Steve Hamilton 410 24.2
Independent Tony Adamson 359 21.2
Liberal Democrat Michael Maude 205 12.1
Labour Sue Buxton 79 4.7
Majority 232
Turnout 50.4

Warminster Broadway

Warminster Broadway
PartyCandidateVotes%±
Conservative Keith Maurice Humphries 610 40.9
Liberal Democrat Paul Batchelor 480 32.2
UKIP Keith Malcolm Green 261 17.5
English Democrat Michael John Turner 132 8.9
Majority 130
Turnout 40.6

Warminster Copheap and Wylye

Warminster Copheap and Wylye
PartyCandidateVotes%±
Independent Christopher Newbury 824 49.7
Conservative Michael Burke Mounde 527 31.8
Liberal Democrat Graham Thomas Hedley 112 6.8
UKIP Charlotte Mozley 117 7.1
English Democrat Steve Martin 77 4.6
Majority 297
Turnout 45.2

Warminster East

Warminster East
PartyCandidateVotes%±
Conservative Andrew Davis 705 44.7
Independent Paul Ian Macdonald 302 19.1
Liberal Democrat Guy Fancourt 282 17.9
UKIP Andrew Newman Mozley 168 10.6
English Democrat Dave Carpenter 115 7.3
Majority 403
Turnout 39.5

Warminster West

Warminster West
PartyCandidateVotes%±
Conservative Pip Ridout 587 46.8
Liberal Democrat Roger John Coveney 249 19.9
Independent Steve Dancey 201 16.0
UKIP Mark Boyden 153 12.2
English Democrat May Joan Law 59 4.7
Majority 338
Turnout 32.6

Warminster Without

Warminster Without
PartyCandidateVotes%±
Conservative Fleur de Rhé-Philipe 999 61.9
Liberal Democrat Ray Beaty 376 23.3
UKIP James Alan Bell 224 13.9
Majority 623
Turnout 46.8

West Selkley

West Selkley
PartyCandidateVotes%±
Conservative Jemima Milton 785 50.0
Liberal Democrat Graham Francis 276 17.6
Independent James Sheppard 212 13.5
UKIP John Black 201 12.8
Labour Kamella Hopkins 96 6.1
Majority 509
Turnout 46.4

Westbury East

Westbury East
PartyCandidateVotes%±
Independent Mike Cuthbert-Murray 428 31.2
Liberal Democrat Gordon Ian King 386 28.1
Conservative Georgina Denison-Pender 375 27.3
UKIP Ben Parker 95 6.9
English Democrat Gillian Anne Apps 85 6.2
Majority 42
Turnout 37.3

Westbury North

Westbury North
PartyCandidateVotes%±
Liberal Democrat David Jenkins 508 47.7
Conservative Sue Ezra 379 35.6
Independent Francis Morland 162 15.2
Majority 129
Turnout 32.1

Westbury West

Westbury West
PartyCandidateVotes%±
Independent Russell Mark Jonathan Hawker 471 48.3
Conservative Veronica Dorothy Anne Burden 242 24.8
Liberal Democrat Alan Rigg 148 15.2
Labour Christine Linda Mitchell 98 10.1
Majority 229
Turnout 27.1

Wilton and Lower Wylye Valley

Wilton and Lower Wylye Valley
PartyCandidateVotes%±
Conservative Richard Beattie 614 39.4
Liberal Democrat Peter Edge 592 38.0
UKIP Ann Kingston 264 16.9
Labour David Roberts 89 5.7
Majority 22
Turnout 43

Winsley and Westwood

Winsley and Westwood
PartyCandidateVotes%±
Conservative Linda Conley 829 49.3
Liberal Democrat Neil Pocock 746 44.4
Labour Nikki Kenna 106 6.3
Majority 83
Turnout 49.8

Winterslow

Winterslow
PartyCandidateVotes%±
Conservative Christopher Devine 1,092 69.6
Liberal Democrat Peter Yeldon 477 30.4
Majority 615
Turnout 51.3

Wootton Bassett East

Wootton Bassett East
PartyCandidateVotes%±
Conservative Mollie Eileen May Groom 1,051 70.5
Liberal Democrat Keith Dixon 431 28.9
Majority 620
Turnout 41.0

Wootton Bassett North

Wootton Bassett North
PartyCandidateVotes%±
Conservative Bill Roberts 689 51.2
Liberal Democrat Stephen Richard Walls 627 46.6
Majority 62
Turnout 37.1

Wootton Bassett South

Wootton Bassett South
PartyCandidateVotes%±
Conservative Peter Joseph Doyle 680 41.9
Liberal Democrat Jenny Stratton 618 38.1
UKIP Peter Anthony Smith 248 15.3
Labour Ellis Webb 70 4.3
Majority 62
Turnout 41.8

See also

Related Research Articles

Borough of Swindon Place in England

The Borough of Swindon is a local government authority in South West England. It is centred on the town of Swindon and forms part of the ceremonial county of Wiltshire. It was formed in 1974 as the Thamesdown district of Wiltshire, from former areas of the municipal borough of Swindon and Highworth Rural District.

Metropolitan and non-metropolitan counties of England

Metropolitan and non-metropolitan counties are one of the four levels of subdivisions of England used for the purposes of local government outside Greater London and the Isles of Scilly. As originally constituted, the metropolitan and non-metropolitan counties each consisted of multiple districts, had a county council and were also the counties for the purposes of Lieutenancies. Later changes in legislation during the 1980s and 1990s have allowed counties without county councils and 'unitary authority' counties of a single district. Counties for the purposes of Lieutenancies are now defined separately, based on the metropolitan and non-metropolitan counties.

Buckinghamshire County Council upper-tier local authority for the non-metropolitan county of Buckinghamshire, in England

Buckinghamshire County Council is the upper-tier local authority for the non-metropolitan county of Buckinghamshire, in England, the United Kingdom established in 1889 following the Local Government Act 1888. The county council's offices are in Aylesbury.

Unitary authorities of England top and only level of local government in some parts of England

Unitary authorities of England are local authorities that are responsible for the provision of all local government services within a district. They are constituted under the Local Government Act 1992, which amended the Local Government Act 1972 to allow the existence of counties that do not have multiple districts. They typically allow large towns to have separate local authorities from the less urbanised parts of their counties and provide a single authority for small counties where division into districts would be impractical. Unitary authorities do not cover all of England. Most were established during the 1990s and a further tranche were created in 2009. Unitary authorities have the powers and functions that are elsewhere separately administered by councils of non-metropolitan counties and the non-metropolitan districts within them.

Elections to West Wiltshire District Council were held on 3 May 2007. The whole council was up for election and the Conservatives took control.

Elections to Wiltshire County Council were held on 5 May 2005, with the whole council up for election. They proved to be the last to the original county council, as the elections four years later were the first to its successor, the new Wiltshire Council unitary authority.

As a result of the 2009 structural changes to local government in England, the former Wiltshire County Council and the four districts within its geographical area were replaced by the new Wiltshire Council, which is a unitary authority covering the same area, with elections continuing to be held every four years, beginning in June 2009. Previously, Wiltshire County Council had been elected between 1889 and 2005, initially every three years, later every four years.

Nottinghamshire County Council

Nottinghamshire County Council is the upper-tier local authority for the non-metropolitan county of Nottinghamshire in England. It consists of 66 county councillors, elected from 56 electoral divisions every four years. The most recent election was held in 2017.

Shropshire Council British administrative body

Shropshire Council is the local authority of Shropshire in England. It is a unitary authority, having the powers of a non-metropolitan county and district council combined.

Shropshire Council is elected in full every four years.

Jane Scott, Baroness Scott of Bybrook English Conservative politician

Jane Antoinette Scott, Baroness Scott of Bybrook is a British Conservative politician, local government leader and member of the House of Lords. She has been leader of the Wiltshire Council unitary authority since June 2009 and before that of its predecessor, the former Wiltshire County Council, between 2003 and 2009.

2009 Hampshire County Council election

An election to Hampshire County Council took place on 4 June 2009 as part of the United Kingdom local elections, 2009, having been delayed from 7 May, to coincide with elections to the European Parliament. 78 councillors were elected from 75 electoral divisions, which returned either one or two county councillors each by first-past-the-post voting for a four-year term of office. The electoral divisions were the same as those used at the previous election in 2005. Elections in Portsmouth and Southampton do not coincide with this set, being unitary authorities outside the area covered by the County Council.

Swindon is a unitary authority in Wiltshire, England. Until 1 April 1998 its area was a non-metropolitan district called Thamesdown Borough Council, with Wiltshire County Council providing the county-level services. In 1998 all such powers were transferred to the new Borough of Swindon.

The Devizes Guardians are a local political party based in Devizes, Wiltshire, England. The party was formed in 2001 and has been successful in winning seats on Kennet District Council and Wiltshire Council, but at present is represented only on Devizes Town Council, which from May 2013 it controls.

This page documents political party strengths in the United Kingdom's principal local authorities. The last major change to council compositions was the 2 May 2019 local elections, but changes in party representation arise frequently due to resignations, deaths, by-elections, co-options and changes of affiliation.

2013 Wiltshire Council election

Elections to the Wiltshire Council unitary authority took place on 2 May 2013. All ninety-eight seats were up for election, with each councillor being elected in a single-member electoral division, although in six of the divisions only one candidate was nominated and was thus declared the winner without elections taking place.

The 1973 Nottinghamshire County Council election was held on Thursday, 12 April 1973. The election resulted in the Labour Party winning an overall majority of seats on the council.

References

  1. Towards One Council at onecouncilforwiltshire.co.uk