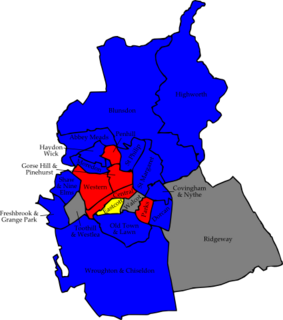
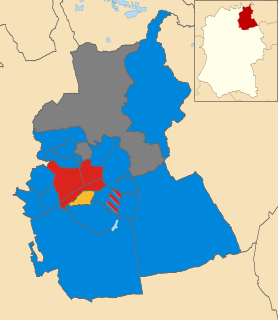
The 2010 Swindon Borough Council election took place on 6 May 2010 to elect members of Swindon Unitary Council in Wiltshire, England. One third of the council was up for election and the Conservative party stayed in overall control of the council. [1]
A unitary authority is a type of local authority that has a single tier and is responsible for all local government functions within its area or performs additional functions which elsewhere in the relevant country are usually performed by national government or a higher level of sub-national government.
Wiltshire is a county in South West England with an area of 3,485 km2. It is landlocked and borders the counties of Dorset, Somerset, Hampshire, Gloucestershire, Oxfordshire and Berkshire. The county town was originally Wilton, after which the county is named, but Wiltshire Council is now based in the county town of Trowbridge.
England is a country that is part of the United Kingdom. It shares land borders with Wales to the west and Scotland to the north-northwest. The Irish Sea lies west of England and the Celtic Sea lies to the southwest. England is separated from continental Europe by the North Sea to the east and the English Channel to the south. The country covers five-eighths of the island of Great Britain, which lies in the North Atlantic, and includes over 100 smaller islands, such as the Isles of Scilly and the Isle of Wight.
After the election, the composition of the council was
The Conservative Party, officially the Conservative and Unionist Party, is a centre-right political party in the United Kingdom. Presently led by Theresa May, it has been the governing party since 2010. It presently has 314 Members of Parliament in the House of Commons, 249 members of the House of Lords, and 18 members of the European Parliament. It also has 31 Members of the Scottish Parliament, 12 members of the Welsh Assembly, eight members of the London Assembly and 9,008 local councillors. One of the major parties of UK politics, it has formed the government on 45 occasions, more than any other party.
The Labour Party is a centre-left political party in the United Kingdom which has been described as an alliance of social democrats, democratic socialists and trade unionists. The party's platform emphasises greater state intervention, social justice and strengthening workers' rights. Labour is a full member of the Party of European Socialists and Progressive Alliance, and holds observer status in the Socialist International. As of 2017, the party was considered the "largest party in Western Europe" in terms of party membership, with more than half a million members.
The Liberal Democrats are a liberal, centrist political party in the United Kingdom. They presently have 11 Members of Parliament in the House of Commons, 96 members of the House of Lords, and one member of the European Parliament. They also have five Members of the Scottish Parliament and a member each in the Welsh Assembly and London Assembly. The party reached the height of its influence in the early 2010s, forming a junior partner in a coalition government from 2010 to 2015. It is presently led by Vince Cable.
The Conservatives retained their majority in the election, just losing one seat to have 41 councillors. [2] [3] The Conservative defeat came in Parks ward with Labour gaining the seat, while the only other change came in Penhill where the Liberal Democrats gained a previously independent seat. [3] [4] Among the Conservatives to retain a seat was the leader of the council, Roderick Bluh, who held Dorcan by a reduced majority of 460. [2] After the election the other parties on the council were Labour with 13 seats, Liberal Democrats 4 and 1 independent. [2]
A Councillor is a member of a local government council.
Party | Seats | Gains | Losses | Net gain/loss | Seats % | Votes % | Votes | +/− | |
---|---|---|---|---|---|---|---|---|---|
Conservative | 13 | 0 | 1 | -1 | 68.4 | 42.5 | 38,248 | -12.3% | |
Labour | 4 | 1 | 0 | +1 | 21.1 | 30.5 | 27,402 | +5.2% | |
Liberal Democrat | 2 | 1 | 0 | +1 | 10.5 | 21.8 | 19,579 | +7.3% | |
UKIP | 0 | 0 | 0 | 0 | 0 | 2.0 | 1,820 | -3.0% | |
BNP | 0 | 0 | 0 | 0 | 0 | 1.9 | 1,721 | +1.9% | |
Green | 0 | 0 | 0 | 0 | 0 | 1.1 | 1,016 | +1.1% | |
Independent | 0 | 0 | 1 | -1 | 0 | 0.2 | 144 | -0.2% |
Party | Candidate | Votes | % | ± | |
---|---|---|---|---|---|
Conservative | Peter Heaton-Jones | 4,377 | 55.2 | -20.7 | |
Liberal Democrat | Catherine Smith | 1,722 | 21.7 | +12.4 | |
Labour | Asif Rabbani | 1,578 | 19.9 | +8.9 | |
UKIP | Rhian Vaughan | 256 | 3.2 | -0.5 | |
Majority | 2,655 | 33.5 | -31.4 | ||
Turnout | 7,933 | ||||
Conservative hold | Swing |
Party | Candidate | Votes | % | ± | |
---|---|---|---|---|---|
Conservative | Gloria Dart | 1,246 | 62.3 | -21.4 | |
Liberal Democrat | Joan Mortimer | 338 | 16.9 | +16.9 | |
Labour | Jamal Miah | 291 | 14.6 | -1.7 | |
UKIP | Mark Patrick | 124 | 6.2 | +6.2 | |
Majority | 908 | 45.4 | -21.9 | ||
Turnout | 1,999 | ||||
Conservative hold | Swing |
Party | Candidate | Votes | % | ± | |
---|---|---|---|---|---|
Labour | Robert Wright | 2,357 | 52.8 | +8.7 | |
Conservative | Kevin Leakey | 1,155 | 25.9 | -6.6 | |
Liberal Democrat | Kathryn Spencer | 673 | 15.1 | +4.1 | |
Green | Stephen Chadfield | 136 | 3.0 | +3.0 | |
Independent | David Cox | 84 | 1.9 | -4.2 | |
Independent | Karsten Evans | 60 | 1.3 | +1.3 | |
Majority | 1,202 | 26.9 | +15.3 | ||
Turnout | 4,465 | ||||
Labour hold | Swing |
Party | Candidate | Votes | % | ± | |
---|---|---|---|---|---|
Conservative | Richard Hurley | 2,228 | 44.5 | -13.1 | |
Labour | Jennifer Millin | 1,548 | 30.9 | +6.1 | |
Liberal Democrat | Christopher Ward | 824 | 16.5 | +10.1 | |
UKIP | Corinna Allen | 409 | 8.2 | -3.0 | |
Majority | 680 | 13.6 | -29.2 | ||
Turnout | 5,009 | ||||
Conservative hold | Swing |
Party | Candidate | Votes | % | ± | |
---|---|---|---|---|---|
Conservative | Roderick Bluh | 1,858 | 41.4 | ||
Labour | Sarah Bush | 1,398 | 31.2 | ||
Liberal Democrat | Clive Hooper | 634 | 14.1 | ||
UKIP | Robert Sheppard | 293 | 6.5 | ||
BNP | Roger Hiett | 222 | 4.9 | ||
Green | David Miles | 81 | 1.8 | ||
Majority | 460 | 10.3 | |||
Turnout | 4,486 | ||||
Conservative hold | Swing |
Party | Candidate | Votes | % | ± | |
---|---|---|---|---|---|
Liberal Democrat | Dave Wood | 2,139 | 45.8 | -12.8 | |
Labour | Mustafa Gulam | 1,207 | 25.9 | +8.0 | |
Conservative | Valerie Butt | 1,084 | 23.2 | -0.3 | |
Green | John Hughes | 237 | 5.1 | +5.1 | |
Majority | 932 | 20.0 | -15.1 | ||
Turnout | 4,667 | ||||
Liberal Democrat hold | Swing |
Party | Candidate | Votes | % | ± | |
---|---|---|---|---|---|
Conservative | Michael Bray | 2,257 | 46.3 | -14.1 | |
Labour | Matthew Rhodes | 1,330 | 27.3 | +15.0 | |
Liberal Democrat | Heidi Teague | 1,290 | 26.5 | -0.8 | |
Majority | 927 | 19.0 | -14.1 | ||
Turnout | 4,877 | ||||
Conservative hold | Swing |
Party | Candidate | Votes | % | ± | |
---|---|---|---|---|---|
Labour | Rochelle Russell | 1,597 | 43.4 | -1.2 | |
Conservative | Jaki Fairbrother | 1,034 | 28.1 | -13.5 | |
Liberal Democrat | Tracy Ockley | 707 | 19.2 | +5.3 | |
BNP | Brian Freeman | 342 | 9.3 | +9.3 | |
Majority | 563 | 15.3 | +12.3 | ||
Turnout | 3,680 | ||||
Labour hold | Swing |
Party | Candidate | Votes | % | ± | |
---|---|---|---|---|---|
Conservative | David Renard | 2,681 | 49.8 | -11.2 | |
Labour | Joanna Felstead | 1,409 | 26.2 | +6.5 | |
Liberal Democrat | Stephen Pike | 1,033 | 19.2 | +10.9 | |
UKIP | Robin Tingey | 265 | 4.9 | -6.1 | |
Majority | 1,272 | 23.6 | -17.7 | ||
Turnout | 5,388 | ||||
Conservative hold | Swing |
Party | Candidate | Votes | % | ± | |
---|---|---|---|---|---|
Conservative | John Short | 2,235 | 47.2 | -15.1 | |
Labour | Phillip Beaumont | 1,301 | 27.5 | +4.7 | |
Liberal Democrat | Jennifer Shorten | 974 | 20.6 | +5.7 | |
Green | Andrew Day | 222 | 4.7 | +4.7 | |
Majority | 934 | 19.7 | -19.8 | ||
Turnout | 4,732 | ||||
Conservative hold | Swing |
Party | Candidate | Votes | % | ± | |
---|---|---|---|---|---|
Conservative | David Wren | 1,679 | 39.4 | -15.0 | |
Labour | Maureen Caton | 1,485 | 34.8 | +5.9 | |
Liberal Democrat | George Ing | 792 | 18.6 | +13.2 | |
BNP | Steven Fowler | 310 | 7.3 | +7.3 | |
Majority | 194 | 4.5 | -21.0 | ||
Turnout | 4,266 | ||||
Conservative hold | Swing |
Party | Candidate | Votes | % | ± | |
---|---|---|---|---|---|
Conservative | Brian Mattock | 3,144 | 49.4 | -14.8 | |
Liberal Democrat | Shirley Burnham | 1,510 | 23.7 | +6.6 | |
Labour | Cindy Matthews | 1,206 | 18.9 | +5.9 | |
Green | Meryl Grant | 278 | 4.4 | +4.4 | |
UKIP | Noel Gardner | 231 | 3.6 | -2.0 | |
Majority | 1,634 | 25.7 | -21.4 | ||
Turnout | 6,369 | ||||
Conservative hold | Swing |
Party | Candidate | Votes | % | ± | |
---|---|---|---|---|---|
Labour | Mark Dempsey | 1,587 | 43.1 | ||
Conservative | Graham Cherry | 996 | 27.0 | ||
Liberal Democrat | Kathleen McCarthy | 539 | 14.6 | ||
BNP | Reginald Bates | 258 | 7.0 | ||
UKIP | Terence Hayward | 242 | 6.6 | ||
Green | Jennifer Miles | 62 | 1.7 | ||
Majority | 591 | 16.0 | |||
Turnout | 3,684 | ||||
Labour gain from Conservative | Swing | ||||
Party | Candidate | Votes | % | ± | |
---|---|---|---|---|---|
Liberal Democrat | Andrew Harrison | 898 | 39.5 | +14.3 | |
Labour | Laura Baker | 782 | 34.4 | -7.3 | |
Conservative | Emma Carter | 444 | 19.5 | -0.5 | |
BNP | Raymond Morris | 152 | 6.7 | -6.3 | |
Majority | 116 | 5.1 | |||
Turnout | 2,276 | ||||
Liberal Democrat gain from Independent | Swing | ||||
Party | Candidate | Votes | % | ± | |
---|---|---|---|---|---|
Conservative | Keith Williams | 2,622 | 54.2 | -16.3 | |
Liberal Democrat | James Farr | 1,142 | 23.6 | +5.4 | |
Labour | Carol Heavens | 1,072 | 22.2 | +10.8 | |
Majority | 1,480 | 30.6 | -21.7 | ||
Turnout | 4,836 | ||||
Conservative hold | Swing |
Party | Candidate | Votes | % | ± | |
---|---|---|---|---|---|
Conservative | Mark Edwards | 2,522 | 47.6 | -11.6 | |
Labour | Nigel Chalk | 1,577 | 29.8 | +6.9 | |
Liberal Democrat | Lloyd James | 1,194 | 22.6 | +14.3 | |
Majority | 945 | 17.9 | -18.4 | ||
Turnout | 5,293 | ||||
Conservative hold | Swing |
Party | Candidate | Votes | % | ± | |
---|---|---|---|---|---|
Conservative | Janet Heenan | 2,013 | 41.4 | -11.3 | |
Labour | Joseph Tray | 1,962 | 40.3 | +9.0 | |
Liberal Democrat | Ann Richards | 893 | 18.3 | +11.7 | |
Majority | 51 | 1.0 | -20.5 | ||
Turnout | 4,868 | ||||
Conservative hold | Swing |
Party | Candidate | Votes | % | ± | |
---|---|---|---|---|---|
Labour | Kevin Small | 2,275 | 43.4 | -2.2 | |
Conservative | Samantha Michael | 1,619 | 30.9 | -8.0 | |
Liberal Democrat | Christopher Shepherd | 911 | 17.4 | +10.9 | |
BNP | Glyn Hunt | 437 | 8.3 | +8.3 | |
Majority | 656 | 12.5 | +5.8 | ||
Turnout | 5,242 | ||||
Labour hold | Swing |
Party | Candidate | Votes | % | ± | |
---|---|---|---|---|---|
Conservative | Eric Shaw | 3,054 | 52.1 | -11.2 | |
Labour | Sandra Parsons | 1,440 | 24.6 | +11.5 | |
Liberal Democrat | Victor Godman | 1,366 | 23.3 | -0.3 | |
Majority | 1,614 | 27.5 | -12.2 | ||
Turnout | 5,860 | ||||
Conservative hold | Swing |
The 2007 Worthing Borough Council election took place on 3 May 2007 to elect members of Worthing Borough Council in West Sussex, England. One third of the council was up for election and the Conservative party stayed in overall control of the council.
The 2007 Southend-on-Sea Council election took place on 3 May 2007 to elect members of Southend-on-Sea Unitary Council in Essex, England. One third of the council was up for election and the Conservative party stayed in overall control of the council.
The 2010 Craven District Council election took place on 6 May 2010 to elect members of Craven District Council in North Yorkshire, England. One third of the council was up for election and the Conservative party gained overall control of the council from no overall control.
The 2010 Weymouth and Portland Borough Council election took place on 6 May 2010 to elect members of Weymouth and Portland Borough Council in Dorset, England. One third of the council was up for election and the council stayed under no overall control.
The 2010 Rossendale Borough Council election took place on 6 May 2010 to elect members of Rossendale Borough Council in Lancashire, England. One third of the council was up for election and the Conservative party stayed in overall control of the council.
The 2010 West Lancashire Borough Council election took place on 6 May 2010 to elect members of West Lancashire Borough Council in Lancashire, England. One third of the council was up for election and the Conservative party stayed in overall control of the council.
The 2006 Swindon Borough Council election took place on 4 May 2006 to elect members of Swindon Unitary Council in Wiltshire, England. One third of the council was up for election and the Conservative party stayed in overall control of the council.
The 2007 Swindon Borough Council election took place on 4 May 2007 to elect members of Swindon Unitary Council in Wiltshire, England. One third of the council was up for election and the Conservative party stayed in overall control of the council.
The 2008 Swindon Borough Council election took place on 4 May 2008 to elect members of Swindon Unitary Council in Wiltshire, England. One third of the council was up for election and the Conservative party stayed in overall control of the council.
The 2008 Fareham Council election took place on 1 May 2008 to elect members of Fareham Borough Council in Hampshire, England. Half of the council was up for election and the Conservative party stayed in overall control of the council.
The 1999 Solihull Metropolitan Borough Council election took place on 6 May 1999 to elect members of Solihull Metropolitan Borough Council in the West Midlands, England. One third of the council was up for election and the council stayed under no overall control.
The 2006 Solihull Metropolitan Borough Council election took place on 4 May 2006 to elect members of Solihull Metropolitan Borough Council in the West Midlands, England. One third of the council was up for election and the Conservative party stayed in overall control of the council.
The 2010 Sunderland Council election took place on 6 May 2010 to elect members of Sunderland Metropolitan Borough Council in Tyne and Wear, England. One third of the council was up for election and the Labour party stayed in overall control of the council. The election took place on the same day as the 2010 General Election.
The 2010 Harrogate Council election took place on 6 May 2010 to elect members of Harrogate Borough Council in North Yorkshire, England. One third of the council was up for election and the Conservative party gained overall control of the council from no overall control.
The 2010 Pendle Borough Council election took place on 6 May 2010 to elect members of Pendle Borough Council in Lancashire, England. One third of the council was up for election and the council stayed under no overall control.
The 2011 Swindon Borough Council election took place on 5 May 2011 to elect members of Swindon Unitary Council in Wiltshire, England. One third of the council was up for election and the Conservative party stayed in overall control of the council.
The 2007 Redcar and Cleveland Borough Council election took place on 3 May 2007 to elect members of Redcar and Cleveland Unitary Council in England. The whole council was up for election and the council stayed under no overall control.
The 2014 Enfield Council election took place on 22 May 2014 to elect members of Enfield London Borough Council in London, England. The whole council was up for election and the Labour party retained overall control of the council, increasing their majority over the Conservative party by five seats.
The 2010 Swale Borough Council election took place on 6 May 2010 to elect members of Swale Borough Council in Kent, England. One third of the council was up for election and the Conservative party stayed in overall control of the council.
The 2011 Swale Borough Council election took place on 5 May 2011 to elect members of Swale Borough Council in Kent, England. The whole council was up for election and the Conservative party stayed in overall control of the council.