Wigan Metropolitan Borough Council election, 2010

Last updated

Map of the results of the 2010 Wigan council election. Labour in red and Liberal Democrats in yellow. Wigan UK local election 2010 map.svg
Map of the results of the 2010 Wigan council election. Labour in red and Liberal Democrats in yellow.

Elections to Wigan Council were held on 6 May 2010. One-third of the council was up for election. [1] [2] [3]

Metropolitan Borough of Wigan Metropolitan borough in England

The Metropolitan Borough of Wigan is a metropolitan borough of Greater Manchester, in North West England. It is named after its largest component town and former county borough, Wigan and includes the towns and villages of Leigh, part of Ashton-in-Makerfield, Ince-in-Makerfield, Hindley, Orrell, Standish, Atherton, Tyldesley, Golborne, Lowton, Billinge, Astley, Haigh and Aspull. The borough was formed in 1974 and is an amalgamation of several former local government districts and parishes. The borough has three civil parishes and lies directly to the west of the City of Salford and southwest of the Metropolitan Borough of Bolton. The local authority is Wigan Metropolitan Borough Council.

Contents

Election result

Wigan Local Election Result 2010
PartySeatsGainsLossesNet gain/lossSeats %Votes %Votes+/−
  Labour 24 10 0 +10 96.0 45.5 63,404 +8.2%
  Liberal Democrat 1 0 1 -1 4.0 8.9 12,447 +0.3%
  Conservative 0 0 2 -2 0.0 18.7 26,036 -7.3%
  Community Action 0 0 2 -2 0.0 8.0 11,129 -5.9%
  Independent 0 0 3 -3 0.0 7.3 10,254 -1.6%
  BNP 0 0 0 0 0.0 6.5 9,116 +3.2%
  Independent Conservative 0 0 2 -2 0.0 3.1 4,351 +3.1%
  UKIP 0 0 0 0 0.0 1.3 1,797 -0.0%
  England First 0 0 0 0 0.0 0.1 134 +0.1%

This result had the following consequences for the total number of seats on the Council after the elections:

PartyPrevious councilNew council
Labour 41 51
Conservative 10 8
Independent 10 7
Community Action 6 4
Liberal Democrat 4 3
Wigan Independent Conservative 4 2
BNP 0 0
UKIP 0 0
England First 0 0
Total 75 75
Working majority 7  27 

Ward results

Abram

Abram [2] [3]
PartyCandidateVotes%±
Labour Carl Sweeney 2,849 52.7 +4.9
Independent Sandra Atherton 893 16.5 +16.5
Conservative Marie Winstanley 668 12.4 -2.7
BNP Dennis Shambley 659 12.2 +12.2
Community Action John Shale 316 5.8 -30.9
Rejected ballots 20 0.4 -0.1
Majority 1,956 36.2 +25.2
Turnout 5,405 51.8 +26.7
Labour hold Swing -5.8

Ashton

Ashton [2] [3]
PartyCandidateVotes%±
Labour Dennis Ash 2,208 38.7 +5.1
Community Action Joanne Bradley 1,980 34.7 -18.6
Independent Frank Merry 574 10.1 +10.1
Conservative Malcolm Childs 571 10.0 +2.5
BNP Barry Longstaffe 352 6.2 +0.8
Rejected ballots 20 0.4 +0.1
Majority 228 4.0 -15.8
Turnout 5,705 63.1 +26.2
Labour hold Swing +11.8

Aspull, New Springs, Whelley

Aspull, New Springs, Whelley [2] [3]
PartyCandidateVotes%±
Labour Ronald Conway 3,133 49.6 +6.6
Liberal Democrat Trevor Beswick 1,470 23.3 -14.1
Conservative Jane Surples 1,175 18.6 -0.5
BNP Andrew Jones 430 6.8 +6.8
Independent Conservative Ian Bland 90 1.4 +1.4
Rejected ballots 20 0.3 -0.2
Majority 1,663 26.3 +20.7
Turnout 6,318 64.1 +29.7
Labour gain from Liberal Democrat Swing +10.3

Astley Mosley Common

Astley Mosley Common [2] [3]
PartyCandidateVotes%±
Labour Barry Taylor 2,339 39.5 +4.2
Liberal Democrat Gavin Clements 1,894 32.0 +10.0
Conservative Nasri Barghothi 1,635 27.6 -14.4
Rejected ballots 47 0.8 +0.2
Majority 445 7.5 +0.8
Turnout 5,915 63.1 +32.2
Labour gain from Independent Swing -2.9

Atherleigh

Atherleigh [2] [3]
PartyCandidateVotes%±
Labour Pamela Stewart 2,038 43.3 -15.4
Conservative Derek Davies 871 18.5 -21.9
Liberal Democrat Lisa Clements 711 15.1 +15.1
Independent Neil Wade 447 9.5 +9.5
BNP Gary Chadwick 386 8.2 +8.2
Community Action Julie Finch 254 5.4 +5.4
Rejected ballots 0 0.0 -0.9
Majority 1,167 24.8 +6.5
Turnout 4,707 56.0 +29.6
Labour hold Swing +3.2

Atherton

Atherton [2] [3]
PartyCandidateVotes%±
Labour Karen Aldred 2,758 45.2 +19.3
Conservative Vivienne Lee 961 15.7 +2.9
Independent Jamie Hodgkinson 852 14.0 -15.5
Liberal Democrat Gareth Clements 850 13.9 -10.9
Community Action Stephen Hall 655 10.7 +10.7
Rejected ballots 30 0.5 +0.1
Majority 1,797 29.4 +25.8
Turnout 6,106 57.0 +25.6
Labour hold Swing +8.2

Bryn

Bryn [2] [3]
PartyCandidateVotes%±
Labour Margaret Rampling 2,274 40.2 +16.7
Independent Brian Merry 1,697 30.0 -19.2
Community Action Kevin Williams 609 10.8 -1.3
BNP Ken Haslam 531 9.4 +0.7
Conservative Joseph Sheedy 525 9.3 +3.0
Rejected ballots 25 0.4 +0.0
Majority 577 10.2 -15.6
Turnout 5,661 62.4 +26.3
Labour gain from Independent Swing +17.9

Douglas

Douglas [2] [3]
PartyCandidateVotes%±
Labour Shirley Dewhurst 2,742 58.7 +7.3
Conservative Margaret Atherton 659 14.1 -1.3
BNP Ian Lloyd 461 9.9 +9.9
Community Action Jayne Bryan 396 8.5 -24.2
Independent Anthony Unsworth 380 8.1 +8.1
Rejected ballots 34 0.7 +0.2
Majority 2,083 44.6 +25.9
Turnout 4,672 48.9 +24.4
Labour hold Swing +4.3

Golborne Lowton West

Golborne Lowton West [2] [3]
PartyCandidateVotes%±
Labour Gerard Bretherton 2,554 49.9 +8.9
Community Action Peter Franzen 1,431 28.0 -10.4
Conservative Kathleen Houlton 775 15.2 +5.4
BNP Steven McEllenborough 329 6.4 +0.3
Rejected ballots 26 0.5 +0.3
Majority 1,123 22.0 +19.4
Turnout 5,115 58.0 +25.1
Labour hold Swing +9.6

Hindley

Hindley [2] [3]
PartyCandidateVotes%±
Labour James Talbot 2,558 49.2 +24.7
Independent David Culshaw 1,346 25.9 -39.6
Conservative David Ollerton 610 11.7 +2.0
BNP Stephen Bradbury 501 9.6 +9.6
Community Action Peter Solinas 152 2.9 +2.9
Rejected ballots 28 0.5 +0.3
Majority 1,212 23.3 -17.7
Turnout 5,195 52.7 +23.6
Labour hold Swing +32.1

Hindley Green

Hindley Green [2] [3]
PartyCandidateVotes%±
Labour David Stitt 1,658 31.5 +5.0
Independent Francis Carmichael 1,476 28.0 -16.7
Community Action Barry Fagan 1,087 20.6 +6.4
Conservative Margaret Winstanley 593 11.3 -3.0
BNP Darren Mark Taylor 427 8.1 +8.1
Rejected ballots 28 0.5 +0.1
Majority 182 3.5 -14.7
Turnout 5,269 61.7 +32.9
Labour gain from Community Action Swing +10.8

Ince

Ince [2] [3]
PartyCandidateVotes%±
Labour James Moodie 2,559 60.8 +0.3
BNP James Harrison 570 13.5 +13.5
Conservative Raymond Whittingham 402 9.6 -4.6
Community Action Robert Hall 300 7.1 -17.4
Independent Brian Kenrick 224 5.3 +5.3
England First Robert Hague 134 3.2 +3.2
Rejected ballots 18 0.4 -0.3
Majority 1,989 47.3 +11.3
Turnout 4,207 48.3 +25.3
Labour hold Swing -6.6

Leigh East

Leigh East [2] [3]
PartyCandidateVotes%±
Labour Frederick Walker 2,422 48.2 +4.3
Liberal Democrat Gordon Jackson 1,373 27.3 +0.9
Conservative Richard Short 1,183 23.5 -5.5
Rejected ballots 51 1.0 +0.3
Majority 1,049 20.9 +6.1
Turnout 5,029 55.9 +31.0
Labour hold Swing +1.7

Leigh South

Leigh South [2] [3]
PartyCandidateVotes%±
Labour Charles Rigby 2,571 40.8 -0.4
Conservative Stanley Walker 1,196 19.0 -11.1
Liberal Democrat Chris Blackburn 1,002 15.9 +15.9
Community Action Clive Charles 583 9.3 -5.0
BNP Adam Lloyd 516 8.2 -5.9
Independent Philip Symonds 279 4.4 +4.4
Independent Conservative Elaine Brown 125 2.0 +2.0
Rejected ballots 24 0.4 +0.1
Majority 1,375 21.8 +10.6
Turnout 6,296 61.6 +29.0
Labour hold Swing +5.3

Leigh West

Leigh West [2] [3]
PartyCandidateVotes%±
Labour Peter Smith 2,509 46.5 -17.8
Liberal Democrat Richard Derricutt 828 15.3 +15.3
BNP Martin Grainey 693 12.8 +12.8
Conservative John Oxley 557 10.3 -23.7
Independent David Hull 280 5.2 +5.2
Independent Brian Turrell 255 4.7 +4.7
UKIP Mary Lavelle 247 4.6 +4.6
Rejected ballots 28 0.5 -1.1
Majority 1,681 31.1 +0.8
Turnout 5,397 51.3 +28.5
Labour hold Swing -16.5

Lowton East

Lowton East [2] [3]
PartyCandidateVotes%±
Labour James Cowley 2,403 38.0 +17.4
Conservative Ed Houlton 2,315 36.6 -17.0
Community Action Ian Franzen 1,591 25.1 -0.5
Rejected ballots 18 0.3 +0.1
Majority 88 1.4 -26.6
Turnout 6,327 65.6 +27.7
Labour gain from Community Action Swing +17.2

Orrell

Orrell [2] [3]
PartyCandidateVotes%±
Labour David Arrowsmith 2,877 46.1 +18.1
Conservative Stuart Foy 2,317 37.2 -9.3
BNP Charles Foy 697 11.2 -4.7
Independent Conservative Paula Thompson 286 4.6 +4.6
Rejected ballots 58 0.9 +0.6
Majority 560 9.0 -9.5
Turnout 6,235 67.5 +29.7
Labour gain from Conservative Swing +13.7

Pemberton

Pemberton [2] [3]
PartyCandidateVotes%±
Labour Paul Prescott 3,219 65.5 +9.8
Conservative Jonathan Cartwright 617 12.6 -1.5
BNP Christopher Hilton 596 12.1 -1.3
Community Action Michael Leyland 451 9.2 -7.1
Rejected ballots 32 0.7 +0.1
Majority 2,602 52.9 +13.5
Turnout 4,915 50.1 +24.2
Labour hold Swing +5.6

Shevington with Lower Ground

Shevington with Lower Ground [2] [3]
PartyCandidateVotes%±
Labour Michael Crosby 2,180 34.3 +3.6
Conservative Anthony Hind 1,404 22.1 -26.3
Independent Conservative Angela Bland 1,210 19.1 +19.1
Liberal Democrat Daniel Clarke 995 15.7 +7.7
UKIP John Atherton 534 8.4 +0.5
Rejected ballots 28 0.4 +0.4
Majority 776 12.2 -5.5
Turnout 6,351 68.3 +34.2
Labour gain from Independent Conservative Swing +14.9

Standish with Langtree

Standish with Langtree [2] [3]
PartyCandidateVotes%±
Labour Emma McGurrin 2,097 32.1 +1.2
Conservative Steven Surples 1,894 29.0 -21.8
Independent Conservative Neil Dunlop 1,021 15.6 +15.6
Liberal Democrat Alan Robinson 1,009 15.4 +9.1
UKIP Alan Freeman 280 4.3 -4.1
BNP Graham Lawrence 228 3.5 +3.5
Rejected ballots 13 0.2 +0.1
Majority 203 3.1 -16.8
Turnout 6,542 68.4 +32.8
Labour gain from Conservative Swing +11.5

Tyldesley

Tyldesley [2] [3]
PartyCandidateVotes%±
Liberal Democrat Paul Valentine 2,315 39.5 -26.2
Labour Anita Thorpe 1,875 32.0 +10.0
Conservative Hilary Hayden 930 15.9 +4.6
BNP David Peacock 450 7.7 +7.7
Independent Joseph Haley 272 4.6 +4.6
Rejected ballots 13 0.2 -0.8
Majority 440 7.5 -36.2
Turnout 5,855 58.3 +30.5
Liberal Democrat hold Swing -18.1

Wigan Central

Wigan Central [2] [3]
PartyCandidateVotes%±
Labour George Davies 2,477 41.9 +11.6
Conservative Robert Gibson 1,522 25.7 -24.5
Independent Conservative Gareth Fairhurst 1,090 18.4 +18.4
UKIP Keith Jones 475 8.0 -4.1
BNP Anthony Farrell 306 5.2 +5.2
Rejected ballots 47 0.8 +0.3
Majority 955 16.1 -3.9
Turnout 5,917 64.8 +30.5
Labour gain from Independent Conservative Swing +18.0

Wigan West

Wigan West [2] [3]
PartyCandidateVotes%±
Labour Phyllis Cullen 3,437 61.4 +17.7
Conservative Christopher McGowan 970 17.3 -1.6
BNP Susan Mather 608 10.9 -3.6
Independent Conservative Andrew Lomax 529 9.5 +9.5
Rejected ballots 50 0.9 +0.7
Majority 2,467 44.1 +19.3
Turnout 5,594 57.5 +32.4
Labour hold Swing +9.6

Winstanley

Winstanley [2] [3]
PartyCandidateVotes%±
Labour Clive Morgan 2,465 43.4 +10.1
Independent William Wilkes 1,279 22.5 +22.5
Conservative Victoria Ashurst 852 15.0 -4.4
Community Action Ronald Barnes 433 7.6 -39.3
BNP Adrian Jones 376 6.6 +6.6
UKIP Arnold Foster 261 4.6 +4.6
Rejected ballots 14 0.2 -0.1
Majority 1,186 20.9 +7.2
Turnout 5,680 64.8 +35.0
Labour gain from Independent Swing -6.2

Worsley Mesnes

Worsley Mesnes [2] [3]
PartyCandidateVotes%±
Labour Lynne Holland 3,202 64.5 +9.4
Community Action Arthur Fairhurst 891 17.9 -10.6
Conservative Marion Green 834 16.8 +1.1
Rejected ballots 38 0.8 +0.1
Majority 2,311 46.5 +20.0
Turnout 4,965 56.2 +29.9
Labour hold Swing +10.0

By-elections between 2010 and 2011

Wigan Central By-Election 3 March 2011 [4] [5]
PartyCandidateVotes%±
Labour Lawrence Hunt 1,165 48.6 +6.7
Conservative Robin Gibson 652 27.2 +1.5
Independent Conservative Gareth Fairhurst 393 16.4 -2.0
UKIP Keith Davies 189 7.9 -0.1
Majority 513 21.4 +5.3
Turnout 2,399 25.6 -39.2
Labour gain from Conservative Swing +2.6

Related Research Articles

Wigan Metropolitan Borough Council elections

One third of Wigan Metropolitan Borough Council in Greater Manchester, England is elected each year, followed by one year without election. Since the last boundary changes in 2004, 75 councillors have been elected from 25 wards.

1998 Wigan Metropolitan Borough Council election

Elections to Wigan Council were held on 7 May 1998. One third of the council was up for election. Following the previous election there had been three by-elections held—in Aspull-Standish, Ince and Hope Carr—with all three successfully defended by Labour.

2000 Wigan Metropolitan Borough Council election

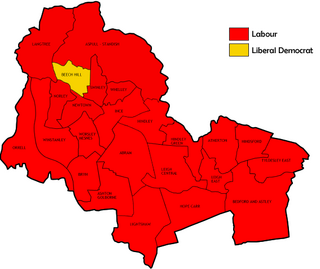
Elections to Wigan Council were held on 4 May 2000. One-third of the council was up for election, as well as an extra vacancy in Norley - both of which were uncontested. Since the election, there had been a by-election in which the Liberal Democrats gained the seat being fought in Hindsford from Labour.

2002 Wigan Metropolitan Borough Council election

Elections to Wigan Council were held on 2 May 2002, with one-third of the council to be re-elected. There had been a number of by-elections in the gap year, with a Labour gain from the Liberal Democrats in Hindsford, effectively cancelling out an earlier loss to them in Atherton. A Labour hold in Hope Carr in-between left both parties unchanged going into the election.

2003 Wigan Metropolitan Borough Council election

Elections to Wigan Council were held on 1 May 2003 with one-third of the council was up for election. Prior to the election, there had been two vacancies in Leigh Central, with Labour winning a by-election in June and the seat being fought in this election filled unopposed by Barbara Jarvis.

South Oxfordshire District Council in Oxfordshire, England is elected every four years. Since the last boundary changes in 2003, 48 councillors have been elected from 29 wards.

2004 Wigan Metropolitan Borough Council election

Elections to Wigan Council were held on 10 June 2004. The whole council was up for election with boundary changes since the last election in 2003 increasing the number of councillors by three. The Labour party kept overall control of the council.

2006 Wigan Metropolitan Borough Council election

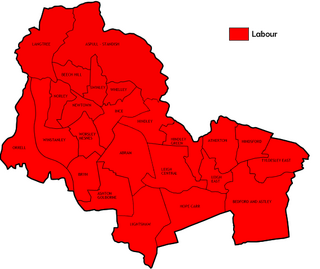
Elections to Wigan Council were held on 4 May 2006. One-third of the council was up for election and the Labour party kept overall control of the council. Overall turnout was 29.2%.

2008 Wigan Metropolitan Borough Council election

Elections to Wigan Council were held on 1 May 2008. One-third of the council was up for election.

2011 United Kingdom local elections

The 2011 United Kingdom local elections were held on Thursday 5 May 2011. In England, direct elections were held in all 36 Metropolitan boroughs, 194 Second-tier district authorities, 49 unitary authorities and various mayoral posts, meaning local elections took place in all parts of England with the exception of seven unitary authorities, and seven districts and boroughs. For the majority of English districts and the 25 unitary authorities that are elected "all out" these were the first elections since 2007. In Northern Ireland, there were elections to all 26 local councils. Elections also took place to most English parish councils.

1973 Wigan Metropolitan Borough Council election

The 1973 Wigan Council elections for the First Wigan Metropolitan Borough Council were held on 10 May 1973, with the entirety of the 72 seat council - three seats for each of the 24 wards - up for vote. It was the first council election as the newly formed metropolitan borough under a new constitution. The Local Government Act 1972 stipulated that the elected members were to shadow and eventually take over from the predecessor corporation on 1 April 1974. The order in which the councillors were elected dictated their term serving, with third-place candidates serving two years and up for re-election in 1975, second-placed three years expiring in 1976 and 1st-placed five years until 1978.

2007 Wigan Metropolitan Borough Council election

Elections to Wigan Council were held on 3 May 2007 with one third of the seats up for election.

2011 Wigan Metropolitan Borough Council election

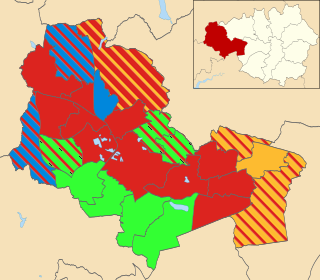
Elections to Wigan Council were held in May 2011. One-third of the council was up for election. These elections were held as part of the United Kingdom local elections, 2011.

2012 Wigan Metropolitan Borough Council election

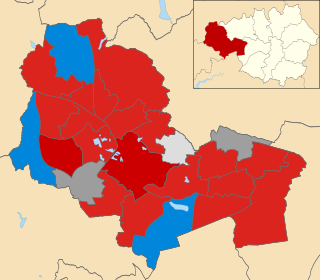
The 2012 Wigan Council elections to the Thirtieth Wigan Council were held on 3 May 2012, the same day as other local elections. One-third of the council was up for election.

1996 Wigan Metropolitan Borough Council election

Elections to Wigan council were held on Thursday, 2 May 1996, with an extra vacancy in Abram to be filled. Going into the election there were noticeably fewer candidates than usual, with the total candidate number and the five uncontested wards only narrowly lower than the all-time lows set at the 1990 election. This was mainly caused by the lack of any minor party candidates, and the Liberal Democrat slate dropping by half upon the previous election, to seven - their scarcest outing since their lowest ebb throughout their merger in 1990, but more reminiscent of their patchy participation of the seventies. Turnout had been consistently poor in recent elections, and this election continued the downward trend, dropping below a quarter of the electorate for the second time to 24.2%.

2015 Wigan Metropolitan Borough Council election

The 2015 Wigan Metropolitan Borough Council election took place on 7 May 2015 to elect members of Wigan Metropolitan Borough Council in England. This was on the same day as other local elections and the general election.

2016 Wigan Metropolitan Borough Council election

The 2016 Wigan Metropolitan Borough Council election took place on 5 May 2016 to elect members of Wigan Metropolitan Borough Council in England. This was on the same day as other local elections.

2018 Wigan Metropolitan Borough Council election

The 2018 Wigan Metropolitan Borough Council election took place on 3 May 2018 to elect members of Wigan Metropolitan Borough Council in England. This was on the same day as other local elections.

2019 Wigan Metropolitan Borough Council election

The 2019 Wigan Metropolitan Borough Council election is scheduled to be held on Thursday 2 May 2019 to elect members of Wigan Metropolitan Borough Council in England. This will be on the same day as other local elections.

References