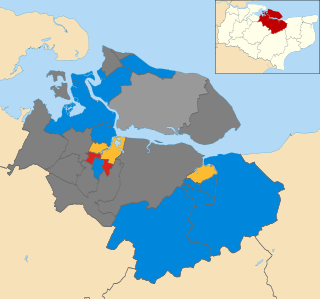
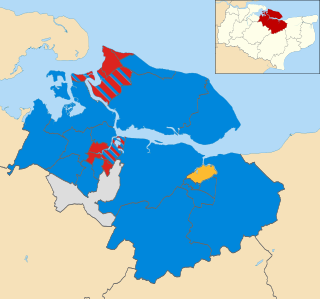
The 2010 Swale Borough Council election took place on 6 May 2010 to elect members of Swale Borough Council in Kent, England. One third of the council was up for election and the Conservative party stayed in overall control of the council. [1]
Swale is a local government district with borough status in Kent, England and is bounded by Medway to the west, Canterbury to the east, Ashford to the south and Maidstone to the south west. Its council is based in Sittingbourne. The district is named after the narrow channel called The Swale, that separates the mainland of Kent from the Isle of Sheppey, and which occupies the central part of the district.
Borough status in the United Kingdom is granted by royal charter to local government districts in England, Wales and Northern Ireland. The status is purely honorary, and does not give any additional powers to the council or inhabitants of the district. In Scotland, similarly chartered communities were known as royal burghs, although the status is no longer granted.
Kent is a county in South East England and one of the home counties. It borders Greater London to the north west, Surrey to the west and East Sussex to the south west. The county also shares borders with Essex along the estuary of the River Thames, and with the French department of Pas-de-Calais through the Channel Tunnel. The county town is Maidstone.
After the election, the composition of the council was
The Conservative Party, officially the Conservative and Unionist Party, is a centre-right political party in the United Kingdom. Presently led by Theresa May, it has been the governing party since 2010. It presently has 314 Members of Parliament in the House of Commons, 249 members of the House of Lords, and 18 members of the European Parliament. It also has 31 Members of the Scottish Parliament, 12 members of the Welsh Assembly, eight members of the London Assembly and 9,008 local councillors. One of the major parties of UK politics, it has formed the government on 45 occasions, more than any other party.
The Labour Party is a centre-left political party in the United Kingdom which has been described as an alliance of social democrats, democratic socialists and trade unionists. The party's platform emphasises greater state intervention, social justice and strengthening workers' rights. Labour is a full member of the Party of European Socialists and Progressive Alliance, and holds observer status in the Socialist International. As of 2017, the party was considered the "largest party in Western Europe" in terms of party membership, with more than half a million members.
The Liberal Democrats are a liberal, centrist political party in the United Kingdom. They presently have 11 Members of Parliament in the House of Commons, 96 members of the House of Lords, and one member of the European Parliament. They also have five Members of the Scottish Parliament and a member each in the Welsh Assembly and London Assembly. The party reached the height of its influence in the early 2010s, forming a junior partner in a coalition government from 2010 to 2015. It is presently led by Vince Cable.
After the last election in 2008 the Conservatives had a majority on the council with 26 councillors, compared to 9 for Labour, 7 independents and 5 Liberal Democrats. [3] However both the Conservative and Labour parties gained a seat at two by-elections in September 2008, after the independent councillors from Sheppey First resigned from the council. [4]
A Councillor is a member of a local government council.
By the time of the 2010 election there remained only one independent councillor, after Sheppey Central councillor Lesley Ingham joined the Conservatives in October 2009, before Pat Sandle and Paul Sturdgess also became Conservative councillors in March 2010. [5] [6] Meanwhile, the Liberal Democrat group on the council was reduced when St Michael's councillor Nick Williams defected to Labour in October 2009. [7] This meant that before the 2010 election the Conservatives had 31 seats on the council, while Labour had 11, the Liberal Democrats had 4 and there was 1 independent. [8]
The Isle of Sheppey is an island off the northern coast of Kent, England, neighbouring the Thames Estuary, centred 42 miles (68 km) from central London. It has an area of 36 square miles (93 km2). The island forms part of the local government district of Swale. Sheppey is derived from Old English Sceapig, meaning "Sheep Island".
The Conservatives made a net gain of two seats to win 14 of the 17 seats contested. [9] The gains came at the expense of the Labour and Liberal Democrat parties, which each finished one seat down. [9]
The Conservatives took Murston from the Liberal Democrats and Roman from Labour, as well as gaining Sheerness East by a single vote from Labour. [9] However Labour retained Chalkwell with a majority of 30 votes over the Conservatives and gained one of the two seats contested in Queenborough and Halfway from the Conservatives. [9]
Murston is a suburb of Sittingbourne in Kent, England. It is about 1 mile north-east of central Sittingbourne, on the east bank of the Milton Creek.
Sheerness is a town beside the mouth of the River Medway on the north-west corner of the Isle of Sheppey in north Kent, England. With a population of 12,000 it is the largest town on the island.
Queenborough is a small town on the Isle of Sheppey in the Swale borough of Kent in South East England.
Party | Seats | Gains | Losses | Net gain/loss | Seats % | Votes % | Votes | +/− | |
---|---|---|---|---|---|---|---|---|---|
Conservative | 14 | 3 | 1 | +2 | 82.4 | 50.2 | 23,751 | +4.7% | |
Labour | 3 | 1 | 2 | -1 | 17.6 | 29.5 | 13,957 | +5.8% | |
Liberal Democrat | 0 | 0 | 1 | -1 | 0 | 16.1 | 7,610 | -1.9% | |
UKIP | 0 | 0 | 0 | 0 | 0 | 3.7 | 1,755 | +3.7% | |
Green | 0 | 0 | 0 | 0 | 0 | 0.6 | 275 | -0.5% |
Party | Candidate | Votes | % | ± | |
---|---|---|---|---|---|
Conservative | Bryan Mulhern | 1,227 | 43.4 | +6.1 | |
Labour | Trevor Payne | 701 | 24.8 | -1.9 | |
Liberal Democrat | Richard Williams | 621 | 22.0 | +8.7 | |
Green | Gary Miller | 275 | 9.7 | +9.7 | |
Majority | 526 | 18.6 | +8.0 | ||
Turnout | 2,824 | 63.5 | +28.1 | ||
Conservative hold | Swing |
Party | Candidate | Votes | % | ± | |
---|---|---|---|---|---|
Labour | Roger Truelove | 991 | 41.6 | -3.3 | |
Conservative | Emma Bridges | 961 | 40.3 | -1.6 | |
Liberal Democrat | David Spurling | 432 | 18.1 | +4.9 | |
Majority | 30 | 1.3 | -1.7 | ||
Turnout | 2,384 | 63.6 | +29.7 | ||
Labour hold | Swing |
Party | Candidate | Votes | % | ± | |
---|---|---|---|---|---|
Conservative | Gareth Randall | 1,629 | 49.1 | -1.2 | |
Liberal Democrat | Bernie Lowe | 732 | 22.1 | +1.4 | |
Labour | Kenneth Rowles | 686 | 20.7 | -8.3 | |
UKIP | James Nash | 268 | 8.1 | +8.1 | |
Majority | 897 | 27.1 | +5.9 | ||
Turnout | 3,315 | 63.7 | |||
Conservative hold | Swing |
Party | Candidate | Votes | % | ± | |
---|---|---|---|---|---|
Conservative | Gerry Lewin | 1,745 | 54.0 | -12.9 | |
Labour | Ruth Walker-Grice | 514 | 15.9 | -0.8 | |
Liberal Democrat | Anne Jenkins | 511 | 15.8 | -0.6 | |
UKIP | Richard Palmer | 460 | 14.2 | +14.2 | |
Majority | 1,231 | 38.1 | -12.1 | ||
Turnout | 3,230 | 72.5 | |||
Conservative hold | Swing |
Party | Candidate | Votes | % | ± | |
---|---|---|---|---|---|
Conservative | Brenda Simpson | 1,743 | 55.8 | -9.8 | |
Labour | Martin McCusker | 766 | 24.5 | +1.8 | |
Liberal Democrat | Mary Zeng | 616 | 19.7 | +8.0 | |
Majority | 977 | 31.3 | -11.6 | ||
Turnout | 3,125 | 62.7 | +36.3 | ||
Conservative hold | Swing |
Party | Candidate | Votes | % | ± | |
---|---|---|---|---|---|
Conservative | Ken Pugh | 2,141 | 57.7 | +11.3 | |
Labour | Libby Tucker | 1,013 | 27.3 | +11.3 | |
UKIP | Alison Donkin | 557 | 15.0 | +15.0 | |
Majority | 1,128 | 30.4 | +15.4 | ||
Turnout | 3,711 | 64.5 | +33.0 | ||
Conservative hold | Swing |
Party | Candidate | Votes | % | ± | |
---|---|---|---|---|---|
Conservative | Ed Gent | 845 | 39.2 | +15.0 | |
Liberal Democrat | Keith Nevols | 695 | 32.2 | -25.8 | |
Labour | Shelley Cheesman | 618 | 28.6 | +10.8 | |
Majority | 150 | 7.0 | |||
Turnout | 2,158 | 56.3 | +31.4 | ||
Conservative gain from Liberal Democrat | Swing | ||||
Party | Candidate | Votes | % | ± | |
---|---|---|---|---|---|
Conservative | Richard Darby | 1,548 | |||
Labour | Jackie Constable | 1,504 | |||
Conservative | Mick Galvin | 1,316 | |||
Labour | Sean Dalton | 1,092 | |||
Turnout | 5,460 | 60.8 | +27.3 | ||
Conservative hold | Swing | ||||
Labour gain from Conservative | Swing | ||||
Party | Candidate | Votes | % | ± | |
---|---|---|---|---|---|
Conservative | Lloyd Bowen | 982 | 44.2 | +14.4 | |
Labour | Simon Clark | 813 | 36.6 | -21.6 | |
Liberal Democrat | David Philips | 425 | 19.1 | +7.1 | |
Majority | 169 | 7.6 | |||
Turnout | 2,220 | 60.7 | +31.0 | ||
Conservative gain from Labour | Swing | ||||
Party | Candidate | Votes | % | ± | |
---|---|---|---|---|---|
Conservative | Chris Foulds | 687 | 38.7 | +16.5 | |
Labour | Mark Ellen | 686 | 38.6 | +6.8 | |
Liberal Democrat | Colin Howe | 403 | 22.7 | +11.8 | |
Majority | 1 | 0.1 | |||
Turnout | 1,776 | 50.9 | +24.0 | ||
Conservative gain from Labour | Swing | ||||
Party | Candidate | Votes | % | ± | |
---|---|---|---|---|---|
Labour | Angela Harrison | 839 | 40.4 | -9.1 | |
Conservative | Dave Wilson | 768 | 37.0 | +20.0 | |
Liberal Democrat | David Kemp | 469 | 22.6 | +22.6 | |
Majority | 71 | 3.4 | -12.6 | ||
Turnout | 2,076 | 51.5 | +21.3 | ||
Labour hold | Swing |
Party | Candidate | Votes | % | ± | |
---|---|---|---|---|---|
Conservative | John Morris | 2,333 | 63.3 | +29.4 | |
Labour | Dennis Grover | 1,354 | 36.7 | +21.5 | |
Majority | 979 | 26.6 | |||
Turnout | 3,687 | 69.7 | +42.2 | ||
Conservative hold | Swing |
Party | Candidate | Votes | % | ± | |
---|---|---|---|---|---|
Conservative | Mike Cosgrove | 1,305 | 47.8 | +6.8 | |
Labour | Paul Durkin | 733 | 26.8 | +5.3 | |
Liberal Democrat | David Evans | 693 | 25.4 | +14.6 | |
Majority | 572 | 20.9 | +6.5 | ||
Turnout | 2,731 | 69.2 | +33.6 | ||
Conservative hold | Swing |
Party | Candidate | Votes | % | ± | |
---|---|---|---|---|---|
Conservative | Trevor Fentiman | 1,482 | 55.2 | -4.9 | |
Labour | David Feltham | 556 | 20.7 | -6.9 | |
Liberal Democrat | Dave Manning | 458 | 17.1 | +4.8 | |
UKIP | Aaron Donkin | 188 | 7.0 | +7.0 | |
Majority | 926 | 34.5 | +2.0 | ||
Turnout | 2,684 | 66.3 | +32.6 | ||
Conservative hold | Swing |
Party | Candidate | Votes | % | ± | |
---|---|---|---|---|---|
Conservative | Ted Wilcox | 1,411 | 49.9 | -9.4 | |
Liberal Democrat | Mike Wheeler | 899 | 31.8 | +21.2 | |
Labour | Judith Webb | 517 | 18.3 | +4.8 | |
Majority | 512 | 18.1 | -24.5 | ||
Turnout | 2,827 | 69.7 | +29.4 | ||
Conservative hold | Swing |
Party | Candidate | Votes | % | ± | |
---|---|---|---|---|---|
Conservative | Alan Willicombe | 1,628 | 51.8 | -3.8 | |
Liberal Democrat | Peter Springham | 656 | 20.9 | +3.5 | |
Labour | Geraldine Feltham | 574 | 18.3 | -1.8 | |
UKIP | Lee Burgess | 282 | 9.0 | +9.0 | |
Majority | 972 | 31.0 | -4.5 | ||
Turnout | 3,140 | 78.1 | +33.3 | ||
Conservative hold | Swing |
The 2008 St Helens Metropolitan Borough Council election took place on 1 May 2008 to elect members of St Helens Metropolitan Borough Council in Merseyside, England. One third of the council was up for election and the council stayed under no overall control.
The 2007 St Helens Metropolitan Borough Council election took place on 3 May 2007 to elect members of St Helens Metropolitan Borough Council in Merseyside, England. One third of the council was up for election and the council stayed under no overall control.
The 2006 Solihull Metropolitan Borough Council election took place on 4 May 2006 to elect members of Solihull Metropolitan Borough Council in the West Midlands, England. One third of the council was up for election and the Conservative party stayed in overall control of the council.
The 2007 Sandwell Metropolitan Borough Council election took place on 3 May 2007 to elect members of Sandwell Metropolitan Borough Council in the West Midlands, England. One third of the council was up for election and the Labour party stayed in overall control of the council.
The 2006 Maidstone Borough Council election took place on 4 May 2006 to elect members of Maidstone Borough Council in Kent, England. One third of the council was up for election and the council stayed under no overall control.
The 2010 Maidstone Borough Council election took place on 6 May 2010 to elect members of Maidstone Borough Council in Kent, England. One third of the council was up for election and the Conservative party stayed in overall control of the council.
The 2011 Swindon Borough Council election took place on 5 May 2011 to elect members of Swindon Unitary Council in Wiltshire, England. One third of the council was up for election and the Conservative party stayed in overall control of the council.
The 2007 Hertsmere Borough Council election took place on 3 May 2007 to elect members of Hertsmere Borough Council in Hertfordshire, England. One third of the council was up for election and the Conservative party stayed in overall control of the council.
The 2011 Wealden District Council election took place on 5 May 2011 to elect members of Wealden District Council in East Sussex, England. The whole council was up for election and the Conservative party stayed in overall control of the council.
The 2006 Brent London Borough Council election took place on 4 May 2006 to elect members of Brent London Borough Council in London, England. The whole council was up for election and the Labour party lost overall control of the council to no overall control.
The 2010 Brent London Borough Council election took place on 6 May 2010 to elect members of Brent London Borough Council in London, England. The whole council was up for election and the Labour party gained overall control of the council from no overall control.
The 2014 Brent London Borough Council election took place on 22 May 2014 to elect members of Brent London Borough Council in London, England. The whole council was up for election and the Labour Party stayed in overall control of the council.
The 2004 Swale Borough Council election took place on 10 June 2004 to elect members of Swale Borough Council in Kent, England. One third of the council was up for election and the Conservative party stayed in overall control of the council.
The 2006 Swale Borough Council election took place on 4 May 2006 to elect members of Swale Borough Council in Kent, England. One third of the council was up for election and the Conservative party stayed in overall control of the council.
The 2007 Swale Borough Council election took place on 3 May 2007 to elect members of Swale Borough Council in Kent, England. One third of the council was up for election and the Conservative party stayed in overall control of the council.
The 2008 Swale Borough Council election took place on 1 May 2008 to elect members of Swale Borough Council in Kent, England. One third of the council was up for election and the Conservative party stayed in overall control of the council.
The 2011 Swale Borough Council election took place on 5 May 2011 to elect members of Swale Borough Council in Kent, England. The whole council was up for election and the Conservative party stayed in overall control of the council.
An election was held in Swale Borough Council in England as part of the United Kingdom local elections on 7 May 2015. All 47 seats were up for election under new ward boundaries.
The 2007 West Oxfordshire District Council election took place on 3 May 2007 to elect members of West Oxfordshire District Council in Oxfordshire, England. One third of the council was up for election and the Conservative party stayed in overall control of the council.
The 2017 Kent County Council election was held on 4 May 2017 as part of the 2017 local elections in the United Kingdom. All 81 councillors were elected, from 72 electoral divisions, each of which returned either one or two county councillors by first-past-the-post voting for a four-year term of office.