Walsall Metropolitan Borough Council election, 2010

Last updated

Map of the results of the 2010 Walsall council election. Conservatives in blue, Labour in red, Liberal Democrats in yellow and independent in grey. Walsall UK local election 2006 map.svg
Map of the results of the 2010 Walsall council election. Conservatives in blue, Labour in red, Liberal Democrats in yellow and independent in grey.

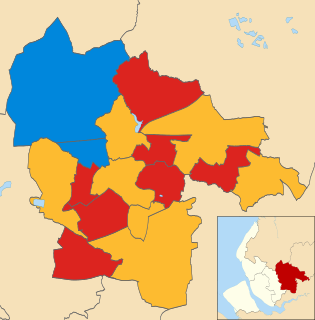
The 2010 Walsall Metropolitan Borough Council election took place on 6 May 2010 to elect members of Walsall Metropolitan Borough Council in the West Midlands, England. One third of the council was up for election and the Conservative party stayed in overall control of the council. [1]

Metropolitan Borough of Walsall Metropolitan borough in England

The Metropolitan Borough of Walsall is a local government district in the West Midlands, England, with the status of a metropolitan borough. It is named after its largest settlement, Walsall, but covers a larger area which also includes the towns of Aldridge, Bloxwich, Brownhills, Darlaston and Willenhall. The borough had an estimated population of 254,500 in 2007.

West Midlands (county) County of England

The West Midlands is a metropolitan county in western-central England with a 2014 estimated population of 2,808,356, making it the second most populous county in England after Greater London. It came into existence as a metropolitan county in 1974 after the passage of the Local Government Act 1972, formed from parts of Staffordshire, Worcestershire and Warwickshire. The county itself is a NUTS 2 region within the wider NUTS 1 region of the same name. The county consists of seven metropolitan boroughs: the City of Birmingham, the City of Coventry and the City of Wolverhampton, as well as the boroughs of Dudley, Sandwell, Solihull and Walsall.

England Country in north-west Europe, part of the United Kingdom

England is a country that is part of the United Kingdom. It shares land borders with Wales to the west and Scotland to the north-northwest. The Irish Sea lies west of England and the Celtic Sea lies to the southwest. England is separated from continental Europe by the North Sea to the east and the English Channel to the south. The country covers five-eighths of the island of Great Britain, which lies in the North Atlantic, and includes over 100 smaller islands, such as the Isles of Scilly and the Isle of Wight.

Contents

After the election, the composition of the council was

Conservative Party (UK) Political party in the United Kingdom

The Conservative Party, officially the Conservative and Unionist Party, is a centre-right political party in the United Kingdom. The governing party since 2010, it is the largest in the House of Commons, with 313 Members of Parliament, and also has 249 members of the House of Lords, 18 members of the European Parliament, 31 Members of the Scottish Parliament, 12 members of the Welsh Assembly, eight members of the London Assembly and 8,916 local councillors.

The Labour Party is a centre-left political party in the United Kingdom which has been described as an alliance of social democrats, democratic socialists and trade unionists. The party's platform emphasises greater state intervention, social justice and strengthening workers' rights.

Liberal Democrats (UK) Political party in the United Kingdom

The Liberal Democrats are a liberal political party in the United Kingdom. They have 11 Members of Parliament in the House of Commons, 96 members of the House of Lords, one member of the European Parliament, five Members of the Scottish Parliament and one member in the Welsh Assembly and London Assembly. At the height of its influence, the party formed a coalition government with the Conservative Party from 2010 to 2015 with its leader Nick Clegg serving as Deputy Prime Minister. It is currently led by Sir Vince Cable.

Election result

The results saw the Conservative remain in control of the council, with no change in their majority. [3] Labour gained Birchills-Leamore from the Conservatives, but also lost St Matthews back to the Conservatives. [3]

Birchills human settlement in United Kingdom

Birchills is a residential area of Walsall in the West Midlands of England. The appropriate Walsall ward is Birchills Leamore. The population of this ward taken at the 2011 census was 14,775.

Leamore is a mix of private and council housing, built since the late 19th century. The most significant homes in the area are several multi-storey blocks of council flats, which were built in the 1960s.

One seat was vacant in Bloxwich West after the election, as the former Conservative mayor of Walsall Melvin Pitt, whose seat had not been up for election, died on election night. [4]

Bloxwich town in the Metropolitan Borough of Walsall, West Midlands, England

Bloxwich is a small market town in the Metropolitan Borough of Walsall, West Midlands, England, situated in the north of the borough and forming part of the Staffordshire/West Midlands border.

In many countries, a mayor is the highest-ranking official in a municipal government such as that of a city or a town.

Walsall Local Election Result 2010 [2] [5]
PartySeatsGainsLossesNet gain/lossSeats %Votes %Votes+/−
  Conservative 10 1 1 0 50.0 39.5 45,500 -12.0%
  Labour 7 1 1 0 35.0 31.3 35,996 +6.5%
  Liberal Democrat 2 0 0 0 10.0 16.1 18,576 +3.9%
  Independent 1 0 0 0 5.0 3.4 3,910 +3.0%
  UKIP 0 0 0 0 0 5.5 6,293 +0.8%
  Green 0 0 0 0 0 1.4 1,560 -0.3%
  Democratic Labour 0 0 0 0 0 1.4 1,557 -2.1%
  BNP 0 0 0 0 0 1.1 1,289 +0.3%
  Pelsall Independent Alliance 0 0 0 0 0 0.4 413 +0.4%

Ward results

Aldridge Central and South [5]
PartyCandidateVotes%±
Conservative John O'Hare 3,827 51.8 -11.6
Liberal Democrat Roy Sheward 1,446 19.6 +9.1
Labour Sandy Bradie 1,324 17.9 +4.0
UKIP Malcolm Ford 629 8.5 -3.7
Green Mike Walters 155 2.1 +2.1
Majority 2,381 32.3 -17.2
Turnout 7,381 68.5 +34.9
Conservative hold Swing
Aldridge North and Walsall Wood [5]
PartyCandidateVotes%±
Conservative Anthony Harris 3,474 53.7 -17.1
Labour Harry Bradie 1,423 22.0 +8.9
Liberal Democrat Mark Greveson 1,318 20.4 +4.3
Green Helen Rust 250 3.9 +3.9
Majority 2,051 31.7 -23.1
Turnout 6,465 64.6 +36.6
Conservative hold Swing
Bentley and Darlaston North [5]
PartyCandidateVotes%±
Labour Rose Burley 2,120 42.8 -1.1
Conservative Gurmeet Sohal 1,487 30.0 -9.3
Liberal Democrat Trudy Pearce 713 14.4 +9.6
UKIP Anne Ford 590 11.9 +3.9
Democratic Labour Alan Paddock 44 0.9 +0.1
Majority 633 12.8 +8.2
Turnout 4,954 55.6 +27.8
Labour hold Swing
Birchills-Leamore [5]
PartyCandidateVotes%±
Labour Lee Jeavons 1,773 37.1 -17.5
Conservative Kamran Aftab 1,602 33.5 +2.5
Liberal Democrat Christine Cockayne 608 12.7 +12.7
UKIP James Sargent 524 11.0 +11.0
Democratic Labour Alan Davies 136 2.8 -3.5
Green Paul Booker 132 2.8 -5.3
Majority 171 3.6 -20.1
Turnout 4,775 50.7 +31.0
Labour gain from Conservative Swing
Blakenall [5]
PartyCandidateVotes%±
Labour Bob Thomas 1,576 40.9 +3.1
Conservative Hilda Derry 1,029 26.7 +5.5
Democratic Labour David Church 758 19.6 -14.4
Liberal Democrat Natalie Woodruff 495 12.8 +5.8
Majority 547 14.2 +10.4
Turnout 3,858 46.3 +23.9
Labour hold Swing
Bloxwich East [5]
PartyCandidateVotes%±
Labour Kath Phillips 1,886 41.2 +15.8
Conservative Clive Ault 1,638 35.8 -23.1
UKIP Alan Sheath 467 10.2 +10.2
Liberal Democrat Christopher Pearce 417 9.1 +0.2
Democratic Labour Stephen Baggott 173 3.8 -3.0
Majority 248 5.4
Turnout 4,581 54.2 +28.2
Labour hold Swing
Bloxwich West [5]
PartyCandidateVotes%±
Conservative Louise Harrison 2,329 40.7 -13.4
Labour Fred Westley 2,008 35.1 +17.6
BNP Chris Woodall 722 12.6 +12.6
Liberal Democrat Roy Robinson 563 9.8 +6.0
Green Zoe Henderson 97 1.7 +1.7
Majority 321 5.6 -31.0
Turnout 5,719 59.4 +31.9
Conservative hold Swing
Brownhills [5]
PartyCandidateVotes%±
Conservative Dave Turner 2,272 41.3 -25.3
Labour Richard Worrall 2,021 36.7 +9.8
Liberal Democrat John Garfitt 942 17.1 +17.1
Green Peter Walters 164 3.0 +3.0
Democratic Labour Andrew Bradburn 106 1.9 -4.6
Majority 251 4.6 -35.2
Turnout 5,505 58.7 +32.9
Conservative hold Swing
Darlaston South [5]
PartyCandidateVotes%±
Independent Paul Bott 1,761 36.0 +36.0
Labour Ann Wilson 1,684 34.4 -2.4
Conservative Jaqueline Perrins 968 19.8 -13.9
Liberal Democrat Ramtirth Singh 477 9.8 +4.8
Majority 77 1.6
Turnout 4,890 53.5 +30.4
Independent hold Swing
Paddock [5]
PartyCandidateVotes%±
Conservative Zahid Ali 2,933 42.9 -12.8
Labour Walter Burley 1,905 27.8 +10.1
Liberal Democrat Abdul Malik 733 10.7 +6.8
UKIP Derek Bennett 643 9.4 +0.3
Independent John Wood 630 9.2 +9.2
Majority 1,028 15.0 -33.1
Turnout 6,844 71.4 +35.8
Conservative hold Swing
Palfrey [5]
PartyCandidateVotes%±
Labour Mohammad Nazir 3,278 50.2 +10.4
Conservative Mohammed Khan 2,017 30.9 -12.3
Liberal Democrat Richard Cullum 1,235 18.9 +9.5
Majority 1,261 19.3
Turnout 6,530 64.1 +25.0
Labour hold Swing
Pelsall [5]
PartyCandidateVotes%±
Conservative Oliver Bennett 2,750 45.9 -33.1
Independent Sim Mayou 1,171 19.5 +19.5
Labour Paul Forrest 1,107 18.5 +9.9
Pelsall Independent Alliance Philip Evans 413 6.9 +6.9
UKIP Dorothy Sheath 363 6.1 +6.1
Green Alison Walters 123 2.1 +2.1
Democratic Labour Derek Roddy 69 1.2 -0.9
Majority 1,579 26.3 -42.4
Turnout 5,996 66.9 +31.4
Conservative hold Swing
Pheasey Park Farm [5]
PartyCandidateVotes%±
Conservative Christopher Towe 2,960 50.1 -14.0
Labour Jack Kelly 1,499 25.3 +10.4
UKIP Steve Grey 780 13.2 -2.3
Liberal Democrat Martin Barker 675 11.4 +5.8
Majority 1,461 24.7 -23.9
Turnout 5,914 68.6 +34.5
Conservative hold Swing
Pleck [5]
PartyCandidateVotes%±
Labour Harbans Sarohi 2,340 41.3 +5.6
Conservative Gulfam Wali 1,790 31.6 -1.4
Liberal Democrat Mohammed Yaqub 810 14.3 -6.1
UKIP Rita Oakley 383 6.8 +1.7
Independent Mark Dabbs 348 6.1 +0.3
Majority 550 9.7 +7.1
Turnout 5,671 60.1 +24.1
Labour hold Swing
Rushall-Shelfield [5]
PartyCandidateVotes%±
Conservative Rachel Andrew 2,348 43.8 -17.2
Labour Martin Harrower 1,448 27.0 +7.3
Liberal Democrat Roy Smith 956 17.8 +5.4
UKIP Tim Melville 439 8.2 +8.2
Green Karl Macnaughton 170 3.2 -3.7
Majority 900 16.8 -24.5
Turnout 5,361 60.3 +33.6
Conservative hold Swing
Short Heath [5]
PartyCandidateVotes%±
Liberal Democrat John Cook 2,053 38.2 -5.6
Conservative Theresa Smith 1,544 28.7 -0.9
Labour Doug Cleaver 1,200 22.3 +13.2
UKIP Darren Hazell 574 10.7 +10.7
Majority 509 9.5 -4.7
Turnout 5,371 59.3 +31.3
Liberal Democrat hold Swing
St. Matthews [5]
PartyCandidateVotes%±
Conservative Imran Azam 2,565 42.1 -9.7
Labour Eileen Russell 2,182 35.8 +2.9
Liberal Democrat Khosru Miah 866 14.2 +9.1
Green Robert Bellin 372 6.1 +2.0
Democratic Labour Brian Powell 114 1.9 +0.7
Majority 383 6.3 -12.6
Turnout 6,099 63.1 +24.3
Conservative gain from Labour Swing
Streetly [5]
PartyCandidateVotes%±
Conservative Eddie Hughes 4,622 60.2 -12.3
Labour Steven King 1,366 17.8 +5.3
Liberal Democrat Shirley Balgobin 1,056 13.8 +7.7
UKIP Paul Valdmanis 531 6.9 -2.0
Green Leandra Gebrakedan 97 1.3 +1.3
Majority 3,256 42.4 -17.7
Turnout 7,672 71.2 +38.2
Conservative hold Swing
Willenhall North [5]
PartyCandidateVotes%±
Liberal Democrat Valerie Woodruff 1,903 32.9 -24.7
Conservative Abi Pitt 1,667 28.8 +9.1
Labour Gareth Walker 1,273 22.0 +9.9
BNP Graham Hadlington 567 9.8 +9.8
UKIP Liz Hazell 370 6.4 -4.2
Majority 236 4.1 -33.8
Turnout 5,780 61.7 +37.4
Liberal Democrat hold Swing
Willenhall South [5]
PartyCandidateVotes%±
Labour Diane Coughlan 2,583 45.1 +1.9
Conservative Suky Samra 1,678 29.3 -2.0
Liberal Democrat Daniel Barker 1,310 22.9 +3.2
Democratic Labour Stephanie Peart 157 2.7 -3.1
Majority 905 15.8 +3.9
Turnout 5,728 54.3 +33.6
Labour hold Swing

Related Research Articles

2006 St Helens Metropolitan Borough Council election

The 2006 St Helens Metropolitan Borough Council election took place on 4 May 2006 to elect members of St Helens Metropolitan Borough Council in Merseyside, England. One third of the council was up for election and the council stayed under no overall control.

One third of Walsall Metropolitan Borough Council in the West Midlands, England is elected each year, followed by one year without election. Since the last boundary changes in 2004, 60 councillors have been elected from 20 wards.

The 1998 Walsall Metropolitan Borough Council election took place on 7 May 1998 to elect members of Walsall Metropolitan Borough Council in the West Midlands, England. One third of the council was up for election and the council stayed under no overall control.

The 2000 Sandwell Metropolitan Borough Council election took place on 4 May 2000 to elect members of Sandwell Metropolitan Borough Council in the West Midlands, England. One third of the council was up for election and the Labour party stayed in overall control of the council.

2007 Sandwell Metropolitan Borough Council election

The 2007 Sandwell Metropolitan Borough Council election took place on 3 May 2007 to elect members of Sandwell Metropolitan Borough Council in the West Midlands, England. One third of the council was up for election and the Labour party stayed in overall control of the council.

2011 Sandwell Metropolitan Borough Council election

The 2011 Sandwell Metropolitan Borough Council election took place on 5 May 2011 to elect members of Sandwell Metropolitan Borough Council in the West Midlands, England. One third of the council was up for election and the Labour party stayed in overall control of the council.

The 1999 Walsall Metropolitan Borough Council election took place on 6 May 1999 to elect members of Walsall Metropolitan Borough Council in the West Midlands, England. One third of the council was up for election and the Labour party gained overall control of the council from no overall control.

The 2000 Walsall Metropolitan Borough Council election took place on 4 May 2000 to elect members of Walsall Metropolitan Borough Council in the West Midlands, England. One third of the council was up for election and the Labour party lost overall control of the council to no overall control.

The 2002 Walsall Metropolitan Borough Council election took place on 2 May 2002 to elect members of Walsall Metropolitan Borough Council in the West Midlands, England. One third of the council was up for election and the council stayed under no overall control.

The 2003 Walsall Metropolitan Borough Council election took place on 1 May 2003 to elect members of Walsall Metropolitan Borough Council in the West Midlands, England. One third of the council was up for election and the council stayed under no overall control.

2004 Walsall Metropolitan Borough Council election

The 2004 Walsall Metropolitan Borough Council election took place on 10 June 2004 to elect members of Walsall Metropolitan Borough Council in the West Midlands, England. The whole council was up for election with boundary changes since the last election in 2003. The Conservative party gained overall control of the council from no overall control.

2006 Walsall Metropolitan Borough Council election

The 2006 Walsall Metropolitan Borough Council election took place on 4 May 2006 to elect members of Walsall Metropolitan Borough Council in the West Midlands, England. One third of the council was up for election and the Conservative party stayed in overall control of the council.

2007 Walsall Metropolitan Borough Council election

The 2007 Walsall Metropolitan Borough Council election took place on 3 May 2007 to elect members of Walsall Metropolitan Borough Council in the West Midlands, England. One third of the council was up for election and the Conservative party stayed in overall control of the council.

2008 Walsall Metropolitan Borough Council election

The 2008 Walsall Metropolitan Borough Council election took place on 1 May 2008 to elect members of Walsall Metropolitan Borough Council in the West Midlands, England. One third of the council was up for election and the Conservative party stayed in overall control of the council.

2011 Walsall Metropolitan Borough Council election

The 2011 Walsall Metropolitan Borough Council election took place on 5 May 2011 to elect members of Walsall Metropolitan Borough Council in the West Midlands, England. One third of the council was up for election and the Conservative party lost overall control of the council to no overall control.

The 2002 Crawley Borough Council election took place on 2 May 2002 to elect members of Crawley Borough Council in West Sussex, England. One third of the council was up for election and the Labour party stayed in overall control of the council.

Wirral Council Local government body in England

Wirral Metropolitan Borough Council, or simply Wirral Council, is the local authority of the Metropolitan Borough of Wirral in Merseyside, England. It is a metropolitan district council, one of five in Merseyside and one of 36 in the metropolitan counties of England, and provides the majority of local government services in Wirral. It is a constituent council of Liverpool City Region Combined Authority.

2015 United Kingdom local elections

The 2015 United Kingdom local elections were held on Thursday 7 May 2015, the same day as the general election for the House of Commons of the United Kingdom.

2018 United Kingdom local elections

Council elections in England were held on Thursday 3 May 2018. Elections were held in all 32 London boroughs, 34 metropolitan boroughs, 67 district and borough councils and 17 unitary authorities. There were also direct elections for the mayoralties of Hackney, Lewisham, Newham, Tower Hamlets and Watford.

References

  1. "Walsall". BBC News Online. 7 May 2010. Retrieved 23 September 2011.
  2. 1 2 "Local elections 2010". guardian.co.uk . 2010-05-07. Retrieved 23 September 2011.
  3. 1 2 "Walsall local elections: Conservatives remain in charge". Birmingham Mail . 7 May 2010. Retrieved 24 September 2011.
  4. "Ex Walsall mayor Melvin Pitt dies after short illness". BBC News Online. 7 May 2010. Retrieved 24 September 2011.
  5. 1 2 3 4 5 6 7 8 9 10 11 12 13 14 15 16 17 18 19 20 21 "Election results 2010 - Local election". Walsall Council. Retrieved 23 September 2011.