Coventry City Council election, 2008

Last updated

Map of the results of the 2008 Coventry election. Conservatives in blue, Liberal Democrats in yellow, Labour in light red, Socialist Party in dark red. Coventry UK ward map 2008 (results).svg
Map of the results of the 2008 Coventry election. Conservatives in blue, Liberal Democrats in yellow, Labour in light red, Socialist Party in dark red.

Elections for Coventry City Council were held on Thursday 1 May 2008. As the council is elected by thirds, one seat in each of the wards was up for election.

Coventry City Council Local government body in England

Coventry City Council is the local government body responsible for the governance of the City of Coventry in England, which has been a metropolitan district since 1974.

Contents

The Labour Party gained two seats (Radford, whose sitting councillor had been elected for Labour but later switched parties, and Foleshill) from the Conservative Party and the Conservatives gained one seat (Westwood) from Labour.

The Labour Party is a centre-left political party in the United Kingdom which has been described as an alliance of social democrats, democratic socialists and trade unionists. The party's platform emphasises greater state intervention, social justice and strengthening workers' rights.

Conservative Party (UK) Political party in the United Kingdom

The Conservative Party, officially the Conservative and Unionist Party, is a centre-right political party in the United Kingdom. Presently led by Theresa May, it has been the governing party since 2010. It presently has 314 Members of Parliament in the House of Commons, 249 members of the House of Lords, and 18 members of the European Parliament. It also has 31 Members of the Scottish Parliament, 12 members of the Welsh Assembly, eight members of the London Assembly and 9,008 local councillors. One of the major parties of UK politics, it has formed the government on 45 occasions, more than any other party.

The Conservative party lost overall control of the council, but remained the ruling party, with half of the seats.

Election result

Coventry Local Election Result 2008
PartySeatsGainsLossesNet gain/lossSeats %Votes %Votes+/−
  Conservative 9 1 2 -1 50.00 37.92 26,591 +3.85
  Labour 7 2 1 +1 38.90 35.60 24,964 -2.73
  Liberal Democrat 1 0 0 0 5.55 8.07 5,661 -2.12
  Socialist Alternative 1 0 0 0 5.55 2.74 1,920 +3.07
  BNP 0 0 0 0 0.00 7.90 5,535 -0.63
  Green 0 0 0 0 0.00 5.11 3,584 +2.04
  Independent 0 0 0 0 0.00 2.66 1,865 -0.34

Council Composition

The composition of the council before and after the election can be found in the following table:

PartyPrevious councilStaying councillorsSeats up for electionElection resultNew council
Conservative 29 19 10 9 27
Labour 23 17 6 7 24
Socialist Alternative 2 1 1 1 2
Liberal Democrat 1 0 1 0 1
BNP 0 0 0 0 0
Green 0 0 0 0 0
Independent 0 0 0 0 0
Total 54 36 18 18 54

Ward results

Note: Gains and holds of wards are noted with respect to the 2006 council election except for Radford - where the seat changed hands by defection.. Percentage changes are given with respect to the 2007 council election.

Turnout figures include spoilt ballots.

Bablake ward
PartyCandidateVotes%±
Conservative John Victor Gazey 2,546 58.74 +10.78
Labour Bilal Akhtar 917 21.16 -4.71
BNP Michele Jean Stone 443 10.22 +1.17
Green Ryan David Taylor 428 9.88 +4.26
Majority 1,629 37.59 +15.51
Turnout 4,334 36.33 -1.37
Conservative hold Swing
Binley and Willenhall ward
PartyCandidateVotes%±
Labour David Chater 1,467 42.42 -3.97
Conservative Julia Elizabeth Lepoidevin 1,021 29.53 +2.50
BNP Mark Badrick 437 12.64 -2.38
Liberal Democrat Brian Anthony McCarney 389 11.25 +3.06
Green Kenneth Christopher Jones 144 4.16 +0.79
Majority 446 12.90 -6.45
Turnout 3,458 28.94 -3.46
Labour hold Swing
Cheylesmore ward
PartyCandidateVotes%±
Conservative Hazel Margaret Noonan 1,903 46.63 -1.88
Labour Catherine Elizabeth Miks 1,224 29.99 -1.64
BNP Carl Stew 385 9.44 +1.19
Liberal Democrat Terence Kenny 351 8.60 -0.16
Green Aisa Kara 218 5.34 -2.32
Majority 679 16.64 +5.78
Turnout 4,081 34.33 -2.07
Conservative hold Swing
Earlsdon ward
PartyCandidateVotes%±
Conservative Allan Robert Andrews 2,515 52.31 +3.8
Labour Christopher Nicholas Youett 1,155 24.02 -1.44
Green Scott Redding 698 14.52 +1.14
Liberal Democrat Napier Penlington 440 9.15 +0.39
Majority 1,360 28.29 +5.24
Turnout 4,808 40.36 -1.60
Conservative hold Swing
Foleshill ward
PartyCandidateVotes%±
Labour Malkiat Singh Auluck 2,180 50.57 -7.20
Conservative Shabbir Ahmed 1,885 43.72 +13.26
Green Penny Walker 246 5.71 +3.65
Majority 295 6.84 -20.46
Turnout 4,311 39.84 -4.63
Labour gain from Conservative Swing
Henley ward
PartyCandidateVotes%±
Labour Ed Ruane 1,483 38.34 -11.05
Independent Brian David Patton 950 24.56 N/A
Conservative Val Stone 947 24.48 -2.4
BNP Simon Bien 488 12.62 +0.15
Majority 533 13.78 -8.73
Turnout 3,868 30.04 +2.18
Labour hold Swing
Holbrook ward
PartyCandidateVotes%±
Labour Joe Clifford 1,821 53.45 +4.79
Conservative Hazel Ann Reece 1.077 31.61 +7.38
BNP Simon Bien 509 14.94 +1.82
Majority 744 21.84 -2.59
Turnout 3,407 28.76 -0.91
Labour hold Swing
Longford ward
PartyCandidateVotes%±
Labour George Arthur Duggins 1,831 53.15 -3.63
Conservative Harbans Singh Gumman 762 22.12 -7.43
BNP Susan Gail Hillen 430 12.48 +4.65
Liberal Democrat Charles Coleman 286 8.30 N/A
Green Natalia Grana 136 3.95 -1.49
Majority 1,069 31.03 +3.8
Turnout 3,445 27.07 -2.16
Labour hold Swing
Lower Stoke ward
PartyCandidateVotes%±
Labour Jack Harrison 1,682 44.59 -1.61
Conservative Vinod Dogra 858 22.75 -4.31
Independent Christine Margaret Oddy 405 10.74 -5.31
BNP Darren Thomas 359 9.52 -1.17
Liberal Democrat Christine Marion Coleman 308 8.16 N/A
Green Laura Vesty 160 4.24 N/A
Majority 824 21.85 +2.71
Turnout 3,772 31.18 -2.21
Labour hold Swing
Radford ward
PartyCandidateVotes%±
Labour Mal Mutton 1,444 46.40 -4.77
Conservative Jane Marie Williams 796 25.58 +4.97
BNP Thomas Paul Jones 344 11.05 0.00
Liberal Democrat Frances Hilda Hawkey 273 8.77 +0.09
Green Cathy Wattebot 131 4.21 -0.22
Independent Dave Anderson 124 3.99 -0.22
Majority 648 20.82 -9.73
Turnout 3,112 25.30 -2.34
Labour gain from Conservative Swing
Sherbourne ward
PartyCandidateVotes%±
Conservative Gary Christopher Ridley 1,546 43.04 +10.49
Labour Seamus Walsh 1,123 31.26 -0.7
Liberal Democrat Stella Hewison 312 8.69 -1.97
BNP Justin Baldwin 280 7.79 -0.1
Green Charlotte Tittle 196 5.46 N/A
Socialist Alternative Jason Arnold Toynbee 135 3.76 -1.87
Majority 423 11.78 +11.18
Turnout 3,592 29.90 -1.49
Conservative hold Swing
St Michael's ward
PartyCandidateVotes%±
Socialist Alternative Dave Nellist 1,643 48.64 +8.15
Labour Motasem Ali 1,336 39.55 -3.88
Conservative Charles Stephen Cox 399 11.81 -4.27
Majority 307 9.09 +6.15
Turnout 3,378 26.10 +0.53
Socialist Alternative hold Swing
Upper Stoke ward
PartyCandidateVotes%±
Liberal Democrat Russell David Field 1,694 43.95 +5.97
Labour David Stewart Welsh 1,506 39.08 +1.03
Conservative Ian Ewart Johnson 482 12.51 +0.27
Green Bryn Tittle 172 4.46 N/A
Majority 188 4.88 +4.81
Turnout 3,854 31.39 -4.21
Liberal Democrat hold Swing
Wainbody ward
PartyCandidateVotes%±
Conservative John Anthony Blundell 2,470 61.05 +5.54
Labour Randhir Kaur Auluck 755 18.66 -4.77
Liberal Democrat Vincent John McKee 468 11.57 -0.94
Green John Walton 353 8.72 +0.17
Majority 1,715 42.39 +10.31
Turnout 4,046 32.71 -2.59
Conservative hold Swing
Westwood ward
PartyCandidateVotes%±
Conservative Marcus Edgar Lapsa 1,713 43.16 +5.06
Labour Dave Batten 1,389 34.99 -0.44
BNP Matthew Mason 425 10.71 -1.47
Liberal Democrat Jacqueline Bridget Basu 277 6.98 -3.01
Green Jesse Meadows 165 4.16 N/A
Majority 324 8.16 +5.49
Turnout 3,969 32.11 -0.09
Conservative gain from Labour Swing
Whoberley ward
PartyCandidateVotes%±
Conservative Roger Maurice James Bailey 1,586 38.28 +3.14
Labour Bally Singh 1,372 33.12 +1.24
Liberal Democrat Brian Rees Lewis 328 7.92 -7.57
BNP Anthony Angliss 300 7.24 -0.40
Independent Joan Ann Griffin 222 5.36 -4.49
Green Gianluca Grimalda 193 4.65 N/A
Socialist Alternative Jim Donnelly 142 3.43 N/A
Majority 214 5.17 +1.91
Turnout 4,143 34.10 -0.03
Conservative hold Swing
Woodlands ward
PartyCandidateVotes%±
Conservative Heather Jean Johnson 2,206 49.83 +2.49
Labour Shagufta Hamid-Khan 791 17.88 -2.32
BNP David Clarke 720 16.26 +0.36
Liberal Democrat Stephen Howarth 535 12.08 -4.48
Green Danny Foulstone 175 3.95 N/A
Majority 1,415 31.96 +4.82
Turnout 4,427 35.70 -0.21
Conservative hold Swing
Wyken ward
PartyCandidateVotes%±
Conservative Susanna Ella Dixon 1,879 45.66 +10.67
Labour Faye Sweet 1,488 36.16 -3.23
BNP Steven John Pittaway 415 10.09 -0.69
Green Jo Rathbone 169 4.11 N/A
Independent Adrian Roll 84 2.04 +0.08
Independent Mick Noonan 80 1.94 -2.14
Majority 391 9.50 +5.1
Turnout 4,115 33.83 +0.02
Conservative hold Swing

Related Research Articles

Sunderland City Council Local government body in England

Sunderland City Council is the local authority of the City of Sunderland in Tyne and Wear, England. It is a metropolitan district council, one of five in Tyne and Wear and one of 36 in the metropolitan counties of England, and provides the majority of local government services in Sunderland.

2004 Preston City Council election

This article shows the results of local elections for Preston City Council, in Lancashire held on 10 June 2004

Elections to Coventry City Council were held on 4 May 2006. One third of the council was up for election and the Conservative party took overall control of the council.

2007 Coventry City Council election

Elections for Coventry City Council were held on Thursday 3 May 2007. As the council is elected by thirds, one seat in each of the wards was up for election.

Elections to the Borough Council in Slough, England, were held on 1 May 2008. This was the 123rd Slough general local authority election since Slough became a local government unit in 1863.

Elections for Oxford City Council were held on Thursday 1 May 2008. As Oxford City Council is elected by halves, one seat in each of the 24 wards is up for election.

2008 Tamworth Borough Council election

The 2008 Tamworth Borough Council election took place on 1 May 2008 to elect members of Tamworth District Council in Staffordshire, England. One third of the council was up for election and the Conservative party stayed in overall control of the council.

2007 St Albans City and District Council election

The 2007 St Albans City and District Council election took place on 3 May 2007 to elect members of St Albans District Council in Hertfordshire, England. One third of the council was up for election and the Liberal Democrats lost overall control of the council to no overall control.

2007 Winchester City Council election

The 2007 Winchester Council election took place on 3 May 2007 to elect members of Winchester District Council in Hampshire, England. One third of the council was up for election and the Conservative party stayed in overall control of the council.

2004 Coventry City Council election

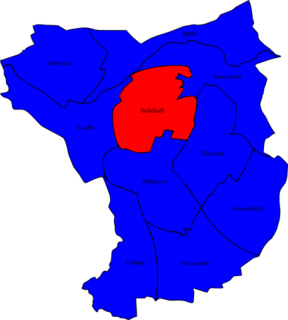
Elections to Coventry City Council were held in June 2004. Due to boundary changes, the entire council was up for election. The council remained with no overall control, but the Conservatives became the largest party.

The 2003 Stratford-on-Avon District Council election took place on 1 May 2003 to elect members of Stratford-on-Avon District Council in Warwickshire, England. One third of the council was up for election and the Conservative party gained overall control of the council from no overall control.

Elections for Oxford City Council were held on Thursday 6 May 2010. As Oxford City Council is elected by halves, one seat in each of the 24 wards was up for election.

1979 United Kingdom local elections

Local elections were held in the United Kingdom on 3 May 1979. The results provided some source of comfort to the Labour Party (UK), who recovered some lost ground from local election reversals in previous years, despite losing the general election to the Conservative Party on the same day.

2003 Solihull Metropolitan Borough Council election

The 2003 Solihull Metropolitan Borough Council election took place on 1 May 2003 to elect members of Solihull Metropolitan Borough Council in the West Midlands, England. One third of the council was up for election and the Conservative party stayed in overall control of the council.

2010 Coventry City Council election

Elections for Coventry City Council were held on Thursday 6 May 2010. As the council is elected by thirds, one seat in each of the wards was up for election.

Elections to Preston City Council took place on 3 May 2012, the same day as other United Kingdom local elections, 2012.

2012 Coventry City Council election

Elections for Coventry City Council were held on Thursday, 3 May 2012, the same day as other 2012 local elections in the United Kingdom. As the council is elected by thirds, one seat in each of the city's 18 wards was up for election. The Labour Party won the seat in 15 of the wards, gaining a total of 8 and increasing their majority to 32 seats. The Conservative Party won the remaining three seats, losing six, with the Liberal Democrats and the Socialist Party both losing their only seat on the council.

2012 City of Bradford Metropolitan District Council election

The 2012 City of Bradford Metropolitan District Council election took place on 3 May 2012. The elections took place shortly after the Bradford West by-election, in which the Respect Party's George Galloway pulled off a shock victory against the incumbent Labour Party. Held alongside was a referendum on directly elected mayors. The Labour Party were one seat short of an overall majority following the election, leaving the council in no overall control.

2014 Plymouth City Council election

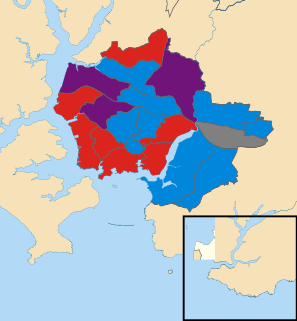
The 2014 Plymouth City Council election took place on 22 May 2014 to elect members of Plymouth City Council in England. This was on the same day as other local elections. The election was won by the Labour Party, who maintained their overall majority. The UK Independence Party gained representation on the council for the first time, and this was the only election in which the party won seats in Plymouth.

2015 Norwich City Council election

The 2015 Norwich City Council election took place on 7 May 2015 to elect approximately one third of the members of Norwich City Council in England. This was on the same day as other local elections and the UK general election. Thirteen seats were due to be contested, with a further two seats up for election where casual vacancies had arisen. Labour won ten of the available seats, the Green Party won four, and the Liberal Democrats one. The Conservatives gained their highest ever vote in many city wards including Town Close and Thorpe Hamlet, and across Norwich came within almost 2000 votes of the Green Party, however failed to gain any seats. Just one seat changed hands - Wensum - which Labour gained from the Greens. Labour retained overall control of the council with 22 seats out of 39, the Greens continue to form the main opposition with 14 seats, and the Liberal Democrats have 3.

References