| |||||||||||||||||||||||||
One third (40) seats to Birmingham City Council 61 seats needed for a majority | |||||||||||||||||||||||||
| |||||||||||||||||||||||||
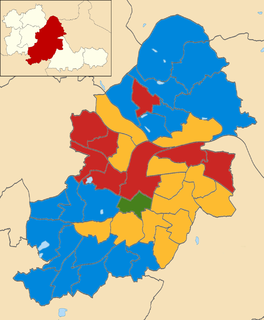
2016 local election results in Birmingham. | |||||||||||||||||||||||||
|
The 2016 Birmingham City Council election took place on 5 May 2016 [1] [2] [3] to elect one third of the members of Birmingham City Council in England. The election was held on the same day as the election of a Police and Crime Commissioner for the West Midlands as part of the 2016 Police and Crime Commissioner elections.
Birmingham City Council is the local government body responsible for the governance of the City of Birmingham in England, which has been a metropolitan district since 1974. It is the most populated local council in the United Kingdom with, following a reorganisation of boundaries in June 2004, 120 Birmingham City councillors representing over one million people, in 40 wards. This means that Birmingham is technically the largest city in the United Kingdom. The council headquarters are at the Council House in the city centre. The council is responsible for running nearly all local services, with the exception of those run by joint boards. The provision of certain services has in recent years been devolved to several council constituencies, which each have a constituency committee made up of councillors from that district.
West Midlands Police is the territorial police force responsible for policing the metropolitan county of West Midlands in England.
Labour increased their hold on the City Council, winning 30 of the 40 seats up for election, gaining 1 from the Conservatives and 1 from the Liberal Democrats as well as retaining 1 previously vacant seat formerly held by a Labour Councillor.
The Labour Party is a centre-left political party in the United Kingdom which has been described as an alliance of social democrats, democratic socialists and trade unionists. The party's platform emphasises greater state intervention, social justice and strengthening workers' rights.
The Conservative Party, officially the Conservative and Unionist Party, is a centre-right political party in the United Kingdom. Presently led by Theresa May, it has been the governing party since 2010. It presently has 314 Members of Parliament in the House of Commons, 249 members of the House of Lords, and 18 members of the European Parliament. It also has 31 Members of the Scottish Parliament, 12 members of the Welsh Assembly, eight members of the London Assembly and 9,008 local councillors. One of the major parties of UK politics, it has formed the government on 45 occasions, more than any other party.
The Liberal Democrats are a liberal political party in the United Kingdom. They presently have 11 Members of Parliament in the House of Commons, 96 members of the House of Lords, and one member of the European Parliament. They also have five Members of the Scottish Parliament and a member each in the Welsh Assembly and London Assembly. The party reached the height of its influence in the early 2010s, forming a junior partner in a coalition government from 2010 to 2015. It is presently led by Vince Cable.
Party | Seats | Gains | Losses | Net gain/loss | Seats % | Votes % | Votes | +/− | |
---|---|---|---|---|---|---|---|---|---|
Labour | 30 | 75 | 51.1 | 113,018 | |||||
Conservative | 7 | 17.5 | 23.0 | 50,828 | |||||
Liberal Democrat | 3 | 7.5 | 12.2 | 26,877 | |||||
UKIP | 0 | 0 | 8.1 | 17,801 | |||||
Green | 0 | 0 | 4.5 | 9,920 | |||||
Independent | 0 | 0 | 0.5 | 989 | |||||
TUSC | 0 | 0 | 0.4 | 937 | |||||
Socialist Labour | 0 | 0 | 0.2 | 358 | |||||
Christian | 0 | 0 | 0.1 | 310 | |||||
National Front | 0 | 0 | 0.1 | 104 | |||||
SDP | 0 | 0 | 0.0 | 58 | |||||
Totals | 40 | 221,200 | |||||||
Prior to the election, the composition of the council was:
77 | 30 | 11 | 1 | 1 |
Labour | Conservative | Lib Dem | Ind | Vac |
After the election, the composition of the council was:
80 | 29 | 10 | 1 |
Labour | Conservative | Lib Dem | Ind |
Party | Candidate | Votes | % | ± | |
---|---|---|---|---|---|
Labour | John O'Shea | 2,760 | 48.0 | ||
Liberal Democrat | Penny Wagg | 2,136 | 37.1 | ||
Conservative | Richard Sparkes | 467 | 8.1 | ||
Green | Amanda Baker | 225 | 3.9 | ||
TUSC | Eamonn Flynn | 131 | 2.3 | ||
SDP | Alan Ware | 32 | 0.6 | ||
Majority | 624 | 10.9 | |||
Turnout | 5,751 | 30.4 | |||
Labour hold | Swing | ||||
Party | Candidate | Votes | % | ± | |
---|---|---|---|---|---|
Labour | Nagina Kauser | 5,047 | 88.6 | ||
Conservative | Jahid Choudhury | 208 | 3.7 | ||
Green | Christopher Garghan | 181 | 3.2 | ||
Christian | Adrian Dawkins | 159 | 2.8 | - | |
Liberal Democrat | Yaser Iqbal | 100 | 1.8 | ||
Majority | 4,839 | 85.0 | |||
Turnout | 5,695 | 32.2 | |||
Labour hold | Swing | ||||
Party | Candidate | Votes | % | ± | |
---|---|---|---|---|---|
Conservative | Des Flood | 2,080 | 45.0 | ||
Labour | Saddak Miah | 1,270 | 27.5 | ||
UKIP | Tony Hayes | 827 | 17.9 | ||
Green | Peter Thorneycroft | 216 | 4.7 | ||
Liberal Democrat | Julia Garrett | 165 | 3.6 | ||
TUSC | Moira O'Driscoll | 62 | 1.3 | ||
Majority | 810 | 17.5 | |||
Turnout | 4,620 | 27.3 | |||
Conservative hold | Swing | ||||
Party | Candidate | Votes | % | ± | |
---|---|---|---|---|---|
Labour | Phil Davis | 2,730 | 52.2 | ||
UKIP | James Dalton | 1,052 | 20.1 | ||
Conservative | Aaron Humphriss | 1,045 | 20.0 | ||
Green | Clare Thomas | 218 | 4.2 | ||
Liberal Democrat | Alan Morrow | 187 | 3.6 | ||
Majority | 1,678 | 32.1 | |||
Turnout | 5,232 | 28.4 | |||
Labour hold | Swing | ||||
Party | Candidate | Votes | % | ± | |
---|---|---|---|---|---|
Labour | Uzma Ahmed | 4,300 | 58.3 | ||
Liberal Democrat | Shaukat Khan | 2,298 | 31.2 | ||
UKIP | Mohammed Khan | 337 | 4.6 | ||
Green | Alan Clawley | 242 | 3.3 | ||
Conservative | Guy Hordern | 198 | 2.7 | ||
Majority | 2,002 | 27.1 | |||
Turnout | 7,375 | 37.2 | |||
Labour hold | Swing | ||||
Party | Candidate | Votes | % | ± | |
---|---|---|---|---|---|
Labour | Mary Locke | 3,408 | 42.9 | ||
Conservative | Nigel Dawkins | 3,095 | 38.9 | ||
Green | Ian Jamieson | 695 | 8.7 | ||
UKIP | Sylvia Tempest-Jones | 514 | 6.5 | ||
Liberal Democrat | Robert Gilliam | 196 | 2.4 | ||
Majority | 313 | 3.9 | |||
Turnout | 7,948 | 42.3 | |||
Labour hold | Swing | ||||
Party | Candidate | Votes | % | ± | |
---|---|---|---|---|---|
Labour | Eva Phillips | 3,520 | 56.1 | ||
Conservative | Neville Summerfield | 1,485 | 23.7 | ||
UKIP | Alan Blumenthal | 813 | 13.0 | ||
Green | Patrick Cox | 266 | 4.2 | ||
Liberal Democrat | Richard Smith | 186 | 3.0 | ||
Majority | 2,035 | 32.4 | |||
Turnout | 6,270 | 35.1 | |||
Labour hold | Swing | ||||
Party | Candidate | Votes | % | ± | |
---|---|---|---|---|---|
Conservative | Deirdre Alden | 2,043 | 44.6 | ||
Labour | Tom Keeley | 1,967 | 42.9 | ||
Green | Joe Belcher | 222 | 4.8 | ||
UKIP | Peter Hughes | 180 | 3.9 | ||
Liberal Democrat | Lee Dargue | 174 | 3.8 | ||
Majority | 76 | 1.7 | |||
Turnout | 4,586 | 32.3 | |||
Conservative hold | Swing | ||||
Party | Candidate | Votes | % | ± | |
---|---|---|---|---|---|
Conservative | Bob Beauchamp | 2,722 | 53.0 | ||
Labour | Keith Heron | 1,701 | 33.1 | ||
UKIP | Steve Cooling | 462 | 9.0 | ||
Green | Joe Rooney | 122 | 2.4 | ||
Liberal Democrat | Philip Mills | 103 | 2.0 | ||
TUSC | Joe Foster | 30 | 0.6 | ||
Majority | 1,021 | 19.9 | |||
Turnout | 5,140 | 31.9 | |||
Conservative hold | Swing | ||||
Party | Candidate | Votes | % | ± | |
---|---|---|---|---|---|
Labour | Barry Bowles | 2,827 | 42.2 | ||
Conservative | Tom Skidmore | 1,823 | 27.2 | ||
Independent | Bob Harvey | 989 | 14.8 | ||
Liberal Democrat | Tavneer Choudhry | 467 | 7.0 | ||
UKIP | Malcolm Mummery | 400 | 6.1 | ||
Green | Rachel Xerri-Brooks | 162 | 2.4 | ||
TUSC | David Wright | 20 | 0.3 | ||
Majority | 1,004 | 5.9 | |||
Turnout | 6,688 | 35.2 | |||
Labour hold | Swing | ||||
Party | Candidate | Votes | % | ± | |
---|---|---|---|---|---|
Labour | Gurdial Atwal | 3,743 | 66.8 | ||
Conservative | Sukhwinder Sungu | 863 | 15.4 | ||
Green | Chloe Juliette | 370 | 6.6 | ||
Socialist Labour | John Tyrrell | 358 | 6.4 | ||
Liberal Democrat | Valvinder Kaur | 267 | 4.8 | ||
Majority | 2,880 | 51.4 | |||
Turnout | 5,601 | 30.7 | |||
Labour hold | Swing | ||||
Party | Candidate | Votes | % | ± | |
---|---|---|---|---|---|
Labour | Jayne Francis | 2,841 | 44.7 | ||
Conservative | Akaal Sidhu | 2,404 | 37.8 | ||
Green | Phil Simpson | 494 | 7.8 | ||
UKIP | Mary Morris | 376 | 5.9 | ||
Liberal Democrat | Philip Banting | 240 | 3.8 | ||
Majority | 437 | 6.9 | |||
Turnout | 6,355 | 39.2 | |||
Labour hold | Swing | ||||
Party | Candidate | Votes | % | ± | |
---|---|---|---|---|---|
Labour | Diane Donaldson | 3,433 | 66.0 | ||
UKIP | David Bridges | 680 | 13.1 | ||
Liberal Democrat | Gwyn Neilly | 542 | 10.4 | ||
Conservative | Parveen Hassan | 405 | 7.8 | ||
Green | Michael Harrison | 114 | 2.2 | ||
SDP | Peter Johnson | 26 | 0.5 | ||
Majority | 2,753 | 52.9 | |||
Turnout | 5,200 | 29.8 | |||
Labour hold | Swing | ||||
Party | Candidate | Votes | % | ± | |
---|---|---|---|---|---|
Labour | Valerie Seabright | 1,834 | 38.7 | ||
Conservative | Barbara Wood | 1,811 | 38.3 | ||
UKIP | Tim Plumbe | 722 | 15.3 | ||
Liberal Democrat | Peter Lloyd | 196 | 4.1 | ||
Green | Eleanor Masters | 172 | 3.6 | ||
Majority | 23 | 0.5 | |||
Turnout | 4,735 | 29.3 | |||
Labour hold | Swing | ||||
Party | Candidate | Votes | % | ± | |
---|---|---|---|---|---|
Conservative | Gary Sambrook | 1,858 | 43.5 | ||
Labour | Jane Jones | 1,651 | 38.6 | ||
UKIP | Philip Davies | 593 | 13.9 | ||
Green | Anne Okole | 89 | 2.1 | ||
Liberal Democrat | Graham Lippiatt | 48 | 1.1 | ||
National Front | Terry Williams | 21 | 0.5 | ||
TUSC | Joseph Derbyshire | 16 | 0.4 | ||
Majority | 207 | 4.8 | |||
Turnout | 4,276 | 26.1 | |||
Conservative hold | Swing | ||||
Party | Candidate | Votes | % | ± | |
---|---|---|---|---|---|
Labour | Kath Hartley | 2,337 | 62.7 | ||
Conservative | Rob Coleman | 735 | 19.7 | ||
Green | Sara Myers | 372 | 10.0 | ||
Liberal Democrat | Gareth Hardy | 284 | 7.6 | ||
Majority | 1,602 | 43.0 | |||
Turnout | 3,728 | 22.0 | |||
Labour hold | Swing | ||||
Party | Candidate | Votes | % | ± | |
---|---|---|---|---|---|
Labour | Carole Griffiths | 1,753 | 39.74 | ||
Conservative | Dan Caldicott | 1,316 | 29.83 | ||
UKIP | Kevin Morris | 993 | 22.51 | ||
Green | Elizabeth Sharman | 152 | 3.45 | ||
Liberal Democrat | Kevin Hannon | 147 | 3.33 | ||
TUSC | Clive Walder | 50 | 1.13 | ||
Majority | 437 | 9.91 | |||
Turnout | 4,411 | ||||
Labour hold | Swing | ||||
Party | Candidate | Votes | % | ± | |
---|---|---|---|---|---|
Labour | Mahmood Hussain | 4,967 | |||
Conservative | Ravi Chumber | 448 | |||
Green | Hazel Clawley | 295 | |||
Liberal Democrat | Baljinder Kaur | 250 | |||
Majority | 4,519 | ||||
Turnout | |||||
Labour hold | Swing | ||||
Party | Candidate | Votes | % | ± | |
---|---|---|---|---|---|
Labour | Lisa Trickett | 4,029 | 55.3% | ||
Liberal Democrat | Martin Mullaney | 1,945 | 26.7% | ||
Green | Robert Grant | 554 | 7.6% | ||
Conservative | Owen Williams | 522 | 7.2% | ||
UKIP | Kenneth Lowry | 231 | 3.2% | ||
Majority | 2,084 | ||||
Turnout | 7281 | ||||
Labour hold | Swing | ||||
Party | Candidate | Votes | % | ± | |
---|---|---|---|---|---|
Labour | Tahir Ali | 3,405 | |||
Conservative | Emma Watkins | 414 | |||
Green | Janet Assheton | 295 | |||
Liberal Democrat | Nicholas Jolliffe | 174 | |||
Majority | 2,991 | ||||
Turnout | |||||
Labour hold | Swing | ||||
Party | Candidate | Votes | % | ± | |
---|---|---|---|---|---|
Labour | Brett O'Reilly | 2,283 | 38.93 | ||
Conservative | Les Lawrence | 2,098 | 35.78 | ||
UKIP | Keith Rowe | 752 | 12.82 | ||
Green | Fiona Nunan | 575 | 9.81 | ||
Liberal Democrat | Andy Moles | 156 | 2.66 | ||
Majority | 185 | 3.15 | |||
Turnout | 5,864 | ||||
Labour hold | Swing | ||||
Party | Candidate | Votes | % | ± | |
---|---|---|---|---|---|
Labour | Tristan Chatfield | 2,042 | |||
Conservative | Graham Green | 1,100 | |||
UKIP | Roger Tempest | 926 | |||
Liberal Democrat | Andrew Fullylove | 164 | |||
Green | Harry Eyles | 108 | |||
National Front | Adrian Davidson | 37 | |||
Majority | 942 | ||||
Turnout | |||||
Labour hold | Swing | ||||
Party | Candidate | Votes | % | ± | |
---|---|---|---|---|---|
Liberal Democrat | Ray Hassall | 3,248 | |||
Labour | Mohammed Hanif | 2,085 | |||
Conservative | Alain Hurst | 338 | |||
Green | Beck Collins | 200 | |||
Majority | 1,163 | ||||
Turnout | |||||
Liberal Democrat hold | Swing | ||||
Party | Candidate | Votes | % | ± | |
---|---|---|---|---|---|
Labour | Kate Booth | 2,668 | 45.89 | ||
Conservative | Georgina Chandler | 2,067 | 35.55 | ||
UKIP | Martin Barrett | 641 | 11.03 | ||
Green | James Robertson | 225 | 3.87 | ||
Liberal Democrat | Ian Garrett | 185 | 3.18 | ||
TUSC | Nick Hart | 28 | 0.48 | ||
Majority | 601 | 10.34 | |||
Turnout | 5,814 | ||||
Labour hold | Swing | ||||
Party | Candidate | Votes | % | ± | |
---|---|---|---|---|---|
Labour | Karen McCarthy | 2,141 | 51.5 | ||
Conservative | Monica Hardie | 779 | 18.7 | ||
Liberal Democrat | Colin Green | 763 | 18.4 | ||
Green | Daniel Wilshire | 381 | 9 | ||
TUSC | Theo Sharieff | 67 | 1.6 | ||
Majority | 1,362 | 32.8 | |||
Turnout | 4,131 | ||||
Labour hold | Swing | ||||
Party | Candidate | Votes | % | ± | |
---|---|---|---|---|---|
Labour | Marjorie Birdle | 2,437 | |||
UKIP | Paul Clayton | 1,178 | |||
Conservative | Nick Psirides | 284 | |||
Green | Sam Braithwaite | 106 | |||
Liberal Democrat | Christopher Barber | 104 | |||
Majority | 1,259 | ||||
Turnout | |||||
Labour hold | Swing | ||||
Party | Candidate | Votes | % | ± | |
---|---|---|---|---|---|
Liberal Democrat | Sue Anderson | 2,742 | 58.41 | ||
Labour | Bob Collins | 928 | 19.77 | ||
UKIP | Attiqa Khan | 486 | 10.35 | ||
Conservative | Alexander Hall | 314 | 6.69 | ||
Green | Max Ramsay | 142 | 3.03 | ||
National Front | Paul Morris | 46 | 0.98 | ||
TUSC | Richard Carter | 36 | 0.77 | ||
Majority | 1,814 | 38.65 | |||
Turnout | 4,694 | ||||
Liberal Democrat hold | Swing | ||||
Party | Candidate | Votes | % | ± | |
---|---|---|---|---|---|
Labour | Chaman Lal | 4,263 | |||
Conservative | Robert Higginson | 440 | |||
Green | Kefentse Dennis | 262 | |||
Liberal Democrat | Morriam Jan | 193 | |||
Christian | Pastor Gabriel Ukandu | 151 | |||
Majority | 3,823 | ||||
Turnout | |||||
Labour hold | Swing | ||||
Party | Candidate | Votes | % | ± | |
---|---|---|---|---|---|
Labour | Zafar Iqbal | 3,112 | |||
Liberal Democrat | Baber Baz | 2,361 | |||
Conservative | Neil Shastri-Hurst | 408 | |||
TUSC | Mark Andrews | 372 | |||
Green | Ulla Grant | 207 | |||
Majority | 751 | ||||
Turnout | |||||
Labour hold | Swing | ||||
Party | Candidate | Votes | % | ± | |
---|---|---|---|---|---|
Labour | Mohammed Azim | 6,069 | 87.61 | ||
Conservative | Santhi Rajakaruna | 343 | 4.95 | ||
Green | Elly Stanton | 307 | 4.43 | ||
Liberal Democrat | Blair Kesseler | 208 | 3.00 | ||
Majority | 5,726 | 82.66 | |||
Turnout | 6,927 | ||||
Labour hold | Swing | ||||
Party | Candidate | Votes | % | ± | |
---|---|---|---|---|---|
Labour | Shabrana Hussain | 3,828 | 47.44 | ||
Liberal Democrat | Jerry Evans | 3,775 | 46.78 | ||
Conservative | Adam Higgs | 292 | 3.62 | ||
Green | Seeyam Brijmohun | 174 | 2.16 | ||
Majority | 53 | 0.66 | |||
Turnout | 8,069 | ||||
Labour gain from Liberal Democrat | Swing | ||||
Party | Candidate | Votes | % | ± | |
---|---|---|---|---|---|
Liberal Democrat | Neil Eustace | 3,001 | |||
Labour | Cheryl Garvey | 1,721 | |||
UKIP | Graham Duffen | 580 | |||
Conservative | Mary Storer | 193 | |||
Green | Julien Pritchard | 70 | |||
Majority | 1,280 | ||||
Turnout | |||||
Liberal Democrat hold | Swing | ||||
Party | Candidate | Votes | % | ± | |
---|---|---|---|---|---|
Labour | Josh Jones | 2,533 | |||
Conservative | Leona Leung | 698 | |||
UKIP | Albert Meehan | 535 | |||
Liberal Democrat | Franklyn Aaron | 189 | |||
Green | Darren Smith | 133 | |||
TUSC | Ted Woodley | 71 | |||
Majority | 1,835 | ||||
Turnout | |||||
Labour hold | Swing | ||||
Party | Candidate | Votes | % | ± | |
---|---|---|---|---|---|
Conservative | Meirion Jenkins | 4,022 | 61.67 | ||
Labour | Peter French | 970 | 14.87 | ||
UKIP | Stephen Shorrock | 845 | 12.96 | ||
Liberal Democrat | Hubert Duffy | 354 | 5.43 | ||
Green | David Ratcliff | 331 | 5.08 | ||
Majority | 3,052 | 46.80 | |||
Turnout | 6,522 | ||||
Conservative hold | Swing | ||||
Party | Candidate | Votes | % | ± | |
---|---|---|---|---|---|
Conservative | Alex Yip | 3,277 | 58.71 | ||
Labour | Ian Brindley | 1,007 | 18.04 | ||
UKIP | Stewart Cotterill | 856 | 15.34 | ||
Green | Colin Marriott | 231 | 4.14 | ||
Liberal Democrat | Trevor Holtom | 211 | 3.78 | ||
Majority | 2,270 | 40.67 | |||
Turnout | 5582 | ||||
Conservative hold | Swing | ||||
Party | Candidate | Votes | % | ± | |
---|---|---|---|---|---|
Conservative | Margaret Waddington | 2,890 | |||
Labour | Roger Barley | 1,265 | |||
UKIP | Michael Joyce | 879 | |||
Liberal Democrat | Jennifer Wilkinson | 360 | |||
Green | Eloise England | 309 | |||
Majority | 1,625 | ||||
Turnout | |||||
Conservative hold | Swing | ||||
Party | Candidate | Votes | % | ± | |
---|---|---|---|---|---|
Labour | Rob Pocock | 4,102 | |||
Conservative | Suzanne Webb | 2,303 | |||
UKIP | Maureen Smith | 457 | |||
Green | Zoe Challenor | 163 | |||
Liberal Democrat | Sally Lippiatt | 163 | |||
Majority | 1,799 | ||||
Turnout | |||||
Labour hold | Swing | ||||
Party | Candidate | Votes | % | ± | |
---|---|---|---|---|---|
Labour | Mick Brown | 1,780 | |||
UKIP | Andrew Garcarz | 747 | |||
Conservative | Clifton Welch | 747 | |||
Liberal Democrat | Ann Holtom | 318 | |||
Green | Giovanni Esposito | 86 | |||
TUSC | Marie O'Connor | 54 | |||
Majority | 1,033 | ||||
Turnout | |||||
Labour hold | Swing | ||||
Party | Candidate | Votes | % | ± | |
---|---|---|---|---|---|
Labour | Mariam Khan | 6,136 | 81.15 | ||
Liberal Democrat | Shamsur Rehman | 821 | 10.86 | ||
Conservative | Adrian Delaney | 350 | 4.63 | ||
Green | Jane McKears | 254 | 3.36 | ||
Majority | 5,315 | 70.29 | |||
Turnout | 7,561 | ||||
Labour hold | Swing | ||||
Party | Candidate | Votes | % | ± | |
---|---|---|---|---|---|
Labour | Julie Johnson | 2,125 | 40.71 | ||
Conservative | Eddie Freeman | 1,943 | 37.22 | ||
UKIP | Steven Brookes | 739 | 14.16 | ||
Liberal Democrat | Steve Haynes | 213 | 4.08 | ||
Green | Ben Kerr-Morgan | 200 | 3.83 | ||
Majority | 182 | 3.49 | |||
Turnout | 5,220 | ||||
Labour gain from Conservative | Swing | ||||
Liverpool City Council is the governing body for the city of Liverpool in Merseyside, England. It consists of 90 councillors, three for each of the city's 30 wards.
The 1999 Redditch Borough Council election took place on 6 May 1999 to elect members of Redditch Borough Council in the West Midlands region, England. One third of the council was up for election and the Labour party stayed in overall control of the council.
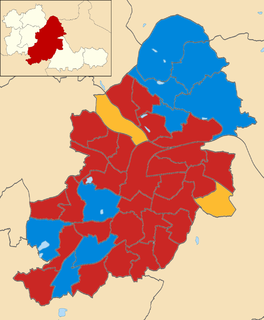
Elections to Birmingham City Council in England were held on 1 May 2008. One third of the council was up for election and the council stayed under no overall control as it had been since 2003.
The 1998 Wyre Forest District Council election took place on 7 May 1998 to elect members of Wyre Forest District Council in Worcestershire, England. One third of the council was up for election and the Labour party stayed in overall control of the council.
The 2008 Wyre Forest District Council election took place on 1 May 2008 to elect members of Wyre Forest District Council in Worcestershire, England. One third of the council was up for election and the Conservative party gained overall control of the council from no overall control.
The 1999 Stratford-on-Avon District Council election took place on 6 May 1999 to elect members of Stratford-on-Avon District Council in Warwickshire, England. One third of the council was up for election and the council stayed under no overall control.
The 2010 Birmingham City Council Election took place on 6 May 2010 to elect members of Birmingham City Council in the West Midlands, England. One third of the council was up for election, one seat in each of the city's 40 council wards, with the election taking place at the same time as the general election.
The 1999 Sandwell Metropolitan Borough Council election took place on 6 May 1999 to elect members of Sandwell Metropolitan Borough Council in the West Midlands, England. One third of the council was up for election and the Labour party stayed in overall control of the council.
The 2007 Sandwell Metropolitan Borough Council election took place on 3 May 2007 to elect members of Sandwell Metropolitan Borough Council in the West Midlands, England. One third of the council was up for election and the Labour party stayed in overall control of the council.
The 2012 Police and Crime Commissioner elections were polls held in most police areas in England and Wales on Thursday 15 November. The direct election of Police and Crime Commissioners (PCCs) was originally scheduled for May 2012 but was postponed in order to secure the passage of the Police Reform and Social Responsibility Act 2011 through the House of Lords. The Government considers the elected Commissioners to have a stronger mandate than the "unelected and invisible police authorities that they replace". The elections took place alongside by-elections for the House of Commons in Cardiff South and Penarth, Corby and Manchester Central, and a mayoral election in Bristol.
The 2011 Sandwell Metropolitan Borough Council election took place on 5 May 2011 to elect members of Sandwell Metropolitan Borough Council in the West Midlands, England. One third of the council was up for election and the Labour party stayed in overall control of the council.
The West Midlands Police and Crime Commissioner by-election, 2014 was a by-election for the position of Police and Crime Commissioner in the West Midlands Police region of the United Kingdom, held on 21 August 2014. It was triggered by the death of Bob Jones, the inaugural West Midlands Police and Crime Commissioner, who died on 1 July 2014.
The 2015 Birmingham City Council election took place on 7 May 2015 to elect members of Birmingham City Council in England. This was on the same day as other local elections, and also the 2015 UK General Election.
The 2011 Wyre Forest District Council election took place on 5 May 2011 to elect members of Wyre Forest District Council in Worcestershire, England. One third of the council was up for election and the Conservative party stayed in overall control of the council.
The 2016 United Kingdom local elections were held on Thursday 5 May 2016 were a series of local elections which were held in 124 local councils and also saw 4 mayoral elections in England which also coincided with elections to the Scottish Parliament, the Welsh Assembly, the Northern Ireland Assembly, the London Assembly, the London mayoral election and the England and Wales Police and crime commissioners. By-elections for the Westminster seats of Ogmore and Sheffield Brightside and Hillsborough were also held. These proved to be David Cameron's last local elections as leader of the Conservative Party and Prime Minister as he resigned two months later following the defeat of Remain in the referendum on Britain's continuing membership of the European Union which was held seven weeks later.
Elections of police and crime commissioners in England and Wales were held on 5 May 2016.
The 2016 Bristol City Council election took place on Thursday 5 May 2016, alongside nationwide local elections. Following a boundary review, the number of wards in the City was reduced to 34, with each electing one, two or three Councillors. The overall number of Councillors remained 70, with all seats are up for election at the same time. Elections would then be held every 4 years.
The 2016 Exeter City Council election took place on 5 May 2016, to elect members of Exeter City Council in England. Following boundary changes, the entire council was up for election, and all 13 wards were contested, each electing three councillors. The election was held concurrently with other local elections held in England on the 5 May.