Warrington Borough Council election, 2016

Last updated

Warrington Borough Council election, 2016

Flag of England.svg


  2015 5 May 2016 2018  

All 58 seats to Warrington Borough Council
30 seats needed for a majority

 First partySecond partyThird party
 
Party Labour Liberal Democrat Conservative
Seats won45112
Seat changeIncrease2.svg3Increase2.svg2Decrease2.svg3
Popular vote59,03124,95327,816
Percentage48.8020.6322.99

 Fourth party
 
Party TUSC
Seats won0
Seat changeDecrease2.svg1
Popular vote1,719
Percentage1.42

Council control before election

Labour Party (UK)

Council control after election

Labour Party (UK)

The 2016 Warrington Borough Council election took place on 5 May 2016 to elect members of Warrington Borough Council in England. [1] This was on the same day as other local elections.

Warrington Borough Council

Warrington Borough Council is the local authority of Warrington. It is a unitary authority, having the powers of a non-metropolitan county and district council combined. It provides a full range of local government services including Council Tax billing, libraries, social services, processing planning applications, waste collection and disposal, and it is a local education authority.

Contents

Following a boundary review, all Warrington Borough Council seats were up for election, for a term of four years. The number of seats rose from 57 to 58.

The Labour Party retained overall control of Warrington Borough Council after taking 45 of the 58 seats. [2]

Results Summary

Warrington Borough Council election, 2016
PartySeatsGainsLossesNet gain/lossSeats %Votes %Votes+/−
  Labour 45Increase2.svg 377.5948.8059,031
  Liberal Democrat 11Increase2.svg 218.9620.6324,953
  Conservative 2Decrease2.svg 33.4522.9927,816
  UKIP 0Steady2.svg03.023,652
  Independent 0Steady2.svg01.852,245
  TUSC 0Decrease2.svg 101.421,719
  Green 0Steady2.svg01.291,559

A total of 442 ballots were rejected, and the overall turnout was 32.87%.

Council Composition

Prior to the election the composition of the council was:

42951
LabourLib DemConT

After the election the composition of the council was:

45112
LabourLib DemCon

Lib Dem - Liberal Democrats
Con - Conservative Party
T - Trade Unionist and Socialist Coalition (TUSC)

Ward Results

Appleton

Appleton (3 Seats)
PartyCandidateVotes%±
Liberal Democrat Brian Axcell2,19122.91
Liberal Democrat Judith Carol Wheeler2,03421.26
Liberal Democrat Sharon Harris1,64017.15
Conservative Basil Mitchell1,07511.24
Conservative Barbara Price8919.32
Conservative Ian Houghton7317.64
Labour Nick Bent5565.81
Green David Edward Bilton4474.67
Majority5655.91
Turnout 9,56542
Liberal Democrat win

Bewsey and Whitecross

Bewsey and Whitecross (3 Seats)
PartyCandidateVotes%±
Labour Sarah Edith Hall1,14225.59
Labour Steve Wright1,08024.20
Labour Tom Jennings1,06123.78
Liberal Democrat Bob Timmis3197.15
Conservative Rowland Blackstock2355.27
Conservative Pat Smith2104.71
Liberal Democrat Irina Axcell1513.38
Liberal Democrat Judith Walker1353.03
TUSC Shelley Bennett1292.89
Majority74216.63
Turnout 4,46222
Labour win
Labour win
Labour win

Birchwood

Birchwood (3 Seats)
PartyCandidateVotes%±
Labour Russ Bowden1,71924.55
Labour Pauline Nelson1,57824.20
Labour Chris Fitzsimmons1,47521.06
Conservative Nigel Balding78211.17
Conservative Peter Linton6188.82
Independent Amy Elizabeth Linton5294.71
Liberal Democrat John Davies3024.31
Majority6939.89
Turnout 7,00335
Labour win
Labour win
Labour win

Burtonwood and Winwick

Burtonwood and Winwick (3 Seats
PartyCandidateVotes%±
Labour Cathy Mitchell1,08338.51
Labour Terry O'Neill1,06537.87
Conservative Robin Sloan39914.20
Liberal Democrat Timothy James Muttock2659.42
Majority66623.67
Turnout 2,81234
Labour win
Labour win

Chapelford and Old Hall

Chapelford and Old Hall (3 Seats)
PartyCandidateVotes%±
Labour Faisal Rashid1,48921.14
Labour Steve Parish1,16116.48
Labour Rebecca Knowles1,01114.35
Liberal Democrat Allan Keith Bird6989.91
Conservative Phil Hayward5938.42
Liberal Democrat David Leonard Knapp4636.57
Liberal Democrat Roy Alfred Smith3975.64
Conservative Anthony John Kerrigan3645.17
Conservative Anna Jane Sharkey3324.71
UKIP Ian Anthony Wilson3324.71
Green Mike Wass2042.90
Majority3134.44
Turnout 7,04431
Labour win
Labour win
Labour win

Culcheth, Glazebury and Croft

Culcheth, Glazebury and Croft (3 Seats)
PartyCandidateVotes%±
Labour Matt Smith1,78819.50
Labour Joan Grime1,60917.55
Labour Jan Davidson1,40115.28
Conservative Frank Richard Allen1,35914.82
Conservative Sue Bland1,31814.37
Conservative Valerie Margaret Allen1,26313.77
Liberal Democrat Eddie Sloane4324.71
Majority420.46
Turnout 9,17040
Labour win
Labour win
Labour win

Fairfield and Howley

Fairfield and Howley (3 Seats)
PartyCandidateVotes%±
Labour Jean Flaherty1,23424.31
Labour Tony Higgins1,00819.86
Labour Peter Carey99719.64
TUSC Kevin Bennett92118.14
Green Lyndsay McAteer3446.78
Conservative Simone Johnson3326.54
Liberal Democrat Ann Oldbury2404.73
Majority761.50
Turnout 5,07627
Labour win
Labour win
Labour win

Grappenhall

Grappenhall (2 Seats)
PartyCandidateVotes%±
Liberal Democrat Mike Biggin1,30634.45
Liberal Democrat Ryan Stephen Robert Bate1,11929.52
Conservative Olivia Reilly56514.90
Conservative Iona Gillis42111.11
Labour Andy Heaver38010.02
Majority55414.62
Turnout 3,79135
Liberal Democrat win

Great Sankey North and Whittle Hall

Great Sankey North and Whittle Hall (3 Seats)
PartyCandidateVotes%±
Labour Jan Hart1,32120.35
Labour Dan Price1,26519.49
Labour Tony Williams1,21718.75
Conservative Mike Foxall69810.75
Conservative Christine Booth66810.29
Conservative Arthur Booth66010.17
Green Stephanie Davies3325.11
Liberal Democrat Cliff Taylor3305.09
Majority5198.00
Turnout 6,49135
Labour win
Labour win
Labour win

Great Sankey South

Great Sankey South (3 Seats)
PartyCandidateVotes%±
Labour Amanda King1,43225.63
Labour Hitesh Patel1,19321.36
Labour Jean Carter1,15420.66
Conservative Sue Jenkin5469.77
Conservative Peter Elton4948.84
Conservative Sonia Wendy Boggan4037.21
Liberal Democrat Tim Harwood2274.06
TUSC Andrew Ford1382.47
Majority60810.89
Turnout 5,58728
Labour win
Labour win
Labour win

Latchford East

Latchford East (2 Seats)
PartyCandidateVotes%±
Labour Hans Josef Mundry92936.88
Labour Karen Mundry82232.63
Conservative Julian Craddock1927.62
Conservative Ken Scates1455.76
Liberal Democrat Tim Price1405.56
Liberal Democrat Rupert Budgen1234.88
Green John Kennedy Lappin853.38
TUSC Sue Hayes833.29
Majority63025.01
Turnout 2,51923
Labour win
Labour win

Latchford West

Latchford West (2 Seats)
PartyCandidateVotes%±
Labour Les Morgan1,06831.98
Labour Maureen McLaughlin99129.67
Conservative Michael Haworth3219.61
Conservative David Woodyatt3179.49
Liberal Democrat Ann Raymond2838.47
Liberal Democrat Celia Jordan2728.15
TUSC Dave Cundy882.63
Majority67020.06
Turnout 3,34032
Labour win
Labour win

Lymm North and Thelwall

Lymm North and Thelwall (3 Seats)
PartyCandidateVotes%±
Liberal Democrat Bob Barr2,02721.68
Liberal Democrat Ian George Marks1,94320.78
Liberal Democrat Wendy Johnson1,68518.02
Labour Chris Zastawny8959.57
Conservative Jonathan Michael Smith8579.16
Conservative Kevin Yates7357.86
Conservative Harish Chander Sharma6797.26
UKIP Derek Clark5305.67
Majority7908.45
Turnout 9,35141
Liberal Democrat win

Lymm South

Lymm South (2 Seats)
PartyCandidateVotes%±
Conservative Sheila Woodyatt92523.41
Conservative Kath Buckley87922.25
Liberal Democrat Ed Gough78019.74
Liberal Democrat Graham Farrington Gowland66816.91
Labour David John Cockayne46611.79
UKIP James Ashington2335.90
Majority992.51
Turnout 3,95144
Conservative win
Conservative win
Conservative win

Orford

Orford (3 Seats)
PartyCandidateVotes%±
Labour Mike Hannon1,49326.13
Labour Kerri Louise Morris1,37424.05
Labour Morgan Tarr1,23421.60
UKIP Ian Andrew Richards4207.35
UKIP Dion Eric Challinor3926.86
UKIP Sid Simmons3926.86
Conservative Jan Woning1543.70
Liberal Democrat Pam Marks1372.40
Independent Clive Lawrinson1172.05
Majority81414.25
Turnout 5,71325
Labour win
Labour win
Labour win

Penketh and Cuerdley

Penketh and Cuerdley (3 Seats)
PartyCandidateVotes%±
Labour David Keane1,62219.53
Labour Linda Susan Dirir1,51118.19
Labour Allin Dirir1,48617.89
Conservative Sam Baxter1,31715.85
Conservative Kevin Morton1,08713.08
Conservative Matt Jones1,03012.40
Liberal Democrat Denis Patrick McAllister2543.06
Majority1692.04
Turnout 8,30737
Labour win
Labour win
Labour win

Poplars and Hulme

Poplars and Hulme (3 Seats)
PartyCandidateVotes%±
Labour John Kerr-Brown1,19623.42
Labour Hilary Cooksey1,10321.60
Labour Brian Maher1,09021.35
UKIP Mike Byrne4639.07
UKIP Trevor Nicholls4508.81
UKIP Mal Lingley4408.62
Conservative Francine Leslie2224.35
Liberal Democrat Pam Todd1422.78
Majority62712.28
Turnout 5,10623
Labour win
Labour win
Labour win

Poulton North

Poulton North (3 Seats)
PartyCandidateVotes%±
Labour Diana Bennett1,41325.84
Labour Graham Friend1,41125.80
Labour Russell Purnell1,22222.35
Liberal Democrat Chris Oliver72613.28
Conservative Philip Eastty69612.73
Majority4969.07
Turnout 5,46832
Labour win
Labour win
Labour win

Poulton South

Poulton South (2 Seats)
PartyCandidateVotes%±
Labour Colin Froggatt88236.58
Labour Maureen Creaghan67828.12
TUSC Bob Taylor36014.93
Conservative Emma Sloan32413.44
Liberal Democrat Dave Hockenhull1676.93
Majority31813.19
Turnout 2,41130
Labour win
Labour win

Rixton and Woolston

Rixton and Woolston (3 Seats)
PartyCandidateVotes%±
Labour Tony McCarthy1,31419.60
Labour Andrew Hill1,21418.11
Labour Pat Wright97914.60
Independent Bill Brinksman88213.15
Independent Paul Francis Bretherton71710.69
Conservative Mark Chapman5608.35
Conservative Howard Klein4606.86
Conservative Isaac Tweedale4116.13
Liberal Democrat Paul Wenlock1682.51
Majority971.45
Turnout 6,70534
Labour win
Labour win
Labour win

Stockton Heath

Stockton Heath (2 Seats)
PartyCandidateVotes%±
Liberal Democrat Peter Walker1,08924.52
Liberal Democrat Graham Welborn81318.31
Conservative Stephen Howard Taylor67515.20
Labour Laurence Murphy61413.83
Conservative Jonathan Matthew Levy58113.08
Labour Sandra Eaves52211.75
Green Harry Gibbins1473.31
Majority1383.11
Turnout 4,44141
Liberal Democrat win

Westbrook

Westbrook (2 Seats)
PartyCandidateVotes%±
Liberal Democrat Stefan Krizanac82731.07
Labour Judith Marie Guthrie60622.76
Labour John Joyce47717.92
Liberal Democrat Jeff Butler46017.28
Conservative Alex Leslie29210.97
Majority1294.84
Turnout 2,66232
Liberal Democrat win
Labour win

Related Research Articles

2006 Bolton Metropolitan Borough Council election

Elections to Bolton Metropolitan Borough Council were held on 4 May 2006. One third of the council was up for election and the council stayed under no overall control, with the Labour Party overtaking the Liberal Democrats as the largest party.

Warrington is a unitary authority in Cheshire, England. Until 1 April 1998 it was a non-metropolitan district.

The 2006 Halton Borough Council election took place on 4 May 2006 to elect members of Halton Unitary Council in Cheshire, England. One third of the council was up for election and the Labour party stayed in overall control of the council.

The 2007 Halton Borough Council election took place on 3 May 2007 to elect members of Halton Unitary Council in Cheshire, England. One third of the council was up for election and the Labour party stayed in overall control of the council.

1979 United Kingdom local elections

Local elections were held in the United Kingdom on 3 May 1979. The results provided some source of comfort to the Labour Party (UK), who recovered some lost ground from local election reversals in previous years, despite losing the general election to the Conservative Party on the same day.

2008 Maidstone Borough Council election

The 2008 Maidstone Borough Council election took place on 1 May 2008 to elect members of Maidstone Borough Council in Kent, England. One third of the council was up for election and the Conservative party gained overall control of the council from no overall control.

2011 Sandwell Metropolitan Borough Council election

The 2011 Sandwell Metropolitan Borough Council election took place on 5 May 2011 to elect members of Sandwell Metropolitan Borough Council in the West Midlands, England. One third of the council was up for election and the Labour party stayed in overall control of the council.

1996 Bolton Metropolitan Borough Council election

The 1996 Bolton Metropolitan Borough Council election took place on 2 May 1996 to elect members of Bolton Metropolitan Borough Council in Greater Manchester, England. One third of the council was up for election and the Labour party kept overall control of the council

1982 Bolton Metropolitan Borough Council election

The 1982 Bolton Metropolitan Borough Council election took place on 6 May 1982 to elect members of Bolton Metropolitan Borough Council in Greater Manchester, England. One third of the council was up for election and the Labour party kept overall control of the council

1983 Bolton Metropolitan Borough Council election

The 1983 Bolton Metropolitan Borough Council election took place on 5 May 1983 to elect members of Bolton Metropolitan Borough Council in Greater Manchester, England. One third of the council was up for election and the Labour party kept overall control of the council

1984 Bolton Metropolitan Borough Council election

The 1984 Bolton Metropolitan Borough Council election took place on 3 May 1984 to elect members of Bolton Metropolitan Borough Council in Greater Manchester, England. One third of the council was up for election and the Labour party kept overall control of the council

1986 Bolton Metropolitan Borough Council election

The 1986 Bolton Metropolitan Borough Council election took place on 8 May 1986 to elect members of Bolton Metropolitan Borough Council in Greater Manchester, England. One third of the council was up for election and the Labour party kept overall control of the council

1987 Bolton Metropolitan Borough Council election

The 1987 Bolton Metropolitan Borough Council election took place on 7 May 1987 to elect members of Bolton Metropolitan Borough Council in Greater Manchester, England. One third of the council was up for election and the Labour party kept overall control of the council.

1988 Bolton Metropolitan Borough Council election

The 1988 Bolton Metropolitan Borough Council election took place on 5 May 1988 to elect members of Bolton Metropolitan Borough Council in Greater Manchester, England. One third of the council was up for election and the Labour party kept overall control of the council.

1990 Bolton Metropolitan Borough Council election

The 1990 Bolton Metropolitan Borough Council election took place on 4 May 1990 to elect members of Bolton Metropolitan Borough Council in Greater Manchester, England. One third of the council was up for election and the Labour party kept overall control of the council

1991 Bolton Metropolitan Borough Council election

The 1991 Bolton Metropolitan Borough Council election took place on 6 May 1991 to elect members of Bolton Metropolitan Borough Council in Greater Manchester, England. One third of the council was up for election and the Labour party kept overall control of the council.

1992 Bolton Metropolitan Borough Council election

The 1992 Bolton Metropolitan Borough Council election took place on 7 May 1992 to elect members of Bolton Metropolitan Borough Council in Greater Manchester, England. One third of the council was up for election and the Labour party kept overall control of the council.

1994 Bolton Metropolitan Borough Council election

The 1994 Bolton Metropolitan Borough Council election took place on 5 May 1994 to elect members of Bolton Metropolitan Borough Council in Greater Manchester, England. One third of the council was up for election and the Labour party kept overall control of the council.

2014 Havant Borough Council election

The 2014 Havant Borough Council election took place on 22 May 2014 to elect members of Havant Borough Council in Hampshire, England. One third of the council was up for election and the Conservative party stayed in overall control of the council.

2015 Blackpool Borough Council election

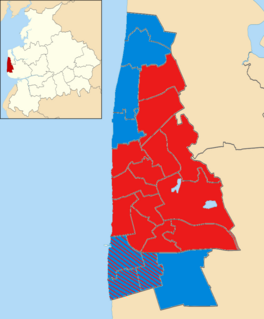
The 2015 Blackpool Borough Council election took place on 7 May 2015 to elect members of Blackpool Borough Council in England. All 21 wards of 2 seats each on the council were contested with newly elected members next due to serve a four-year term and next contest their seats in 2019. This election took place on the same day as other local elections as well as the 2015 UK General Election.

References

  1. "Guide to May 2016 elections in Scotland, Wales, England and Northern Ireland". BBC News. Retrieved 21 April 2016.
  2. Warrington Borough Council. "Borough council election results, May 2016" . Retrieved 14 May 2016.