Sunderland City Council election, 2016

Last updated

Sunderland City Council election, 2016

Flag of England.svg


  2015 5 May 2016 2018  

One third of 75 seats on Sunderland City Council
38 seats needed for a majority

 First partySecond partyThird party
 
Party Labour Conservative Liberal Democrat
Seats before6660
Seats won2221
Seats after6761
Seat changeIncrease2.svg1Steady2.svgIncrease2.svg1

 Fourth party
 
Party Independent
Seats before3
Seats won0
Seats after1
Seat changeDecrease2.svg2

Sunderland UK local election 2016 map.png

Map of the 2016 Sunderland City Council election results. Labour in red, Conservatives in blue and Liberal Democrats in yellow.

Majority party before election

Labour

Majority party after election

Labour

The 2016 Sunderland City Council election took place on 5 May 2016 to elect one-third of the members of Sunderland City Council in England. [1] This was on the same day as other local elections held across the United Kingdom.

Sunderland City Council Local government body in England

Sunderland City Council is the local authority of the City of Sunderland in Tyne and Wear, England. It is a metropolitan district council, one of five in Tyne and Wear and one of 36 in the metropolitan counties of England, and provides the majority of local government services in Sunderland.

Contents

Election results

The election saw Labour gain two seats, taking the Houghton and Copt Hill wards after incumbent Independent councillors chose not to stand for re-election. The Conservatives held the seats they were defending in Fulwell and St Michael's. The Liberal Democrats took a seat from Labour in Millfield. [2]

The Labour Party is a centre-left political party in the United Kingdom which has been described as an alliance of social democrats, democratic socialists and trade unionists. The party's platform emphasises greater state intervention, social justice and strengthening workers' rights. Labour is a full member of the Party of European Socialists and Progressive Alliance, and holds observer status in the Socialist International. As of 2017, the party was considered the "largest party in Western Europe" in terms of party membership, with more than half a million members.

An independent or nonpartisan politician is an individual politician not affiliated with any political party. There are numerous reasons why someone may stand for office as an independent.

Conservative Party (UK) Political party in the United Kingdom

The Conservative Party, officially the Conservative and Unionist Party, is a centre-right political party in the United Kingdom. Presently led by Theresa May, it has been the governing party since 2010. It presently has 314 Members of Parliament in the House of Commons, 249 members of the House of Lords, and 18 members of the European Parliament. It also has 31 Members of the Scottish Parliament, 12 members of the Welsh Assembly, eight members of the London Assembly and 9,008 local councillors. One of the major parties of UK politics, it has formed the government on 45 occasions, more than any other party.

Sunderland Local Election Result 2016 [3]
PartySeatsGainsLossesNet gain/lossSeats %Votes %Votes+/−
  Labour 2221Increase2.svg1885435,905Increase2.svg4.4
  Conservative 200Steady2.svg2822.114,695Decrease2.svg1.3
  UKIP 000Steady2.svg0011.37,522Decrease2.svg8.2
  Liberal Democrat 110Increase2.svg1474,627Increase2.svg3.9
  Green 000Steady2.svg0042,640Increase2.svg0.5
  Independent 000Steady2.svg001.1703Decrease2.svg2
  North East Party 000Steady2.svg000.5324Increase2.svg0.4
  TUSC 000Steady2.svg000.2116Decrease2.svg0.2

This resulted in the following composition of the council:

PartyPrevious CouncilNew Council
Labour6667
Conservatives66
Liberal Democrats01
Independent11
Total7575
Working majority 59  58 

Ward by ward results

Asterisk denotes incumbent councillor.

Barnes ward

Barnes [4]
PartyCandidateVotes%±
Labour Rebecca Atkinson* 1,502 46.5 Decrease2.svg9
Conservative Peter O'Connor1,17336.3Decrease2.svg4.1
Independent Alan Rinaldi1996.2Increase2.svg6.2
Liberal Democrat Bailey Baker1795.5Increase2.svg1.4
Green Caroline Robinson1574.9Increase2.svg4.9
Rejected ballots230.7
Majority32910.2Decrease2.svg4.9
Turnout 3,23338.4Decrease2.svg2.4
Registered electors 8,417
Labour hold Swing Decrease2.svg7.6

Castle ward

Castle [5]
PartyCandidateVotes%±
Labour Denny Wilson* 1,665 77.3 Decrease2.svg8.8
Conservative Grant Shearer26112.1Increase2.svg2.7
Liberal Democrat Jack Stoker1878.7Increase2.svg4.2
Rejected ballots411.9
Majority1,40465.2Decrease2.svg11.6
Turnout 2,15426.0Decrease2.svg0.7
Registered electors 8,284
Labour hold Swing Decrease2.svg5.8

Copt Hill ward

Copt Hill [6]
PartyCandidateVotes%±
Labour Kevin Johnston 1,577 53.2 Increase2.svg12.1
UKIP Reginald Coulson84728.6Increase2.svg28.6
Conservative Pat Francis33911.4Increase2.svg11.4
Green Daniel Olaman1816.1Increase2.svg6.1
Rejected ballots180.6
Majority73024.6Increase2.svg10.5
Turnout 2,96234.1Increase2.svg0.5
Registered electors 8,676
Labour gain from Independent Swing Increase2.svg33.7†

†The incumbent Independent councillor Derrick Smith retired at this election, and none of UKIP, the Conservatives, or the Greens had stood when the seat was last contested. The swing shown is to the Labour candidate from the Independent.

Doxford ward

Doxford [7]
PartyCandidateVotes%±
Labour Christine Marshall* 1,320 49.6 Decrease2.svg17.5
Conservative Keith O'Brien55520.1Decrease2.svg1.2
UKIP Vincent Costello52819.9Increase2.svg19.9
Green Rachel Featherstone1716.4Increase2.svg2.5
Liberal Democrat Geoff Pryke662.5Decrease2.svg0.2
Rejected ballots190.7
Majority76529.4Decrease2.svg16.5
Turnout 2,65935.5Increase2.svg0.4
Registered electors 7,496
Labour hold Swing Decrease2.svg18.7

Fulwell ward

Fulwell [8]
PartyCandidateVotes%±
Conservative Robert Francis* 1,728 45.5 Decrease2.svg2.6
Labour Ken Richardson1,27933.7Decrease2.svg11.7
UKIP Christopher Marshall48012.6Increase2.svg12.6
Liberal Democrat Diana Talbott Matthew1614.2Decrease2.svg2.3
Green Peter Murray1363.6Increase2.svg3.6
Rejected ballots160.4
Majority44911.8Increase2.svg9
Turnout 3,80042.6Increase2.svg2.6
Registered electors 8,906
Conservative hold Swing Decrease2.svg7.6

Hendon ward

Hendon [9]
PartyCandidateVotes%±
Labour Co-op Michael Mordey* 1,376 64.2 Decrease2.svg2.4
Conservative Syed Ali42920.1Increase2.svg4.3
Green Helmut Izaks1567.3Increase2.svg0.3
Liberal Democrat Callum James Littlemore1557.2Increase2.svg7.2
Rejected ballots261.2
Majority94744.2Decrease2.svg6.6
Turnout 2,14227.9Increase2.svg2.3
Registered electors 7,681
Labour hold Swing Decrease2.svg3.4

Hetton ward

Hetton [10]
PartyCandidateVotes%±
Labour Jim Blackburn* 1,531 51.4 Decrease2.svg0.4
UKIP John Defty1,03734.8Decrease2.svg8.5
Conservative Douglas Middlemiss1595.3Increase2.svg5.3
Independent David Geddis1354.5Increase2.svg4.5
Liberal Democrat Phillip Dowell923.1Decrease2.svg1.8
Rejected ballots240.8
Majority49416.6Increase2.svg8.2
Turnout 2,97834.6Decrease2.svg0.5
Registered electors 8,618
Labour hold Swing Decrease2.svg2.9†

†Swing away from Labour to the Conservatives, who had stood aside last time this seat was contested.

Houghton ward

Houghton [11]
PartyCandidateVotes%±
Labour Alex Scullion 1,607 56.2 Increase2.svg10.4
UKIP Anthony Holt64122.4Increase2.svg22.4
Independent Mick Watson36912.9Increase2.svg12.9
Conservative George Brown2298.0Increase2.svg8
Rejected ballots140.5
Majority96633.8Increase2.svg27.6
Turnout 2,86031.7Decrease2.svg4.1
Registered electors 9,012
Labour hold Swing Increase2.svg31.2†

†The incumbent Independent councillor Sheila Ellis retired at this election, and neither UKIP, the Conservatives, or Mick Watson had stood when the seat was last contested. The swing shown is to the Labour candidate from the previous Independent.

Millfield ward

Millfield [12]
PartyCandidateVotes%±
Liberal Democrat Niall Hodson 1,588 59.7 Increase2.svg21.5
Labour Bob Price*83831.5Decrease2.svg14
Conservative Gwennyth Gibson1435.4Decrease2.svg1.7
Green Lucky Pemu712.7Decrease2.svg1.3
Rejected ballots190.7
Majority75028.2Increase2.svg20.9
Turnout 2,65938.4Increase2.svg9.6
Registered electors 6,951
Liberal Democrat gain from Labour Swing Increase2.svg17.8

Pallion ward

Pallion [13]
PartyCandidateVotes%±
Labour Amy Wilson* 1,046 50.2 Decrease2.svg16.5
UKIP Ian Pallace59628.6Increase2.svg28.6
Conservative Philip Young26112.5Decrease2.svg3.3
Liberal Democrat Conor Sutton914.4Steady2.svg0
Green Alan Robinson713.4Decrease2.svg9.8
Rejected ballots190.9
Majority45021.6Decrease2.svg29.3
Turnout 2,08429Decrease2.svg1.4
Registered electors 7,175
Labour hold Swing Decrease2.svg22.6

Redhill ward

Redhill [14]
PartyCandidateVotes%±
Labour Co-op Ronny Davison* 1,409 69.1 Decrease2.svg9.5
North East Party Heather Fagan32415.9Increase2.svg15.9
Conservative Shaun Cudworth16312.5Increase2.svg7.3
Green Edward Robinson673.3Increase2.svg3.3
Liberal Democrat Steve Thomas592.9Increase2.svg2.9
Rejected ballots180.1
Majority1,08553.2Decrease2.svg9.3
Turnout 2,04025.6Decrease2.svg2.4
Labour hold Swing Decrease2.svg12.7

Ryhope ward

Ryhope [15]
PartyCandidateVotes%±
Labour Paula Hunt 1,572 64.7 Decrease2.svg8.1
Conservative Andrei Lucaci46219Decrease2.svg8.2
Green Emma Robson24710.2Increase2.svg10.2
Liberal Democrat Anthony Usher1215Increase2.svg5
Rejected ballots261.1
Majority1,11045.7Increase2.svg0.1
Turnout 2,42830.7Decrease2.svg1.2
Labour hold Swing Decrease2.svg9.2

Sandhill ward

Sandhill [16]
PartyCandidateVotes%±
Labour Debra Waller* 1,229 50.6 Decrease2.svg39.8
UKIP Bryan Foster57925.8Increase2.svg25.8
Conservative Christine Reed27712.3Decrease2.svg10.5
Liberal Democrat Susan Wilson904.0Decrease2.svg12.6
Green Jonathan Hume592.6Increase2.svg2.6
Rejected ballots140.6
Majority65028.9Decrease2.svg18.8
Turnout 2,24828.6Increase2.svg4.8
Labour hold Swing Decrease2.svg32.8

Shiney Row ward

Shiney Row [17]
PartyCandidateVotes%±
Labour Anne Lawson* 1733 55.7 Decrease2.svg17.9
UKIP Richard Elvin74023.8Increase2.svg23.8
Conservative Sally Oliver45614.6Decrease2.svg5.8
Liberal Democrat Sean Terry882.8Decrease2.svg3.2
Green Polly Robinson742.4Increase2.svg2.4
Rejected ballots200.6
Majority99331.9Decrease2.svg21.2
Turnout 311132.4Increase2.svg1.6
Labour hold Swing Decrease2.svg20.9

Silksworth ward

Silksworth [18]
PartyCandidateVotes%±
Labour Patricia Smith* 1405 51.1 Decrease2.svg16.1
UKIP Alan Davies64923.6Increase2.svg10.7
Conservative Bryan Reynolds45816.6Increase2.svg1.1
Green Chris Crozier1465.3Increase2.svg0.9
Liberal Democrat Paul Edgeworth833Increase2.svg3
Rejected ballots100.4
Majority75627.5Decrease2.svg24.3
Turnout 2,75134.2Decrease2.svg0.1
Labour hold Swing Decrease2.svg13.4

Southwick ward

Southwick [19]
PartyCandidateVotes%±
Labour Kelly Chequer 1430 60.5 Decrease2.svg5.9
UKIP Sandy Taylor42618Increase2.svg4.4
Conservative Neville Chamberlin35214.9Decrease2.svg1.6
Liberal Democrat Stephen O'Brien803.4Steady2.svg0
Green David Lawson612.6Increase2.svg2.6
Rejected ballots160.7
Majority100442.5Decrease2.svg7.4
Turnout 2,36529.8Increase2.svg1.2
Labour hold Swing Decrease2.svg5.2

St Anne's ward

St Anne's [20]
PartyCandidateVotes%±
Labour Susan Watson* 1371 70.2 Decrease2.svg1.9
Conservative Tony Morrisey54828.1Increase2.svg14.1
Rejected ballots331.7
Majority82342.5Decrease2.svg15.5
Turnout 195224.3Decrease2.svg3.7
Labour hold Swing Decrease2.svg8

St Chad's ward

St Chad's [21]
PartyCandidateVotes%±
Labour Darryl Dixon* 1188 41.2 Decrease2.svg14.1
Conservative Dominic McDonough97834.5Decrease2.svg6.9
UKIP Joshua Green44815.8Increase2.svg15.8
Liberal Democrat Margaret Crosby1324.7Increase2.svg1.4
Green Richard Bradley682.4Increase2.svg1.4
Rejected ballots190.7
Majority2106.7Decrease2.svg7.3
Turnout 283337.9Decrease2.svg2.1
Labour hold Swing Decrease2.svg15

St Michael's ward

St Michael's [22]
PartyCandidateVotes%±
Conservative Robert Oliver 1675 52.1 Increase2.svg0.8
Labour Co-op Zaf Iqbal99631.4Decrease2.svg4.7
Green John Appleton2427.6Decrease2.svg0.6
Liberal Democrat Andrew Wood2377.5Increase2.svg3.1
Rejected ballots190.6
Majority67920.7Increase2.svg5.5
Turnout 316938.5Increase2.svg3.1
Conservative hold Swing Increase2.svg2.8

St Peter's ward

St Peter's [23]
PartyCandidateVotes%±
Labour Julia Jackson* 1405 45.4 Decrease2.svg7.1
Conservative Geoffrey Scott121539.3Decrease2.svg0.9
Liberal Democrat John Lennox2608.4Increase2.svg1
Green Michal Chantkowski1846.0Increase2.svg6
Rejected ballots331.0
Majority1906.1Decrease2.svg6.2
Turnout 283337.9Increase2.svg2.7
Labour hold Swing Decrease2.svg6.6

Washington Central ward

Washington Central [24]
PartyCandidateVotes%±
Labour Dianne Snowdon* 1994 69.4 Decrease2.svg3.7
Conservative Grace Hanson-Eden50317.5Increase2.svg6.7
Liberal Democrat Anne Griffin34512Increase2.svg6.1
Rejected ballots311.1
Majority149151.9Increase2.svg3.8
Turnout 287333.6Decrease2.svg0.3
Labour hold Swing Decrease2.svg5.2

Washington East ward

Washington East [25]
PartyCandidateVotes%±
Labour Co-op David Snowdon* 1508 52.1 Decrease2.svg4.4
Conservative Hilary Johnson84229.6Increase2.svg5.5
Liberal Democrat Irene Bannister1836.4Increase2.svg2.5
Green Anthony Murphy1806.3Increase2.svg1.2
TUSC Wilf Laws1164.1Increase2.svg4.1
Rejected ballots180.6
Majority66622.5Decrease2.svg9.9
Turnout 284732.4Decrease2.svg2.2
Labour hold Swing Decrease2.svg5

Washington North ward

Washington North [26]
PartyCandidateVotes%±
Labour John Kelly* 1709 71.2 Decrease2.svg8.9
Conservative Andrew Gray37315.7Increase2.svg2
Green June Bradley26611.2Increase2.svg11.2
Rejected ballots261.1
Majority133655.5Decrease2.svg10.9
Turnout 237429.5Increase2.svg0.5
Labour hold Swing Decrease2.svg5.5

Washington South ward

Washington South [27]
PartyCandidateVotes%±
Labour Louise Farthing* 1523 59.1 Decrease2.svg6
Conservative Martin Talbot73228.4Increase2.svg1
Liberal Democrat David Griffin29411.4Increase2.svg3.8
Rejected ballots271.0
Majority79130.7Decrease2.svg7.1
Turnout 257633.2Decrease2.svg0.7
Labour hold Swing Decrease2.svg3.5

Washington West ward

Washington West [28]
PartyCandidateVotes%±
Labour Bernie Scaplehorn* 1692 58.8 Decrease2.svg18.7
UKIP Lynn O'Neil55119.1Increase2.svg19.1
Conservative Olwyn Bird38413.3Decrease2.svg0.3
Liberal Democrat Jo Thomas1364.7Decrease2.svg4.2
Green Benjamin Wells1033.6Increase2.svg3.6
Rejected ballots130.5
Majority39.71141Decrease2.svg24.2
Turnout 287932.5Increase2.svg1
Labour hold Swing Decrease2.svg18.9

Related Research Articles

Thanet District Council in Kent, England is elected every four years.

2006 Sunderland City Council election

The 2006 Sunderland Council election took place on 4 May 2006 to elect members of Sunderland City Council in Tyne and Wear, England. One third of the Council was up for election and the Labour party stayed in overall control.

2007 Sunderland City Council election

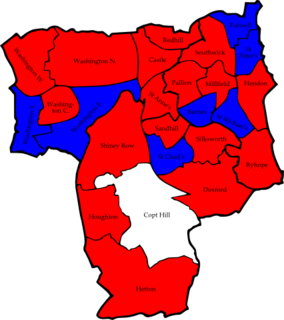
The 2007 Sunderland Council election took place on 3 May 2007 to elect members of Sunderland Metropolitan Borough Council in Tyne and Wear, England. One third of the council was up for election and the Labour party stayed in overall control of the council.

2008 Sunderland City Council election

The 2008 Sunderland Council election took place on 1 May 2008 to elect members of Sunderland Metropolitan Borough Council in Tyne and Wear, England. One third of the council was up for election and the Labour party stayed in overall control of the council.

2010 Sunderland City Council election

The 2010 Sunderland Council election took place on 6 May 2010 to elect members of Sunderland Metropolitan Borough Council in Tyne and Wear, England. One third of the council was up for election and the Labour party stayed in overall control of the council. The election took place on the same day as the 2010 General Election.

2011 Sunderland City Council election

The 2011 Sunderland Council election took place on 5 May 2011 to elect members of Sunderland Metropolitan Borough Council in Tyne and Wear, England. One third of the council was up for election and the Labour party stayed in overall control of the council.

2012 Sefton Metropolitan Borough Council election

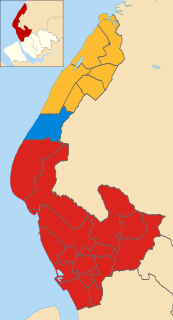
The 2012 Sefton Metropolitan Borough Council election took on 3 May 2012 to elect members of Sefton Metropolitan Borough Council in England, as part of the United Kingdom local elections, 2012. 22 seats, representing one third of the total Council membership, were up for election in single-member wards. Ten - nearly half - of the members elected were newcomers to the Council; five of these defeated sitting Councillors seeking re-election, whilst in the other five wards, the incumbent retired. Two incumbents stood under different labels to those they were elected under in 2008; both were defeated in their wards.

2012 Sunderland City Council election

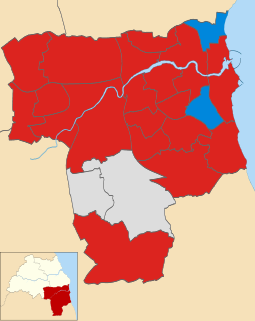
The 2012 Sunderland Council election took place on 3 May 2012 to elect members of Sunderland City Council in England. It was held on the same day as other United Kingdom local elections, 2012.

2013 Norfolk County Council election

The Norfolk County Council election took place across Norfolk on 2 May 2013, coinciding with local elections for all county councils in England. The results were announced the following day, Friday 3 May 2013. The result brought to an end 12 years of Conservative administration, who finished three seats short of a majority after losing 20 seats, leaving the Council in no overall control (NOC). UKIP and the Labour Party both made gains of 14 and 11 seats respectively. The Liberal Democrats and the Green Party both lost three seats each, whilst an independent won a single seat in North Norfolk.

2014 Sunderland City Council election

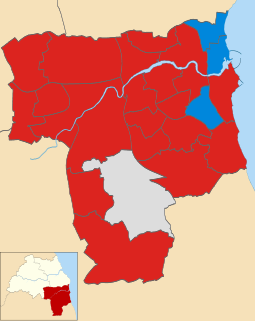
The 2014 Sunderland City Council Election took place on 22 May 2014 to elect members of Sunderland Metropolitan Borough Council in Tyne and Wear, England, as part of the wider United Kingdom local elections, 2014. A third of the council were up for election, the Labour Party stayed in overall control of the council.

2014 Calderdale Metropolitan Borough Council election

The 2014 Calderdale Metropolitan Borough Council election took place on 22 May 2014 to elect members of Calderdale Metropolitan Borough Council in England. This was on the same day as local elections across the United Kingdom and a European election. One councillor was elected in each of the 17 wards for a four-year term. There are three councillors representing each ward elected on a staggered basis so one third of the councillor seats were up for re-election. The seats had previously been contested in 2010 which was held in conjunction with a general election. The turnout was significantly lower in 2014 than in 2010 which is not unusual when comparing local elections that coincide with general elections to ones that do not. Prior to the election Labour was the largest party in the council with 21 out of 51 seats, 5 seats short of an overall majority. After the election there was no overall control of the council. Labour had 25 seats, only one short of a majority and so Labour continued to operate a minority administration.

2015 City of Bradford Metropolitan District Council election

The 2015 City of Bradford Metropolitan District Council election took place on 7 May 2015. This was on the same day as other local elections and a general election. One councillor was elected in each ward for a four-year term so the councillors elected in 2015 last stood for election in 2011. Each ward is represented by three councillors, the election of which is staggered, so only one third of the councillors were elected in this election. Labour retained overall control of the council.

2015 Cheshire West and Chester Council election

The 2015 Cheshire West and Chester Council election took place on 7 May 2015, electing members of Cheshire West and Chester Council in England. This was on the same day as other local elections across the country as well as the general election.

Elections for Boston Borough Council, which governs as a second-tier authority the Borough of Boston were held on Thursday 7 May 2015. Following Boundary Commission changes between this election and the previous in 2011 to the wards, 30 councillors were elected to serve 15 wards. The election was held on the same day as other local elections.

2016 Calderdale Metropolitan Borough Council election

The 2016 Calderdale Metropolitan Borough Council election took place on 5 May 2016 to elect members of Calderdale Metropolitan Borough Council in England. This was on the same day as other local elections. One councillor was elected in each ward for a four-year term so the councillors elected in 2016 last stood for election in 2012. Each ward is represented by three councillors, the election of which is staggered, so only one third of the councillors was elected in this election. Before the election there was no overall control with a minority Labour administration. After the election there was still no overall control so the minority Labour administration continued.

2018 Leeds City Council election

The 2018 Leeds City Council election took place on 3 May 2018 to elect members of Leeds City Council in England. They were held on the same day as other local elections across England and the rest of the UK.

2018 Calderdale Metropolitan Borough Council election

The 2018 Calderdale Metropolitan Borough Council election took place on 3 May 2018 to elect members of Calderdale Metropolitan Borough Council in England. This was on the same day as other local elections. One councillor was elected in each ward for a four-year term so the councillors elected in 2018 last stood for election in 2014. Each ward is represented by three councillors, the election of which is staggered, so only one third of the councillors were elected in this election. Before the election there was no overall control with a minority Labour administration. Following the election Labour, having gained one councillor, was still two councillors away from a majority so it remained no overall control.

2018 City of Bradford Metropolitan District Council election

The 2018 City of Bradford Metropolitan District Council took place on 3 May 2018 to elect members of Bradford District Council in England. This was on the same day as other local elections. One councillor was elected in each ward for a four-year term so the councillors elected in 2018 last stood for election in 2014. Each ward is represented by three councillors, the election of which is staggered, so only one third of the councillors were elected in this election. Before the election there was a Labour majority and afterwards Labour had increased their majority.

2018 Sunderland City Council election

The 2018 Sunderland City Council election took place on 3 May 2018 to elect members of Sunderland City Council in England. The election took place on the same day as other local elections.

References

  1. "Guide to May 2016 elections in Scotland, Wales, England and Northern Ireland". BBC News. Retrieved 21 April 2016.
  2. Silfverskiold, Petra (6 May 2016). "Labour dominate Sunderland 2016 elections – with a couple of surprises". Sunderland Echo. Retrieved 20 Feb 2018.
  3. "Local Elections Results 2016" (PDF). Sunderland City Council. Retrieved 2018-02-20.
  4. "Declaration of Results - Barnes Ward" (PDF). Sunderland City Council. Sunderland City Council. Retrieved 30 May 2017.
  5. "Declaration of Results - Castle Ward" (PDF). Sunderland City Council. Sunderland City Council. Retrieved 30 May 2017.
  6. "Declaration of Results - Copt Hill Ward" (PDF). Sunderland City Council. Sunderland City Council. Retrieved 30 May 2017.
  7. "Declaration of Results Doxford Ward" (PDF). Sunderland City Council. Sunderland City Council. Retrieved 30 May 2017.
  8. "Declaration of Results - Fullwell Ward" (PDF). Sunderland City Council. Sunderland City Council. Retrieved 30 May 2017.
  9. "Declaration of Results - Hendon Ward" (PDF). Sunderland City Council. Sunderland City Council. Retrieved 30 May 2017.
  10. "Declaration of Results - Hetton Ward" (PDF). Sunderland City Council. Sunderland City Council. Retrieved 30 May 2017.
  11. "Declaration of Results - Houghton Ward" (PDF). Sunderland City Council. Sunderland City Council. Retrieved 30 May 2017.
  12. "Declaration of Results - Millfield Ward" (PDF). Sunderland City Council. Sunderland City Council. Retrieved 30 May 2017.
  13. "Declaration of Results - Pallion Ward" (PDF). Sunderland City Council. Sunderland City Council. Retrieved 30 May 2017.
  14. "Declaration of Results - Redhill Ward". Sunderland City Council. Retrieved 30 May 2017.
  15. "Declaration of Results - Ryhope Ward" (PDF). Sunderland City Council. Retrieved 30 May 2017.
  16. "Declaration of Results - Sandhill Ward" (PDF). Sunderland City Council. Retrieved 30 May 2017.
  17. "Declaration of Results - Shiney Row Ward" (PDF). Sunderland City Council. Retrieved 30 May 2017.
  18. "Declaration of Results - Silksworth Ward" (PDF). Sunderland City Council. Retrieved 30 May 2017.
  19. "Declaration of Results - Southwick Ward" (PDF). Sunderland City Council. Retrieved 30 May 2017.
  20. "Declaration of Results - St Anne's Ward" (PDF). Sunderland City Council. Retrieved 30 May 2017.
  21. "Declaration of Results - St Chad's Ward" (PDF). Sunderland City Council. Retrieved 30 May 2017.
  22. "Declaration of Results - St Michael's Ward" (PDF). Sunderland City Council. Retrieved 30 May 2017.
  23. "Declaration of Results - St Peter's Ward" (PDF). Sunderland City Council. Retrieved 30 May 2017.
  24. "Declaration of Results - Washington Central Ward" (PDF). Sunderland City Council. Retrieved 30 May 2017.
  25. "Declaration of Results - Washington East Ward" (PDF). Sunderland City Council. Retrieved 30 May 2017.
  26. "Declaration of Results - Washington North Ward" (PDF). Sunderland City Council. Retrieved 30 May 2017.
  27. "Declaration of Results - Washington South Ward" (PDF). Sunderland City Council. Retrieved 30 May 2017.
  28. "Declaration of Results - Washington West Ward" (PDF). Sunderland City Council. Retrieved 30 May 2017.
Preceded by
Sunderland City Council election, 2015
Sunderland City Council elections Succeeded by
Sunderland City Council election, 2018