Colchester Borough Council election, 2016

Last updated
Colchester Borough Council election, 2016
Flag of the United Kingdom.svg
  2015 5 May 2016 (2016-05-05) 2018  

All 51 seats to Colchester Borough Council
26 seats needed for a majority
Turnout 36.0%

 First partySecond party
  No image wide.svg No image wide.svg
Party Conservative Liberal Democrat
Seats before2720
Seats won2215
Seat changeDecrease2.svg 5Decrease2.svg 5
Popular vote47,08828,331
Percentage37.522.6

 Third partyFourth party
  No image wide.svg No image wide.svg
Party Labour Independent
Seats before93
Seats won113
Seat changeIncrease2.svg 2Steady2.svg
Popular vote27,8465,079
Percentage22.24.1

Council control before election

No overall control

Council control after election

No overall control

Elections to Colchester Borough Council took place on 5 May 2016. Colchester Borough Council normally elects one third of its councillors each year, however, due to boundary changes, the whole council is up for election.

Contents

Prior to this election, the cabinet (8 seats) was held by a coalition including the Liberal Democrats (5 seats), the Labour Party (2 seats) and a Highwoods & Stanway Independent (1 seat). Paul Smith (Liberal Democrat), a councillor from St. John's ward, was elected Leader of the Council by 32 to 28 votes.

Liberal Democrats (UK) Political party in the United Kingdom

The Liberal Democrats are a liberal political party in the United Kingdom. They presently have 11 Members of Parliament in the House of Commons, 96 members of the House of Lords, and one member of the European Parliament. They also have five Members of the Scottish Parliament and a member each in the Welsh Assembly and London Assembly. The party reached the height of its influence in the early 2010s, forming a junior partner in a coalition government from 2010 to 2015. It is presently led by Vince Cable.

The Labour Party is a centre-left political party in the United Kingdom which has been described as an alliance of social democrats, democratic socialists and trade unionists. The party's platform emphasises greater state intervention, social justice and strengthening workers' rights.

Each voter had three available votes instead of the usual one vote.

Background

Following the 2015 election the Liberal Democrat-Labour-Independent coalition maintained control of the Council, although with a much reduced majority (14 to 4). The Liberal Democrats suffered heavy losses in North and West Colchester with 4 councillors being unseated, all by the Conservative Party. The Conservatives subsequently became the largest party on the Council but short of a majority by 4 councillors. Although failing to win additional seats, the Labour Party made moderate gains in vote share across the Borough. Following a promising performance at the 2014 election, the UK Independence Party failed to build on their success and lost in vote share across Colchester, failing to take a single ward. Like UKIP, and despite a notable boost in local and national membership, the Green Party of England and Wales also fell in vote share and failed to win any seats. However, both UKIP and the Green Party received the highest number of votes for their respective parties in a Colchester local election.

Conservative Party (UK) Political party in the United Kingdom

The Conservative Party, officially the Conservative and Unionist Party, is a centre-right political party in the United Kingdom. Presently led by Theresa May, it has been the governing party since 2010. It presently has 314 Members of Parliament in the House of Commons, 249 members of the House of Lords, and 18 members of the European Parliament. It also has 31 Members of the Scottish Parliament, 12 members of the Welsh Assembly, eight members of the London Assembly and 9,008 local councillors. One of the major parties of UK politics, it has formed the government on 45 occasions, more than any other party.

Prior to the election, Independent member for Stanway, Laura Sykes, resigned her post as Borough Councillor due to moving away from the area. This left the ruling coalition with a majority of 3 over the Conservative group.

Boundary Changes

A boundary review was undertaken throughout 2014/2015 as part of a review of local authority electoral wards. The new electoral wards have taken effect from this election reducing the number of councillors by 9 (from 60 to 51), reducing the number of wards by 10 (from 27 to 17) and standardising the number of councillors representing each ward (3 councillors per ward). Each ward is designed to contain approximately 8,000 electors, taking into account the projected population growth over the next 10 years. [1]

Candidates by Party

Conservative Party (51/51)
Labour Party (51/51)
Green Party (48/51)
Liberal Democrats (38/51)
UKIP (10/51)
Independent (8/51)

Results Summary

Colchester Borough Council election, 2016
PartySeatsGainsLossesNet gain/lossSeats %Votes %Votes+/−
  Conservative 2216Decrease2.svg 543.137.547,088-2.6
  Liberal Democrat 1527Decrease2.svg 529.422.628,331+2.8
  Labour 1120Increase2.svg 221.622.227,846+3.8
  Independent 300Steady2.svg5.94.15,079+1.7
  Green 000Steady2.svg0.09.712,046+1.5
  UKIP 000Steady2.svg0.04.15,129-7.0

The total number of seats on the council was reduced from 60 to 51 seats, resulting in a nominal loss of 5 Conservative and 4 Liberal Democrats councillors. This is reflected in the changes in seats.

Council Composition

Prior to the election the composition of the council was:

209327
Liberal DemocratsLabourIndConservative

After the election, the composition of the council was:

1511322
Liberal DemocratsLabourIndConservative

Ward Results

Due to boundary changes the number of wards was reduced from 27 to 17. Each ward is represented by 3 councillors. The length of an elected councillor's term will depend on the position of election within that ward (1st, 4 years; 2nd, 3 years; 3rd, 2 years). Terms will revert to 4-years as standard from the 2018 election.

The Statement of Nominated Persons was released by Colchester Borough Council's Returning Officer following the closing of nominations on 7 April 2016. This detailed the list of candidates nominated to stand in each ward.

Incumbent councillors are marked with an asterisk*

Berechurch

Berechurch ward Berechurch ward.png
Berechurch ward
Berechurch
PartyCandidateVotes%
Labour Dave Harris*1,71027.4
Labour Chris Pearson*1,28320.5
Labour Martyn Warnes1,20619.3
Conservative Annabel Glayzer3665.9
Conservative Michael Brown3595.7
Conservative Chris Brown3565.7
UKIP Ralph Morse3535.6
Liberal Democrat Katie Hood1812.9
Liberal Democrat George Penny1552.5
Liberal Democrat Jakub Makowski1442.3
Green Sam Borley1422.3
Turnout 2,36132.4
Labour hold
Labour hold
Labour hold
Top-candidate result%+/-
Labour 62.1+11.9
Conservative 13.3-8.7
UKIP 12.8-0.5
Liberal Democrat 6.6-3.8
Green 5.2+1.3

Castle

Castle ward Castle ward.png
Castle ward
Castle
PartyCandidateVotes%
Liberal Democrat Nick Barlow88111.1
Conservative Darius Laws*85410.7
Conservative Daniel Ellis80110.1
Liberal Democrat Bill Frame*7929.9
Green Mark Goacher7819.8
Liberal Democrat Jo Hayes*7699.7
Conservative Kate Martin7599.5
Green Amanda Kirke5116.4
Labour Isobel Merry4846.1
Labour Barry Gilheany4525.7
Green Charles Ham4515.7
Labour Jordan Newell4275.4
Turnout 2,78137.4
Liberal Democrat hold
Conservative hold
Conservative gain from Liberal Democrat
Top-candidate result%+/-
Liberal Democrat 29.4+4.1
Conservative 28.5-7.4
Green 26.0+5.0
Labour 16.1-1.6

Greenstead

Greenstead ward Greenstead ward.png
Greenstead ward

Greenstead was created from the following wards:

Greenstead
PartyCandidateVotes%
Labour Julie Young*1,14418.7
Labour Tim Young*1,13418.5
Labour Tina Bourne*99916.3
Conservative Chris Hill5178.4
UKIP Jamie Middleditch4216.7
Liberal Democrat Owen Bartholomew3886.3
Conservative Paul Hanslow3415.6
Conservative Andrew Higginson3095.0
Liberal Democrat Josef Schumacher2884.7
Green Chris Flossman1933.1
Independent Christopher Lee1833.0
Green Poppy Gerrard-Abbott1151.9
Green Asa Bortherton1031.7
Turnout 2,27930.3
Labour win (new seat)
Top-candidate result
Labour
40.2%
Conservative
18.2%
UKIP
14.8%
Liberal Democrat
13.6%
Green Party
6.8%
Independent
6.4%

Highwoods

Highwoods ward Highwoods ward.png
Highwoods ward
Highwoods
PartyCandidateVotes%
Independent Gerard Oxford*1,12617.0
Independent Bev Oxford*1,03815.7
Independent Phil Oxford*95414.4
Conservative Chris Hayter69010.4
Conservative James Child5888.9
Conservative Steph Hayward5227.9
Labour David McCulloch2874.3
Labour Gary Braddy2854.3
Labour Diane Stevens2834.3
Liberal Democrat John Baker2734.1
UKIP Alexei Knupffer2513.8
Green Robbie Spence1392.1
Green Bonnie Murphy921.4
Green Leo Palmer911.4
Turnout 2,34833.4
Independent hold
Independent hold
Independent hold
Top-candidate result%+/-
Independent 40.7+3.8
Conservative 24.9-2.7
Labour 10.4-0.7
Liberal Democrat 9.9-0.9
UKIP 9.1-0.1
Green 5.0+0.7

Lexden & Braiswick

Lexden & Braiswick ward Lexden & Braiswick ward.png
Lexden & Braiswick ward

Lexden & Braiswick was created from the following wards:

Lexden & Braiswick
PartyCandidateVotes%
Conservative Dennis Willits*1,71221.1
Conservative Lewis Barber*1,70421.0
Conservative Brian Jarvis*1,60919.8
Liberal Democrat Thomas Stevenson5156.4
Liberal Democrat Gemma Graham4105.1
Green Steve Ford3864.8
Liberal Democrat Susan Waite3674.5
Labour Alison Inman3354.1
Labour Sioux Blair-Jordan3214.0
Labour Megan Saliu2843.5
Green Rosa Chandler2473.0
Green Emmanuel Blondel2192.7
Turnout 2,88640.4
Conservative win (new seat)
Top-candidate result
Conservative
58.1%
Liberal Democrat
17.5%
Green Party
13.1%
Labour
11.4%

Marks Tey & Layer

Marks Tey & Layer ward Marks Tey & Layer ward.png
Marks Tey & Layer ward

Marks Tey & Layer was created from the following wards:

Marks Tey & Layer
PartyCandidateVotes%
Conservative Kevin Bentley*1,42423.4
Conservative Andrew Ellis*1,24820.5
Conservative Jackie Maclean*1,13518.7
UKIP John Pitts5238.6
Labour John Wood3796.2
Liberal Democrat Gillian Collings3405.6
Green Clare Palmer3025.0
Labour John Spademan2964.9
Labour Michael Wagstaff2313.8
Green Matt Stemp2063.4
Turnout 2,39635.8
Conservative win (new seat)
Top-candidate result
Conservative
48.0%
UKIP
17.6%
Labour
12.8%
Liberal Democrat
11.5%
Green Party
10.2%

Mersea & Pyefleet

Mersea & Pyefleet ward Mersea.png
Mersea & Pyefleet ward

Mersea & Pyefleet was created from the following wards:

Mersea & Pyefleet
PartyCandidateVotes%
Conservative John Jowers*1,64318.6
Conservative Patricia Moore*1,43316.2
Conservative Robert Davidson*1,39215.8
UKIP David Broise7688.7
UKIP David Holmes7688.7
Labour Bry Mogridge5155.8
UKIP Maria Vigneau5075.7
Green Lisa Britton4595.2
Green Peter Banks4264.8
Labour Neil Belcher3013.4
Labour Ron Smith2693.0
Liberal Democrat Barry Woodward2022.3
Green Bartosz Mizgier1431.6
Turnout 3,17539.5
Conservative win (new seat)
Top-candidate result%
Conservative 45.8
UKIP 21.4
Labour 14.4
Green 12.8
Liberal Democrat 5.6

Mile End

Mile End ward Mile End ward.png
Mile End ward
Mile End
PartyCandidateVotes%
Liberal Democrat Martin Goss*1,66622.6
Liberal Democrat Phillip Coleman1,37518.6
Liberal Democrat Dominic Graham*1,34418.2
Conservative Ben Locker*7319.9
Conservative Stephen Rowe5437.4
Conservative Thomas Rowe5257.1
Labour Martin Camroux3024.1
Labour Beverly Pearce2583.5
Labour Elisa Vasquez-Walters2213.0
Green David Traynier2062.8
Green Mary Bryan1271.7
Green Peter Lynn881.2
Turnout 2,62237.7
Liberal Democrat hold
Liberal Democrat gain from Conservative
Liberal Democrat hold
Top-candidate result%+/-
Liberal Democrat 57.3+25.1
Conservative 25.2-13.2
Labour 10.4-2.5
Green 7.1+0.4

New Town & Christ Church

New Town & Christ Church ward New Town & Christ Church ward.png
New Town & Christ Church ward

New Town & Christ Church was created from the following wards:

New Town & Christ Church
PartyCandidateVotes%
Liberal Democrat Theresa Higgins*1,14013.7
Liberal Democrat Nick Cope*1,11313.4
Liberal Democrat Annie Feltham*1,03212.4
Labour Abigail Fuller7108.5
Conservative Annesley Hardy*6918.3
Conservative Simon Crow6668.0
Conservative Ben Payne6167.4
Labour Oladipo Odedengbe5636.8
Labour Jaki Whyte5596.7
Green Bob Brannan5556.7
Green Ruby Runnalls Palmer3464.2
Green Laurence Knight3173.8
Turnout 2,90033.9
Liberal Democrat win (new seat)
Top-candidate result%
Liberal Democrat 36.8
Conservative 22.9
Labour 22.3
Green 17.9

Old Heath & The Hythe

Old Heath & The Hythe ward Old Heath & The Hythe ward.png
Old Heath & The Hythe ward

Old Heath & The Hythe was created from the following wards:

Old Heath & The Hythe
PartyCandidateVotes%
Labour Mike Lilley*1,12615.4
Labour Adam Fox1,02513.8
Labour Lee Scordis92512.5
Liberal Democrat Julia Havis*74710.1
Liberal Democrat Janet Knight7119.6
Liberal Democrat Justin Knight*6899.3
Green Susan Allen4516.1
Conservative Liam Gallagher4355.9
Conservative Richard Brown4035.4
Conservative Alan Scattergood3444.6
Green Jan Plummer3024.1
Green Andrew Canessa2583.5
Turnout 2,69934.8
Labour win (new seat)
Top-candidate result
Labour
40.8%
Liberal Democrat
27.1%
Green Party
16.3%
Conservative
15.8%

Prettygate

Prettygate ward Prettygate ward.png
Prettygate ward
Prettygate
PartyCandidateVotes%
Conservative Sue Lissimore*2,02422.8
Conservative Beverly Davis*1,67518.9
Conservative Roger Buston*1,63718.4
Liberal Democrat Jake Beavan6497.3
Labour Mike Dale5996.7
Liberal Democrat Glanville Williams5856.6
Labour Richard Bourne5636.3
Labour Clive Needle3794.3
Green Ruby Butler3694.2
Green Luke O'Loughlin2092.4
Green Mike Stewart1922.2
Turnout 3,22740.6
Conservative hold
Conservative hold
Conservative hold
Top-candidate result%+/-
Conservative 55.6+4.5
Liberal Democrat 17.8-3.9
Labour 16.5+4.7
Green 10.1+5.7

Rural North

Rural North ward Rural North ward.png
Rural North ward

Rural North was created from the following wards:

Rural North
PartyCandidateVotes%
Conservative Christopher Arnold*1,91324.1
Conservative Nigel Chapman*1,82423.0
Conservative Peter Chillingworth*1,66521.0
Green Roger Bamforth4886.1
Liberal Democrat Will Brown4786.0
Green Blake Roberts3674.6
Labour Kevin Finnigan3224.1
Labour Judith Short3194.0
Green Janita Le Fevre2823.6
Labour Paul Fryer-Kelsey2783.5
Turnout 3,03036.2
Conservative win (new seat)
Top-candidate results
Conservative
59.8%
Green Party
15.2%
Liberal Democrat
14.9%
Labour
10.1%

Shrub End

Shrub End ward Shrub End ward.png
Shrub End ward
Shrub End
PartyCandidateVotes%
Liberal Democrat Lyn Barton*96016.9
Liberal Democrat Karen Chaplin56910.0
Conservative Pauline Hazell*5269.2
Conservative Mike Hardy5109.0
Liberal Democrat Jamie Chaplin5088.9
Conservative Vic Flores4968.7
UKIP Bruno Hickman3796.7
Independent Sharron Lawrence3496.1
Labour Bruce Tuxford3245.7
Labour Steve Dunt3225.7
Labour Stuart Ellis3055.4
Green Wolfgang Fauser2063.6
Green Stuart Welham1432.5
Green Maria Harrison921.6
Turnout 2,16528.2
Liberal Democrat hold
Conservative hold
Top-candidate result%+/-
Liberal Democrat 35.0
+8.8
Conservative 19.2
-15.2
UKIP 13.8
-3.3
Independent 12.7
N/A
Labour 11.8
-4.9
Green 7.5
+1.8

St. Anne's & St. John's

St. Anne's & St. John's ward St. Anne's & St. John's ward.png
St. Anne's & St. John's ward

St. Anne's & St. John's was created from the following wards:

St. Anne's & St. John's
PartyCandidateVotes%
Liberal Democrat Mike Hogg*1,42617.9
Liberal Democrat Helen Chuah*1,35217.0
Liberal Democrat Paul Smith*1,21515.3
UKIP Jason Berry6378.0
Conservative Charles McKay5687.1
UKIP Bill Faram5296.6
Conservative Peter Klejna-Wendt5116.4
Conservative Terry Sutton4655.8
Labour Sam Fuller2763.5
Labour Amanda Stannard2743.4
Labour Alex Yeandle2513.2
Green Callum Fauser1912.4
Green Robert Chambers1602.0
Green Megan Maltby1111.4
Turnout 2,88335.7
Liberal Democrat win (new seat)
Top-candidate result
Liberal Democrat
46.0%
UKIP
20.6%
Conservative
18.3%
Labour
8.9%
Green Party
6.2%

Stanway

Stanway ward Stanway ward.png
Stanway ward
Stanway
PartyCandidateVotes%±
Conservative Fiona Maclean*96315.0N/A
Liberal Democrat Lesley Scott-Boutell96215.0N/A
Liberal Democrat Jessica Scott-Boutell*94414.8N/A
Conservative Paul Dundas83913.1N/A
Conservative Christopher Manby79212.4N/A
Liberal Democrat Jon Manning*6299.8N/A
Labour David Hough3024.7N/A
Labour Carol Spademan3024.7N/A
Labour Ian Yates2564.0N/A
Green Walter Schwartz1372.1N/A
Green Will Price1372.1N/A
Green Nicholas Blondel1362.1N/A
Turnout 2,33136.2N/A
Conservative hold Swing
Liberal Democrat gain from Independent Swing
Liberal Democrat hold Swing
Party%+/-
Conservative 40.7-1.7
Liberal Democrat 40.7+3.7
Labour 12.8-1.4
Green 5.8-0.2

Tiptree

Tiptree ward Tiptree.png
Tiptree ward
Tiptree
PartyCandidateVotes%
Conservative John Elliott*1,45924.1
Conservative Barbara Wood1,40323.2
Conservative Derek Loveland1,37022.6
Labour Joanne Devine4006.6
Labour Barbara Nichols4006.6
Labour Robert Spademan3716.1
Green Kathy Bamforth2914.8
Green Rob Cronshaw1963.2
Green Adam Abo Henriksen1652.7
Turnout 2,24731.5
Conservative hold
Conservative hold
Conservative hold
Top-candidate result%+/-
Conservative 67.9+25.1
Labour 18.6+5.4
Green 13.5+10.3

Wivenhoe

Wivenhoe ward Wivenhoe.png
Wivenhoe ward

Wivenhoe was created from the following wards:

Wivenhoe
PartyCandidateVotes%
Labour Co-op Cyril Liddy*1,15412.2
Liberal Democrat Mark Cory*1,14112.0
Labour Co-op Rosalind Scott*1,13712.0
Labour Co-op Phil Finn99810.5
Conservative Peter Hill9069.5
Liberal Democrat Sanchia Nash8929.4
Independent Andrea Luxford Vaughan5495.8
Liberal Democrat Alex Hale4995.3
Independent Mike Newton4644.9
Conservative Craig Stuart4474.7
Independent Shaun Boughton4164.4
Conservative Roman Perrior3794.0
Green Tim Glover2782.9
Green Laura Pountney1231.3
Green Lora Aziz1131.2
Turnout 3,18553.3
Labour Co-op win (new seat)
Liberal Democrat win (new seat)
Labour Co-op win (new seat)
Top-candidate result
Labour
28.6%
Liberal Democrat
28.3%
Conservative
22.5%
Independent
13.6%
Green Party
6.9%

Related Research Articles

Borough of Colchester Place in England

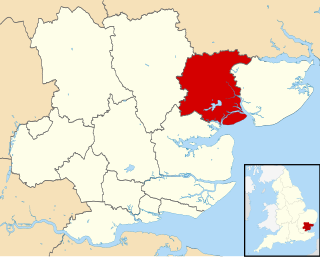
The Borough of Colchester is a local government district and borough in Essex, England, named after its main town, Colchester. The borough covers an area of 125 square miles (320 km2) and stretches from Dedham Vale on the Suffolk border in the north to Mersea Island on the Colne Estuary in the south.

Colchester (UK Parliament constituency) Parliamentary constituency in the United Kingdom

Colchester is a constituency represented in the House of Commons of the UK Parliament since 2015 by Will Quince, a Conservative.

North Essex (UK Parliament constituency) Parliamentary constituency in the United Kingdom, 1997-2010

North Essex was a parliamentary constituency represented in the House of Commons of the Parliament of the United Kingdom between 1997 and 2010. It elected one Member of Parliament (MP) by the first past the post system of election.

Harwich and North Essex (UK Parliament constituency) Parliamentary constituency in the United Kingdom

Harwich and North Essex is a constituency represented in the House of Commons of the UK Parliament by Bernard Jenkin of the Conservative Party since its creation in 2010.

Colchester Politics: Colchester is a historic town located in Essex, England. It served as the first capital of Roman Britain and makes a claim to be the oldest town in Britain.

Colchester North (UK Parliament constituency) Parliamentary constituency in the United Kingdom

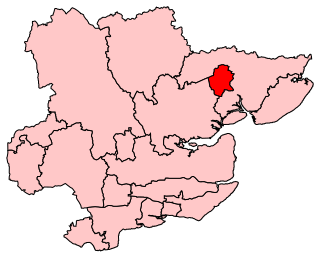
Colchester North was a borough constituency in Essex, represented in the House of Commons of the Parliament of the United Kingdom from 1983 until 1997. It elected one Member of Parliament (MP) by the first past the post system of election. It was a safe Conservative seat throughout its existence.

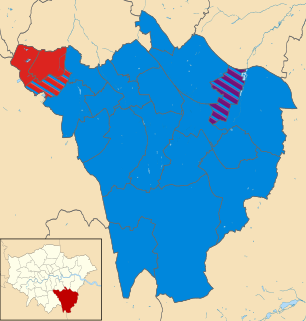
The 2011 council elections in Guildford saw the Conservatives retain control over Guildford Borough Council with an increased majority of 20 seats. Full results for each ward can be found at Guildford Council election, full results, 2011.

The 2002 Colchester Borough Council election took place on 2 May 2002 to elect members of Colchester Borough Council in Essex, England. This was the same day as the other 2002 local elections in the United Kingdom. Due to boundary changes, every seat was up for election and the council stayed under no overall control.

2003 Colchester Borough Council election

The 2003 Colchester Borough Council election took place on 1 May 2003 to elect members of Colchester Borough Council in Essex, England. This was the same day as the other 2003 United Kingdom local elections. One third of the seats were up for election and the council stayed under no overall control.

2014 Bromley London Borough Council election

Elections to Bromley Council were held on 22 May 2014.

The 2000 Colchester Borough Council election took place on 4 May 2000 to elect members of Colchester Borough Council in Essex, England. One third of the council was up for election and the council stayed under no overall control.

2007 Colchester Borough Council election

The 2007 Colchester Borough Council election took place on 3 May 2007 to elect members of Colchester Borough Council in Essex, England. One third of the council was up for election and the council stayed under no overall control.

2008 Colchester Borough Council election

The 2008 Colchester Borough Council election took place on 1 May 2008 to elect members of Colchester Borough Council in Essex, England. One third of the council was up for election and the Conservative party lost overall control of the council to no overall control.

2010 Colchester Borough Council election

The 2010 Colchester Borough Council election took place on 6 May 2010 to elect members of Colchester Borough Council in Essex, England. One third of the council was up for election and the council stayed under no overall control.

The 2014 Colchester Borough Council election took place on 22 May 2014 to elect members of Colchester Borough Council in Essex, England. One third of the council was up for election and the council stayed under no overall control.

2014 Havant Borough Council election

The 2014 Havant Borough Council election took place on 22 May 2014 to elect members of Havant Borough Council in Hampshire, England. One third of the council was up for election and the Conservative party stayed in overall control of the council.

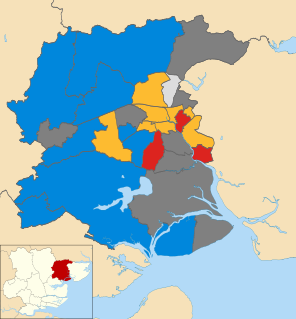
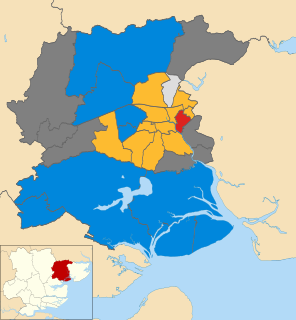
The 2015 Colchester Borough Council election took place on 7 May 2015 to elect one third of the members of Colchester Borough Council in England. This was the same day as other local elections and as the General Election. Colchester Borough Council is made up of 60 councillors: 20 councillors were up for election.

Castle (Colchester electoral ward)

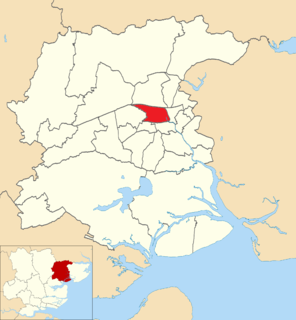
Castle is an electoral ward in Colchester and is within the Colchester Borough Council boundary, to which it elects 3 councillors.

2018 Lambeth London Borough Council election

The 2018 Lambeth Council election took place on 3 May 2018 to elect members of Lambeth Council in England. The election saw Labour remain in control of Lambeth Council with a slightly reduced majority, winning over 90% of the seats. The Green Party of England and Wales achieved its best-ever result in the borough, winning 5 seats and becoming the official opposition.

References

  1. "Local Boundary Commission for England". www.lgbce.org.uk. Retrieved 14 September 2016.