| |||||||||||||||||||||||||||||||||||||||||||||||||||||||||||||
All 30 seats to Woking Borough Council 16 seats needed for a majority | |||||||||||||||||||||||||||||||||||||||||||||||||||||||||||||
---|---|---|---|---|---|---|---|---|---|---|---|---|---|---|---|---|---|---|---|---|---|---|---|---|---|---|---|---|---|---|---|---|---|---|---|---|---|---|---|---|---|---|---|---|---|---|---|---|---|---|---|---|---|---|---|---|---|---|---|---|---|
|
The 2016 Woking Borough Council election took place on 5 May 2016 to elect members of Woking Borough Council in England. [1] This was on the same day as other elections across the UK and the Police and Crime Commissioner election for Surrey Police.
Boundary changes coincided with a shrinking of the council, so all seats were up for election. In each ward, 3 candidates were elected, with the leading candidate being elected for 4 years, the second-placed candidate being elected for 3 years and the third-placed candidate being elected for 2 years. As a result, there will be no borough elections in 2017, but a third of the council will be up for re-election in each of 2018, 2019 and 2020.
Prior to the election, the Conservatives had a strong majority on the council, with 24 seats compared to 9 for the Liberal Democrats, 2 Labour councillors, and one independent.
The Conservative Party, officially the Conservative and Unionist Party, is a centre-right political party in the United Kingdom. The governing party since 2010, it is the largest in the House of Commons, with 313 Members of Parliament, and also has 249 members of the House of Lords, 18 members of the European Parliament, 31 Members of the Scottish Parliament, 12 members of the Welsh Assembly, eight members of the London Assembly and 8,916 local councillors.
The Liberal Democrats are a centrist, liberal political party in the United Kingdom. It is currently led by Vince Cable. It has 11 Members of Parliament in the House of Commons, 96 members of the House of Lords, one member of the European Parliament, five Members of the Scottish Parliament and one member in the Welsh Assembly and London Assembly. At the height of its influence, the party served as junior partners in a coalition government with the Conservative Party from 2010 to 2015.
The Labour Party is a centre-left political party in the United Kingdom that has been described as an alliance of social democrats, democratic socialists and trade unionists. The party's platform emphasises greater state intervention, social justice and strengthening workers' rights.
Despite remaining as the largest party, the result was considered poor for the Conservatives, who saw their majority reduced to two after losing seven sitting councillors. Independent councillors won all three seats in Byfleet, defeating Liberal Democrat Anne Roberts and Conservatives Gary Elson and Richard Wilson. The Liberal Democrats won seats back from the Conservatives in the new Hoe Valley ward, and defeated Conservative incumbents in Goldsworth Park and St Johns, while Labour took all three seats in Canalside, where the council was taking forward a controversial redevelopment scheme.
Byfleet is a village in Surrey, England. It is located in the far east of the borough of Woking, around 1.5 miles (2.4 km) east of West Byfleet, from which it is separated by the M25 motorway and the Wey Navigation.
In the Mount Hermon ward, Conservative councillor Carl Thomson and Liberal Democrat Liam Lyons both lost their seats, with 22 votes separating the second and fourth placed candidates.
As a result of the election, long-standing council leader Councillor John Kingsbury faced a vote of confidence from the Conservative group, but was ultimately nominated for another year as leader after no other candidate emerged. [2] Councillor Kingsbury later announced his retirement as council leader in 2017, and stood down as a councillor at the 2018 local elections. [3]
Party | Seats | Gains | Losses | Net gain/loss | Seats % | Votes % | Votes | +/− | |
---|---|---|---|---|---|---|---|---|---|
Conservative | 17 | N/A | N/A | –7 | 56 2/3% | 47.51% | 34,980 | — | |
Liberal Democrat | 7 | N/A | N/A | –2 | 23 1/3% | 28.13% | 20,707 | — | |
Labour | 3 | N/A | N/A | +1 | 10% | 10.39% | 7,647 | — | |
Independent | 3 | N/A | N/A | +2 | 10% | 5.41% | 3,982 | — | |
UKIP | 0 | N/A | N/A | 0 | 0 | 5.37% | 3,956 | — | |
Green | 0 | N/A | N/A | 0 | 0 | 3.19% | 2,351 | — | |
Totals | 30 | N/A | N/A | –6 | 100% | 100% | 73,623 | — | |
Party | Candidate | Votes | % | |
---|---|---|---|---|
Independent | John Edwin Bond (elected for 4 years) | 1,474 | ||
Independent | Amanda Jayne Boote (elected for 3 years) | 1,385 | ||
Independent | Mary Ann Bridgeman (elected for 2 years) | 1,123 | ||
Conservative | Richard Arthur Gillard Wilson | 1,011 | ||
Conservative | Gary William Elson | 929 | ||
Conservative | Pauline Mary Hedges | 922 | ||
Liberal Democrat | Anne Elizabeth Roberts | 724 | ||
Liberal Democrat | Andrew Nigel Grimshaw | 582 | ||
Liberal Democrat | Karon Jane Read | 534 | ||
UKIP | Neil James Willetts | 295 | ||
Registered electors | 8316 | |||
Turnout | 3341 | 40.18% | ||
Independent win (new seat) | ||||
Party | Candidate | Votes | % | |
---|---|---|---|---|
Labour | Tahir Aziz (elected for 4 years) | 1,106 | ||
Labour | Mohammad Ali (elected for 3 years) | 1,071 | ||
Labour | Mohammad Ilyas Raja (elected for 2 years) | 1,060 | ||
Conservative | Paula Jane Marcus | 868 | ||
Conservative | Matthew Howard Provost | 829 | ||
Conservative | Colin Patrick Scott | 807 | ||
UKIP | David Simon Roe | 383 | ||
UKIP | Judith Diana | 332 | ||
Liberal Democrat | Rebecca Elisabeth Whale | 300 | ||
Green | Christopher David Calvin Dykes | 281 | ||
Liberal Democrat | Gareth Davies | 279 | ||
Liberal Democrat | Norman Grenville Johns | 230 | ||
Registered electors | 7517 | |||
Turnout | 2862 | 38.07% | ||
Labour win (new seat) | ||||
Party | Candidate | Votes | % | |
---|---|---|---|---|
Liberal Democrat | Ann-Marie Barker (elected for 4 years) | 894 | ||
Liberal Democrat | Ian Eastwood (elected for 3 years) | 885 | ||
Conservative | Chitra Rana (elected for 2 years) | 858 | ||
Conservative | Laura Ashall | 847 | ||
Liberal Democrat | James Richard Sanderson | 806 | ||
Conservative | Rizwan Shah | 707 | ||
Labour | John Scott-Morgan | 366 | ||
UKIP | Troy de Leon | 356 | ||
Labour | William Eric Owen | 327 | ||
Labour | Robina Shaheen | 327 | ||
Green | Eve Catherine Carnall | 219 | ||
Registered electors | 7036 | |||
Turnout | 2510 | 35.67% | ||
Liberal Democrat win (new seat) | ||||
Conservative win (new seat) | ||||
Party | Candidate | Votes | % | |
---|---|---|---|---|
Conservative | Kevin Mark Davis (elected for 4 years) | 1,519 | ||
Conservative | Ayesha Azad (elected for 3 years) | 1,462 | ||
Conservative | Robert John Kingsbury (elected for 2 years) | 1,375 | ||
Liberal Democrat | Margaret Marion Hill | 586 | ||
Liberal Democrat | Henry David Kay | 555 | ||
Liberal Democrat | Alison Jane Sanderson | 482 | ||
Green | Anna Katharine Wright | 380 | ||
UKIP | Richard Peter Farr Squire | 336 | ||
Labour | John Martin | 316 | ||
Registered electors | 7014 | |||
Turnout | 2711 | 38.65% | ||
Conservative win (new seat) | ||||
Party | Candidate | Votes | % | |
---|---|---|---|---|
Liberal Democrat | Will Forster (elected for 4 years) | 1,126 | ||
Liberal Democrat | Louise Mary Nell Morales (elected for 3 years) | 1,022 | ||
Liberal Democrat | Deborah Elizabeth Hughes (elected for 2 years) | 967 | ||
Conservative | Nathalie Bourne | 614 | ||
Conservative | John Frederick Lawrence | 567 | ||
Conservative | Daryl Martin Smith | 506 | ||
UKIP | Jim Gore | 322 | ||
Labour | Nigel Peter Jackson | 276 | ||
Labour | Frances Louise Carpenter | 275 | ||
Labour | Christopher David Martin | 249 | ||
Registered electors | 6292 | |||
Turnout | 2352 | 37.38% | ||
Liberal Democrat win (new seat) | ||||
Party | Candidate | Votes | % | |
---|---|---|---|---|
Conservative | Beryl Ann Hunwicks (elected for 4 years) | 1,744 | ||
Conservative | Colin Sidney Kemp (elected for 3 years) | 1,651 | ||
Conservative | Anne Elizabeth Murray (elected for 2 years) | 1,569 | ||
Liberal Democrat | Anthony Laurence Kremer | 871 | ||
Liberal Democrat | Rosemary Peta Johnson | 758 | ||
Liberal Democrat | Samuel David Watts | 519 | ||
UKIP | Stephen Anthony Herbert | 366 | ||
Labour | Elizabeth Anne Evans | 348 | ||
Green | Lucy Rhodes Dykes | 310 | ||
Labour | Colin Robert Bright | 285 | ||
Labour | Thomas George Willis | 244 | ||
Registered electors | 7177 | |||
Turnout | 3134 | 43.67% | ||
Conservative win (new seat) | ||||
Party | Candidate | Votes | % | |
---|---|---|---|---|
Conservative | Sajjad Hussain (elected for 4 years) | 1,587 | ||
Conservative | Melanie Anne Whitehand (elected for 3 years) | 1,333 | ||
Conservative | Deborah Harlow (elected for 2 years) | 1,293 | ||
Green | James William Brierley | 407 | ||
Liberal Democrat | Vanessa Ellicott | 399 | ||
Liberal Democrat | David Geoffrey Barker | 394 | ||
Labour | Richard Peter Ford | 384 | ||
UKIP | Terence John Knight | 372 | ||
Liberal Democrat | Syed Waqar Haider Jaffri | 223 | ||
Registered electors | 7506 | |||
Turnout | 2591 | 34.52% | ||
Conservative win (new seat) | ||||
Party | Candidate | Votes | % | |
---|---|---|---|---|
Conservative | David John Bittleston (elected for 4 years) | 1,289 | ||
Liberal Democrat | Ian Johnson (elected for 3 years) | 1,168 | ||
Conservative | Mark Russell John Pengelly (elected for 2 years) | 1,159 | ||
Conservative | Carl William Thomson | 1,146 | ||
Liberal Democrat | Liam Stuart Lyons | 1,104 | ||
Liberal Democrat | Sinclair Aubrey Webster | 980 | ||
Green | John Robert George Parkin | 379 | ||
UKIP | Lynda Mary Sage | 229 | ||
Registered electors | 7389 | |||
Turnout | 2782 | 37.65% | ||
Conservative win (new seat) | ||||
Liberal Democrat win (new seat) | ||||
Conservative win (new seat) | ||||
Party | Candidate | Votes | % | |
---|---|---|---|---|
Conservative | Graham Gray Chrystie (elected for 4 years) | 1,892 | ||
Conservative | Ashley Christian Lawrence Bowes (elected for 3 years) | 1,853 | ||
Conservative | Rashid Mohammed (elected for 2 years) | 1,433 | ||
Liberal Democrat | Ian Michael Lachowicz | 579 | ||
UKIP | Robin Deller Millner | 523 | ||
Labour | Misbah Zahid | 521 | ||
Labour | David Williams | 492 | ||
Liberal Democrat | Richard Peter John Sanderson | 497 | ||
Liberal Democrat | Guy Tuson Cosnahan | 373 | ||
Registered electors | 7346 | |||
Turnout | 3172 | 43.18% | ||
Conservative win (new seat) | ||||
Party | Candidate | Votes | % | |
---|---|---|---|---|
Conservative | Graham Stephen Cundy (elected for 4 years) | 1,174 | ||
Conservative | Hilary Jane Addison (elected for 3 years) | 1,098 | ||
Liberal Democrat | Kenneth Howard (elected for 2 years) | 1,052 | ||
Liberal Democrat | Christina Judith Liddington | 1,043 | ||
Conservative | Paul Graham Smith | 938 | ||
Liberal Democrat | Christopher James Took | 775 | ||
UKIP | Timothy Martin Read | 442 | ||
Green | Joel Benjamin Street | 375 | ||
Registered electors | 7264 | |||
Turnout | 2650 | 36.48% | ||
Conservative win (new seat) | ||||
Liberal Democrat win (new seat) | ||||
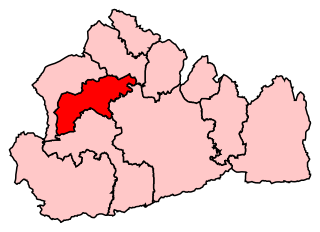
Woking is a constituency created in 1950 represented in the House of Commons of the UK Parliament. To date it has elected at each election the Conservative Party candidate.
Guildford Council in Surrey, England is elected every four years.
Elections for the Council in the London Borough of Croydon are held every four years to elect 70 councillors. At the last elections, which were held in May 2014, 30 Conservative councillors and 40 Labour councillors, providing a Labour majority of ten seats.
The 2003 Harlow District Council election took place on 1 May 2003 to elect members of Harlow District Council in Essex, England. One third of the council was up for election and the council stayed under no overall control.
The 2007 council elections in Guildford saw the Conservatives retain control over Guildford Borough Council. Full results for each ward can be found at Guildford Council election, full results, 2007.
The 2003 Woking Council election took place on 1 May 2003 to elect members of Woking Borough Council in Surrey, England. One third of the council was up for election and the council stayed under no overall control.
The 2004 Woking Council election took place on 10 June 2004 to elect members of Woking Borough Council in Surrey, England. One third of the council was up for election and the council stayed under no overall control.
The 2006 Woking Council election took place on 4 May 2006 to elect members of Woking Borough Council in Surrey, England. One third of the council was up for election and the council stayed under no overall control.
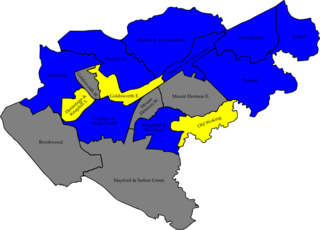
The 2007 Woking Council election took place on 3 May 2007 to elect members of Woking Borough Council in Surrey, England. One third of the council was up for election and the Conservative party gained overall control of the council from no overall control.
The 2008 Woking Council election took place on 1 May 2008 to elect members of Woking Borough Council in Surrey, England. One third of the council was up for election and the Conservative party stayed in overall control of the council.
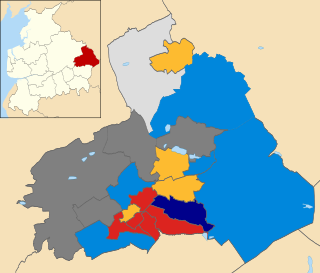
The 2008 Pendle Borough Council election took place on 1 May 2008 to elect members of Pendle Borough Council in Lancashire, England. One third of the council was up for election and the Liberal Democrats lost overall control of the council to no overall control.
The 2010 Woking Council election took place on 1 May 2010, on the same day as the 2010 general election, to elect members of Woking Borough Council in Surrey, England. One third of the council was up for election and the council stayed under no overall control.
The 2011 council elections in Guildford saw the Conservatives retain control over Guildford Borough Council with an increased majority of 20 seats. Full results for each ward can be found at Guildford Council election, full results, 2011.
The 2012 Pendle Borough Council election took place on 3 May 2012 to elect members of Pendle Borough Council in Lancashire, England. One third of the council was up for election and the council stayed under no overall control.
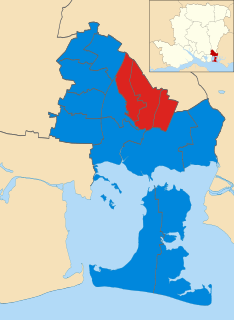
The 2012 Havant Borough Council election took place on 3 May 2012 to elect members of Havant Borough Council in Hampshire, England. One third of the council was up for election and the Conservative party stayed in overall control of the council.
The 2014 Brent London Borough Council election took place on 22 May 2014 to elect members of Brent London Borough Council in London, England. The whole council was up for election and the Labour Party stayed in overall control of the council.
The 2012 St Helens Metropolitan Borough Council election took place on 3 May 2012 to elect members of St Helens Metropolitan Borough Council in Merseyside, England. One third of the council was up for election and the Labour party stayed in overall control of the council.
The 2014 St Helens Metropolitan Borough Council election took place on 22 May 2014 to elect members of St Helens Metropolitan Borough Council in Merseyside, England. One third of the council was up for election and the Labour party stayed in overall control of the council.
The 2015 Guildford Borough Council election took place on 7 May 2015 to elect members of Guildford Borough Council in England as one of the 2015 local elections, held simultaneously with the General Election.
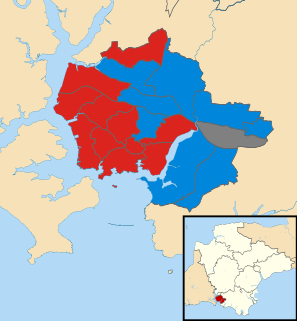
The 2018 Plymouth City Council election took place on 3 May 2018 to elect members of Plymouth City Council in England. The election was won by the Labour Party, who gained enough seats to achieve an overall majority and took control of the council.