Elections to Amber Valley Borough Council in Derbyshire, England took place on Thursday 5 May 2016. One third of the council seats were up for election and after the election the Conservative party continued to hold overall control of the council.
Derbyshire is a county in the East Midlands of England. A substantial portion of the Peak District National Park lies within Derbyshire, containing the southern extremity of the Pennine range of hills which extend into the north of the county. The county contains part of the National Forest, and borders on Greater Manchester to the northwest, West Yorkshire to the north, South Yorkshire to the northeast, Nottinghamshire to the east, Leicestershire to the southeast, Staffordshire to the west and southwest and Cheshire also to the west. Kinder Scout, at 636 metres (2,087 ft), is the highest point in the county, whilst Trent Meadows, where the River Trent leaves Derbyshire, is its lowest point at 27 metres (89 ft). The River Derwent is the county's longest river at 66 miles (106 km), and runs roughly north to south through the county. In 2003 the Ordnance Survey placed Church Flatts Farm at Coton in the Elms as the furthest point from the sea in Great Britain.
England is a country that is part of the United Kingdom. It shares land borders with Wales to the west and Scotland to the north-northwest. The Irish Sea lies west of England and the Celtic Sea lies to the southwest. England is separated from continental Europe by the North Sea to the east and the English Channel to the south. The country covers five-eighths of the island of Great Britain, which lies in the North Atlantic, and includes over 100 smaller islands, such as the Isles of Scilly and the Isle of Wight.
The Conservative Party, officially the Conservative and Unionist Party, is a centre-right political party in the United Kingdom. Presently led by Theresa May, it has been the governing party since 2010. It presently has 314 Members of Parliament in the House of Commons, 249 members of the House of Lords, and 18 members of the European Parliament. It also has 31 Members of the Scottish Parliament, 12 members of the Welsh Assembly, eight members of the London Assembly and 9,008 local councillors. One of the major parties of UK politics, it has formed the government on 45 occasions, more than any other party.
After the election, the composition of the council was:
Party | Seats | Gains | Losses | Net gain/loss | Seats % | Votes % | Votes | +/− | |
---|---|---|---|---|---|---|---|---|---|
Labour | 11 | 2 | 1 | +1 | 73.3 | 40.6 | 9,800 | ||
Conservative | 4 | 1 | 2 | -1 | 27.7 | 34.9 | 8,418 | ||
UKIP | 0 | 0 | 0 | 0 | 0 | 16.8 | 4,047 | ||
Green | 0 | 0 | 0 | 0 | 0 | 4.6 | 1,101 | ||
Liberal Democrat | 0 | 0 | 0 | 0 | 0 | 2.5 | 592 | ||
Independent | 0 | 0 | 0 | 0 | 0 | 0.5 | 131 | ||
National Front | 0 | 0 | 0 | 0 | 0 | 0.1 | 29 | ||
Percentage change in party votes are from the last time the ward was contested. This is either 2014 or 2015.
Party | Candidate | Votes | % | ± | |
---|---|---|---|---|---|
Labour | Marlene Bennett | 981 | 53.2 | +7.6 | |
Conservative | Kat Moss | 360 | 19.5 | -8.1 | |
UKIP | Pete Twiname | 342 | 18.6 | -1.6 | |
Liberal Democrat | Henry Foulds | 91 | 4.9 | +1.5 | |
Green | Leo Swarvett | 53 | 2.9 | -0.3 | |
Rejected ballots | 15 | ||||
Majority | 621 | 33.7 | |||
Turnout | 1842 | ||||
Labour hold | Swing | ||||
Party | Candidate | Votes | % | ± | |
---|---|---|---|---|---|
Labour | Maurice Neville | 761 | 41.7 | +10.4 | |
Conservative | John Nelson | 627 | 34.4 | -8.4 | |
Green | Dave Wells | 151 | 8.3 | -4.6 | |
UKIP | John Young | 149 | 8.2 | -4.8 | |
Independent | Dave Fisher | 131 | 7.2 | +7.2 | |
Rejected ballots | 4 | ||||
Majority | 134 | 7.3 | |||
Turnout | 1823 | ||||
Labour gain from Conservative | Swing | ||||
Party | Candidate | Votes | % | ± | |
---|---|---|---|---|---|
Labour | Ben Bellamy | 662 | 37.8 | +12.7 | |
Conservative | Alan Cox | 576 | 32.9 | -9.1 | |
Green | Sue MacFarlane | 307 | 17.5 | -0.1 | |
UKIP | Dennis Smith | 160 | 9.1 | -6.2 | |
Liberal Democrat | Richard Salmon | 35 | 2.0 | +2.0 | |
Rejected ballots | 11 | ||||
Majority | 86 | 4.9 | |||
Turnout | 1751 | ||||
Labour gain from Conservative | Swing | ||||
Party | Candidate | Votes | % | ± | |
---|---|---|---|---|---|
Labour | Christopher Emmas-Williams | 702 | 53.4 | +11.5 | |
Conservative | Linda Edwards-Milsom | 337 | 25.6 | +0.8 | |
UKIP | Gaz Smith | 212 | 16.1 | -12.1 | |
Green | Jackie Blackett | 37 | 2.8 | +2.8 | |
Liberal Democrat | Fay Whitehead | 21 | 1.6 | -0.7 | |
Rejected ballots | 5 | ||||
Majority | 365 | 27.8 | |||
Turnout | 1314 | ||||
Labour hold | Swing |
Party | Candidate | Votes | % | ± | |
---|---|---|---|---|---|
Conservative | Angela Ward | 749 | 46.7 | +4.5 | |
Labour | Paul Lobley | 579 | 36.1 | +1.4 | |
UKIP | Ian Gillatt | 168 | 10.5 | -4.2 | |
Green | William MacFarlane | 69 | 4.3 | -1.1 | |
Liberal Democrat | Audrey Wootton | 36 | 2.2 | -0.8 | |
Rejected ballots | 3 | ||||
Majority | 170 | 10.6 | |||
Turnout | 1604 | ||||
Conservative hold | Swing |
Party | Candidate | Votes | % | ± | |
---|---|---|---|---|---|
Labour | Kieran Hill | 541 | 40.1 | -0.1 | |
UKIP | Geoffrey Aldwinckle | 370 | 27.4 | -6.9 | |
Conservative | Julie Whitmore | 349 | 25.9 | +3.4 | |
Green | James Brooks | 42 | 3.1 | +3.1 | |
Liberal Democrat | James Morton | 37 | 2.7 | -0.3 | |
Rejected ballots | 9 | ||||
Majority | 171 | 12.7 | |||
Turnout | 1348 | ||||
Labour hold | Swing | ||||
Party | Candidate | Votes | % | ± | |
---|---|---|---|---|---|
Labour | Sheila Oakes | 536 | 38.2 | -4.8 | |
Conservative | Mark Burrell | 425 | 30.3 | +4.3 | |
UKIP | Philip Rose | 342 | 24.4 | -3.7 | |
Green | Julie Wozniczka | 49 | 3.5 | +3.5 | |
Liberal Democrat | George White | 42 | 3.0 | 0.0 | |
Rejected ballots | 10 | ||||
Majority | 111 | 7.9 | |||
Turnout | 1404 | ||||
Labour hold | Swing | ||||
Party | Candidate | Votes | % | ± | |
---|---|---|---|---|---|
Labour | Teresa Curran | 597 | 42.2 | +1.8 | |
Conservative | Steven Grainger | 401 | 28.4 | +5.4 | |
UKIP | Chris Flude | 325 | 23.0 | -9.5 | |
Liberal Democrat | Joel Hunt | 43 | 3.0 | -1.1 | |
Green | Mike Jones | 38 | 2.7 | +2.7 | |
Rejected ballots | 10 | ||||
Majority | 196 | 13.8 | |||
Turnout | 1414 | ||||
Labour hold | Swing | ||||
Party | Candidate | Votes | % | ± | |
---|---|---|---|---|---|
Conservative | Jack Brown | 630 | 40.7 | +8.8 | |
Labour | Paul Wardle | 616 | 39.8 | -8.1 | |
UKIP | Stuart Bent | 227 | 14.7 | -3.2 | |
Green | Steve Kennedy | 37 | 2.4 | +2.4 | |
Liberal Democrat | Ollie Smith | 30 | 1.9 | -0.4 | |
Rejected ballots | 8 | ||||
Majority | 14 | 0.9 | |||
Turnout | 1548 | ||||
Conservative gain from Labour | Swing | ||||
Party | Candidate | Votes | % | ± | |
---|---|---|---|---|---|
Conservative | Charles Norman Bull | 1086 | 47.5 | -2.2 | |
Labour | Christine Venables | 691 | 30.2 | +3.0 | |
UKIP | Roy Snape | 312 | 13.6 | -1.3 | |
Green | Kate Howard | 102 | 4.5 | -0.1 | |
Liberal Democrat | Ron Welsby | 90 | 3.9 | +0.2 | |
Rejected ballots | 7 | ||||
Majority | 395 | 17.3 | |||
Turnout | 2288 | ||||
Conservative hold | Swing | ||||
Party | Candidate | Votes | % | ± | |
---|---|---|---|---|---|
Labour | Brian Gration | 486 | 43.5 | -0.1 | |
Conservative | Rosie Webster | 363 | 32.5 | +8.7 | |
UKIP | Tony Warren | 219 | 19.6 | -10.6 | |
Green | Christina Smith | 15 | 1.3 | +1.3 | |
Liberal Democrat | Ruth Thornton | 14 | 1.3 | -1.2 | |
National Front | Timothy Knowles | 14 | 1.3 | +1.3 | |
Rejected ballots | 5 | ||||
Majority | 123 | 11.0 | |||
Turnout | 1116 | ||||
Labour hold | Swing | ||||
Party | Candidate | Votes | % | ± | |
---|---|---|---|---|---|
Labour | Mick Wilson | 640 | 41.9 | +5.6 | |
Conservative | Matt Murray | 560 | 36.6 | -5.9 | |
UKIP | John Pass | 237 | 15.5 | +0.3 | |
Green | Tony Youens | 46 | 3.0 | -0.6 | |
Liberal Democrat | Clym Stock-Williams | 25 | 1.6 | -0.8 | |
National Front | Michael Sharpe | 15 | 1.0 | +1.0 | |
Rejected ballots | 5 | ||||
Majority | 80 | 5.3 | |||
Turnout | 1528 | ||||
Labour hold | Swing | ||||
Party | Candidate | Votes | % | ± | |
---|---|---|---|---|---|
Labour | Tony Holmes | 869 | 40.1 | +5.4 | |
Conservative | Sean Carter | 845 | 39.0 | -1.6 | |
UKIP | Paula Parkin | 345 | 15.9 | -2.0 | |
Green | Phil Taylor | 55 | 2.5 | -1.1 | |
Liberal Democrat | Peter Jelf | 43 | 2.0 | -1.1 | |
Rejected ballots | 8 | ||||
Majority | 24 | 1.1 | |||
Turnout | 2165 | ||||
Labour hold | Swing | ||||
Party | Candidate | Votes | % | ± | |
---|---|---|---|---|---|
Conservative | Alex Stevenson | 945 | 51.6 | +10.8 | |
Labour | Antony Tester | 404 | 22.1 | +1.7 | |
UKIP | Ade Nathan | 348 | 19.0 | -9.2 | |
Green | Matt McGuinness | 68 | 3.7 | +3.7 | |
Liberal Democrat | Kate Smith | 56 | 3.1 | -2.0 | |
Rejected ballots | 10 | ||||
Majority | 541 | 29.5 | |||
Turnout | 1831 | ||||
Conservative hold | Swing | ||||
Party | Candidate | Votes | % | ± | |
---|---|---|---|---|---|
Labour | John McCabe | 735 | 58.4 | +1.5 | |
UKIP | Paul Price | 291 | 23.1 | -1.5 | |
Conservative | Colin Boyce | 165 | 13.1 | -2.0 | |
Green | Steve Elliott | 32 | 2.5 | +2.5 | |
Liberal Democrat | Elsie Situnayake | 29 | 2.3 | -1.0 | |
Rejected ballots | 6 | ||||
Majority | 444 | 25.3 | |||
Turnout | 1258 | ||||
Labour hold | Swing | ||||
Elections to Calderdale Metropolitan Borough Council were held on 1 May 2008. One third of the council was up for election and the council stayed under no overall control with a minority Conservative administration.
Elections to Calderdale Metropolitan Borough Council were held on 4 May 2006. One third of the council was up for election and the council stayed under no overall control with a minority Conservative administration.
The 2010 Barnet Council election took place on 6 May 2010 to elect members of Barnet London Borough Council in London, England. The whole council was up for election and the Conservative party stayed in overall control of the council.
The 2010 West Lancashire Borough Council election took place on 6 May 2010 to elect members of West Lancashire Borough Council in Lancashire, England. One third of the council was up for election and the Conservative party stayed in overall control of the council.
The 2010 Pendle Borough Council election took place on 6 May 2010 to elect members of Pendle Borough Council in Lancashire, England. One third of the council was up for election and the council stayed under no overall control.
The 2007 Maidstone Borough Council election took place on 3 May 2007 to elect members of Maidstone Borough Council in Kent, England. One third of the council was up for election and the council stayed under no overall control.
The 2010 Calderdale Metropolitan Borough Council election took place on 6 May 2010 to elect members of Calderdale Metropolitan Borough Council in England. This was on the same day as other local elections and a general election. One councillor was elected in each ward for a four-year term so the councillors elected in 2010 last stood for election in 2006. Each ward is represented by three councillors, the election of which is staggered, so only one third of the councillors was elected in this election. After the election the council stayed in no overall control but the Conservative minority administration was replaced with a coalition between Labour and the Liberal Democrats.
The 2012 Calderdale Metropolitan Borough Council election took place on 3 May 2012 to elect members of Calderdale Metropolitan Borough Council in West Yorkshire, England. This was on the same day as other United Kingdom local elections, 2012. After the election the council continued to have no overall control and continue to be run by a coalition between the Labour Party and the Liberal Democrats.
The 2012 St Albans City and District Council election took place on 3 May 2012 to elect members of St Albans District Council in Hertfordshire, England. One third of the council was up for election and the council stayed under no overall control.
The 2014 St Albans City and District Council election took place on 22 May 2014 to elect members of St Albans District Council in Hertfordshire, England. One third of the council was up for election and the council stayed under no overall control.
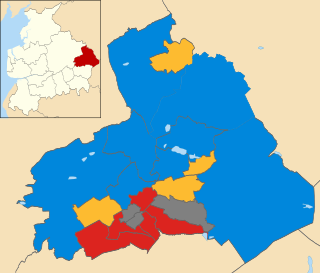
The 2011 Pendle Borough Council election took place on 5 May 2011 to elect members of Pendle Borough Council in Lancashire, England. One third of the council was up for election and the council stayed under no overall control.
The 2012 Pendle Borough Council election took place on 3 May 2012 to elect members of Pendle Borough Council in Lancashire, England. One third of the council was up for election and the council stayed under no overall control.
The 2014 Pendle Borough Council election took place on 22 May 2014 to elect members of Pendle Borough Council in Lancashire, England. One third of the council was up for election and the council stayed under no overall control.
The 2014 Castle Point Borough Council election took place on 22 May 2014 to elect members of Castle Point Borough Council in Essex, England. One third of the council was up for election and the Conservative Party lost overall control of the council to no overall control.
The 2014 Brent London Borough Council election took place on 22 May 2014 to elect members of Brent London Borough Council in London, England. The whole council was up for election and the Labour Party stayed in overall control of the council.
The 2012 Tandridge District Council election took place on 3 May 2012 to elect members of Tandridge District Council in Surrey, England. One third of the council was up for election and the Conservative party stayed in overall control of the council.
The 2015 Calderdale Metropolitan Borough Council election took place on 7 May 2015 to elect members of Calderdale in England. This was on the same day as other local elections and a general election. One councillor was elected in each ward for a four-year term so the councillors elected in 2015 last stood for election in 2011. Each ward is represented by three councillors, the election of which is staggered, so only one third of the councillors were elected in this election. Before the election there was no overall control with a minority Labour administration which was over-ruled at a Budget vote by a coalition of Conservatives & Liberal Democrats leading to a Conservative minority administration. After the election there was still no overall control & a Labour minority administration was formed again.
The 2015 Christchurch Borough Council election took place on 7 May 2015 to elect members of Christchurch Borough Council in Dorset, England. The whole council was up for election and the Conservative party stayed in overall control of the council.
The 2015 Wychavon District Council election took place on 7 May 2015 to elect members of Wychavon District Council in Worcestershire, England. The whole council was up for election and the Conservative party stayed in overall control of the council.
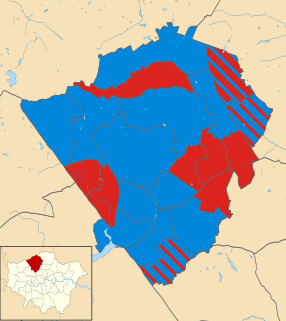
The 2018 Barnet Council election took place on 3 May 2018 to elect members of Barnet Borough Council in England. It took place on the same day as other local elections in 2018. In the last election, the Conservatives won control of the council with 32 seats, compared to 30 for Labour and 1 for the Liberal Democrats. On 15 March 2018, following the resignation of a Conservative councillor, the council was in a state of no overall control. The election on 3 May 2018 saw the Conservatives take back overall control with a majority of 13.