Amber Valley Borough Council election, 2002

Last updated

Map of the results of the 2002 Amber Valley council election. Labour in red and Conservatives in blue. Wards in grey were not contested in 2002. Amber Valley UK local election 2002 map.svg
Map of the results of the 2002 Amber Valley council election. Labour in red and Conservatives in blue. Wards in grey were not contested in 2002.

Elections to Amber Valley Borough Council were held on 2 May 2002. One third of the council was up for election and the Conservative party held overall control of the council.

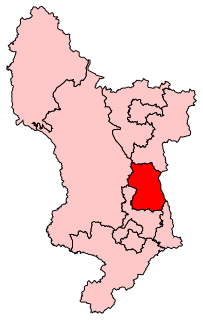
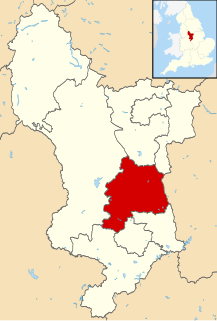
Amber Valley Borough in England

Amber Valley is a local government district and borough in Derbyshire, England. It takes its name from the River Amber and covers a semi-rural area with a number of small towns whose economy was formerly based on coal mining and engineering. The parliamentary constituency of Amber Valley covers a similar area. The Local Authority population at the 2011 Census was 122,309.

Conservative Party (UK) Political party in the United Kingdom

The Conservative Party, officially the Conservative and Unionist Party, is a centre-right political party in the United Kingdom. Presently led by Theresa May, it has been the governing party since 2010. It presently has 314 Members of Parliament in the House of Commons, 249 members of the House of Lords, and 18 members of the European Parliament. It also has 31 Members of the Scottish Parliament, 12 members of the Welsh Assembly, eight members of the London Assembly and 9,008 local councillors. One of the major parties of UK politics, it has formed the government on 45 occasions, more than any other party.

Contents

After the election, the composition of the council was

Election result

Amber Valley Local Election Result 2002
PartySeatsGainsLossesNet gain/lossSeats %Votes %Votes+/−
  Labour 12 +7 75.0 52.5 11,496
  Conservative 4 -6 25.0 37.1 8,115
  Liberal 0 0 0 5.6 1,217
  Independent 0 -1 0 4.4 955
  Green 0 0 0 0.5 107

Ward results

Alfreton
PartyCandidateVotes%±
Labour John Walker 1,023 63.1
Independent Colin Thornton 409 25.2
Liberal Paul Gibbons 188 11.6
Majority 614 37.9
Turnout 1,620
Labour gain from Independent Swing
Belper East
PartyCandidateVotes%±
Conservative Martin Tomlinson 506 46.6
Labour Nalda Boyes-Jackson 473 43.6
Green Hugh Stewart 107 9.9
Majority 33 3.0
Turnout 1,086
Conservative hold Swing
Belper South
PartyCandidateVotes%±
Conservative James Anderson 580 50.04
Labour Peter Shepherd 579 49.96
Majority 1 0.08
Turnout 1,159
Conservative hold Swing
Codnor and Waingroves
PartyCandidateVotes%±
Labour Ian Fisher 871 66.9
Conservative David Cattermole 430 33.1
Majority 441 33.8
Turnout 1,301
Labour gain from Conservative Swing
Duffield
PartyCandidateVotes%±
Conservative Christopher Short 865 60.1
Labour Patrick Mountain 574 39.9
Majority 391 20.2
Turnout 1,439
Conservative hold Swing
Heanor and Loscoe
PartyCandidateVotes%±
Labour Bob Moon 725 65.8
Conservative Christopher Jubb 376 34.2
Majority 349 31.6
Turnout 1,101
Labour hold Swing
Heanor East
PartyCandidateVotes%±
Labour Glynne Cato 548 53.8
Conservative Enid Trusswell 272 26.7
Independent Alexander Stevenson 129 12.7
Liberal Kaith Falconbridge 70 6.9
Majority 276 27.1
Turnout 1,019
Labour hold Swing
Heanor West
PartyCandidateVotes%±
Labour Paul Jones 601 47.1
Liberal Judith Wooley 413 32.3
Conservative Ruth Bulkeley-Kirkham 263 20.6
Majority 188 14.8
Turnout 1,277
Labour hold Swing
Ironville and Riddings
PartyCandidateVotes%±
Labour David Griffiths 778 58.1
Conservative George Cope 560 41.9
Majority 218 16.2
Turnout 1,338
Labour gain from Conservative Swing
Kilburn, Denby and Holbrook
PartyCandidateVotes%±
Labour John Grace 862 44.3
Conservative Alan Waner 808 41.6
Liberal Jeremy Benson 274 14.1
Majority 54 2.7
Turnout 1,944
Labour gain from Conservative Swing
Langley Mill and Aldercar
PartyCandidateVotes%±
Labour Jo Ward 504 59.2
Conservative Ann Castledine 200 23.5
Independent Denis Woolley 148 17.4
Majority 304 35.7
Turnout 852
Labour hold Swing
Ripley (2)
PartyCandidateVotes%±
Labour Charles Cutting 902
Labour Geoffrey Carlile 833
Conservative Kathleen Brown 812
Conservative Peter Clay 736
Liberal Kate Smith 272
Turnout 3,555
Labour gain from Conservative Swing
Shipley Park, Horsley and Horsley Woodhouse
PartyCandidateVotes%±
Labour Eric Lancashire 771 46.9
Conservative Linda Edward-Milson 603 36.7
Independent Margaret Jackson 269 16.4
Majority 168 10.2
Turnout 1,643
Labour gain from Conservative Swing
Somercotes
PartyCandidateVotes%±
Labour Alan Stringer 965 75.9
Conservative Geoffrey Brailsford 307 24.1
Majority 658 51.8
Turnout 1,272
Labour hold Swing
Swanwick
PartyCandidateVotes%±
Conservative Allen King 797 62.1
Labour Jonathan Harris 487 37.9
Majority 310 24.2
Turnout 1,284
Conservative hold Swing

Related Research Articles

Amber Valley (UK Parliament constituency) Parliamentary constituency in the United Kingdom

Amber Valley is a constituency, represented in the House of Commons of the UK Parliament since 2010 by Nigel Mills of the Conservative Party.

Hastings and Rye (UK Parliament constituency) Parliamentary constituency in the United Kingdom

Hastings and Rye is a constituency represented in the House of Commons of the UK Parliament since 2010 by Amber Rudd, a Conservative. Rudd has served as Work and Pensions Secretary in Theresa May's Cabinet since 2018, and served as Home Secretary from 2016 to 2018.

One third of Amber Valley Borough Council in Derbyshire, England is elected each year, followed by one year without election. Since the last boundary changes in 2000, 45 councillors have been elected from 23 wards.

The 1998 Amber Valley Borough Council election took place on 7 May 1998 to elect members of Amber Valley Borough Council in Derbyshire, England. One third of the council was up for election and the Labour party kept overall control of the council.

The 1999 Amber Valley Borough Council election took place on 6 May 1999 to elect members of Amber Valley Borough Council in Derbyshire, England. One third of the council was up for election and the Labour party stayed in overall control of the council.

2000 Amber Valley Borough Council election

The 2000 Amber Valley Borough Council election took place on 4 May 2000 to elect members of Amber Valley Borough Council in Derbyshire, England. The whole council was up for election with boundary changes since the last election in 1999 increasing the number of seats by 2. The Conservative party gained control of the council from the Labour party.

2003 Amber Valley Borough Council election

Elections to Amber Valley Borough Council were held on 1 May 2003. One third of the council was up for election and the Conservative party held overall control of the council.

2004 Amber Valley Borough Council election

Elections to Amber Valley Borough Council were held on 10 June 2004. One third of the council was up for election and the Conservative party held overall control of the council. Overall turnout was 44%.

2006 Amber Valley Borough Council election

Elections to Amber Valley Borough Council were held on 4 May 2006. One third of the council was up for election and the Conservative party held overall control of the council. Overall turnout was 34%.

2007 Amber Valley Borough Council election

Elections to Amber Valley Borough Council were held on 3 May 2007. One third of the council was up for election and the Conservative party held overall control of the council. Overall turnout was 37.7%.

2008 Amber Valley Borough Council election

Elections to Amber Valley Borough Council in Derbyshire, England were held on 1 May 2008. One third of the council was up for election and the Conservative party held overall control of the council.

1980 United Kingdom local elections

Local elections were held in the United Kingdom in 1980. These were the first annual local elections for the new Conservative Prime Minister Margaret Thatcher. Though the Conservatives in government lost seats, the projected share of the vote was close: Labour Party 42%, Conservative Party 40%, Liberal Party 13%. Labour were still being led by the former prime minister James Callaghan, who resigned later in the year to be succeeded by Michael Foot.

2010 Amber Valley Borough Council election

The 2010 Amber Valley Borough Council election took place on 6 May 2010 to elect members of Amber Valley Borough Council in Derbyshire, England. One third of the council was up for election and the Conservative party stayed in overall control of the council.

2011 Amber Valley Borough Council election

The 2011 Amber Valley Borough Council election took place on 5 May 2011 to elect members of Amber Valley Borough Council in Derbyshire, England. One third of the council was up for election and the Conservative party stayed in overall control of the council.
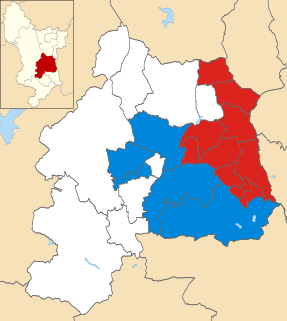
2012 Amber Valley Borough Council election

Elections to Amber Valley Borough Council in Derbyshire, England took place on Thursday 3 May 2012. One third of the council was up for election and the Conservative party held overall control of the council. Overall turnout in this election was 33.28 per cent.

2014 Amber Valley Borough Council election

The 2014 Amber Valley Borough Council election took place on 22 May 2014 to elect members of Amber Valley Borough Council in England. This was on the same day as other local elections.

2015 Amber Valley Borough Council election

The 2015 Amber Valley Borough Council election took place on 7 May 2015 to elect members of Amber Valley Borough Council in England. This was on the same day as other local elections. The Conservatives gained two seats and thereby retook control of the council.

2016 Amber Valley Borough Council election

Elections to Amber Valley Borough Council in Derbyshire, England took place on Thursday 5 May 2016. One third of the council seats were up for election and after the election the Conservative party continued to hold overall control of the council.

2018 Amber Valley Borough Council election

Elections to Amber Valley Borough Council in Derbyshire, England took place on Thursday 3 May 2018. One third of the council seats were up for election.