Elections to Amber Valley Borough Council in Derbyshire, England were held on 1 May 2008. One third of the council was up for election and the Conservative party held overall control of the council.
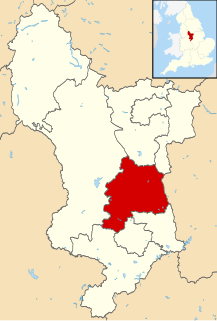
Amber Valley is a local government district and borough in Derbyshire, England. It takes its name from the River Amber and covers a semi-rural area with a number of small towns whose economy was formerly based on coal mining and engineering. The parliamentary constituency of Amber Valley covers a similar area. The Local Authority population at the 2011 Census was 122,309.
Derbyshire is a county in the East Midlands of England. A substantial portion of the Peak District National Park lies within Derbyshire, containing the southern extremity of the Pennine range of hills which extend into the north of the county. The county contains part of the National Forest, and borders on Greater Manchester to the northwest, West Yorkshire to the north, South Yorkshire to the northeast, Nottinghamshire to the east, Leicestershire to the southeast, Staffordshire to the west and southwest and Cheshire also to the west. Kinder Scout, at 636 metres (2,087 ft), is the highest point in the county, whilst Trent Meadows, where the River Trent leaves Derbyshire, is its lowest point at 27 metres (89 ft). The River Derwent is the county's longest river at 66 miles (106 km), and runs roughly north to south through the county. In 2003 the Ordnance Survey placed Church Flatts Farm at Coton in the Elms as the furthest point from the sea in Great Britain.
England is a country that is part of the United Kingdom. It shares land borders with Wales to the west and Scotland to the north-northwest. The Irish Sea lies west of England and the Celtic Sea lies to the southwest. England is separated from continental Europe by the North Sea to the east and the English Channel to the south. The country covers five-eighths of the island of Great Britain, which lies in the North Atlantic, and includes over 100 smaller islands, such as the Isles of Scilly and the Isle of Wight.
The election saw the British National Party gain two seats from the Labour party in Heanor West and Heanor East and come within one vote in Heanor and Loscoe ward. [1] The councillor for Heanor West, however, resigned from the BNP on 23 February 2012 to become an Independent.
The British National Party (BNP) is a far-right, fascist political party in the United Kingdom. It is headquartered in Wigton, Cumbria, and its current leader is Adam Walker. A minor party, it has no elected representatives at any level of UK government. Founded in 1982, the party reached its greatest level of success in the 2000s, when it had over fifty seats in local government, one seat on the London Assembly, and two Members of the European Parliament.
The Labour Party is a centre-left political party in the United Kingdom which has been described as an alliance of social democrats, democratic socialists and trade unionists. The party's platform emphasises greater state intervention, social justice and strengthening workers' rights.
Heanor is a town in the Amber Valley district of Derbyshire in the East Midlands of England. It lies 8 miles (13 km) north-east of Derby. Together with the adjacent village of Loscoe it forms the civil parish and town council-administered area of Heanor and Loscoe, which in the 2011 census had a population of 17,251.
After the election, the composition of the council was
Party | Seats | Gains | Losses | Net gain/loss | Seats % | Votes % | Votes | +/− | |
---|---|---|---|---|---|---|---|---|---|
Conservative | 9 | 1 | 0 | +1 | 60.0 | 47.8 | 11,489 | -0.7% | |
Labour | 4 | 0 | 3 | -3 | 26.7 | 32.9 | 7,916 | +3.5% | |
BNP | 2 | 2 | 0 | +2 | 13.3 | 12.2 | 2,936 | +7.4% | |
Liberal Democrat | 0 | 0 | 0 | 0 | 0 | 5.1 | 1,222 | -8.0% | |
Green | 0 | 0 | 0 | 0 | 0 | 2.1 | 494 | +0.9% |
Party | Candidate | Votes | % | ± | |
---|---|---|---|---|---|
Labour | Marlene Bennett | 872 | 48.2 | -0.3 | |
Conservative | David Cantrill | 731 | 40.4 | +14.9 | |
Liberal Democrat | Paul Gibbons | 206 | 11.4 | +1.9 | |
Majority | 141 | 7.8 | -15.2 | ||
Turnout | 1,809 | 29.1 | -4.5 | ||
Labour hold | Swing |
Party | Candidate | Votes | % | ± | |
---|---|---|---|---|---|
Conservative | John Nelson | 894 | 60.7 | +8.1 | |
Green | Dave Wells | 292 | 19.8 | +19.8 | |
Labour | Ben Hobbs | 286 | 19.4 | -12.9 | |
Majority | 602 | 40.9 | +20.6 | ||
Turnout | 1,472 | 35.2 | -0.9 | ||
Conservative hold | Swing |
Party | Candidate | Votes | % | ± | |
---|---|---|---|---|---|
Conservative | Alan Cox | 797 | 51.0 | +10.2 | |
Labour | Ben Bellamy | 286 | 18.3 | -4.7 | |
Liberal Democrat | Richard Salmon | 279 | 17.8 | -15.4 | |
Green | Colin Grimley | 202 | 12.9 | +12.9 | |
Majority | 511 | 32.7 | +28.1 | ||
Turnout | 1,564 | 38.9 | -0.7 | ||
Conservative hold | Swing |
Party | Candidate | Votes | % | ± | |
---|---|---|---|---|---|
Labour | Chris Emmas-Williams | 573 | 41.7 | -11.0 | |
Conservative | Robert Philips-Forsyth | 572 | 41.7 | +8.7 | |
BNP | Alan Warner | 228 | 16.6 | +16.6 | |
Majority | 1 | 0.01 | -19.7 | ||
Turnout | 1,373 | 34.4 | +1.4 | ||
Labour hold | Swing |
Party | Candidate | Votes | % | ± | |
---|---|---|---|---|---|
Conservative | Juliette Blake | 1,000 | 68.4 | +12.1 | |
Labour | Peter Arnold | 463 | 31.6 | +1.0 | |
Majority | 537 | 36.8 | +11.1 | ||
Turnout | 1,463 | 36.8 | -2.8 | ||
Conservative hold | Swing |
Party | Candidate | Votes | % | ± | |
---|---|---|---|---|---|
Labour | Alan Longdon | 513 | 35.6 | -7.8 | |
BNP | Paul Snell | 512 | 35.5 | +4.4 | |
Conservative | Jade Wiltshire | 417 | 28.9 | +9.5 | |
Majority | 1 | 0.1 | -12.2 | ||
Turnout | 1,442 | 35.4 | -6.6 | ||
Labour hold | Swing |
Party | Candidate | Votes | % | ± | |
---|---|---|---|---|---|
BNP | Cliff Roper | 537 | 36.5 | +36.5 | |
Conservative | Linda Edwards-Milsom | 482 | 32.7 | -3.9 | |
Labour | Kenneth Armstrong | 454 | 30.8 | -13.6 | |
Majority | 55 | 3.8 | |||
Turnout | 1,473 | 32.8 | +3.8 | ||
BNP gain from Labour | Swing | ||||
Party | Candidate | Votes | % | ± | |
---|---|---|---|---|---|
BNP | Lewis Allesbrook | 727 | 39.6 | +8.4 | |
Labour | Celia Cox | 560 | 30.5 | -1.5 | |
Conservative | Steven Grainger | 412 | 22.4 | +8.0 | |
Liberal Democrat | Sally McIntosh | 137 | 7.5 | +7.5 | |
Majority | 167 | 9.1 | |||
Turnout | 1,836 | 38.9 | -3.1 | ||
BNP gain from Labour | Swing | ||||
Party | Candidate | Votes | % | ± | |
---|---|---|---|---|---|
Conservative | Jack Brown | 900 | 58.6 | +16.1 | |
Labour | Robert Johnston | 636 | 41.4 | -3.6 | |
Majority | 264 | 17.2 | |||
Turnout | 1,536 | 33.6 | -0.4 | ||
Conservative hold | Swing |
Party | Candidate | Votes | % | ± | |
---|---|---|---|---|---|
Conservative | Norman Bull | 1,199 | 55.2 | +7.9 | |
Labour | Timothy Benson | 441 | 20.3 | -4.3 | |
Liberal Democrat | John Banks | 277 | 12.8 | +0.7 | |
BNP | Cyril Smith | 254 | 11.7 | -4.3 | |
Majority | 758 | 34.9 | +12.2 | ||
Turnout | 2,171 | 35.3 | -2.7 | ||
Conservative hold | Swing |
Party | Candidate | Votes | % | ± | |
---|---|---|---|---|---|
Conservative | Terry Thorpe | 423 | 44.3 | +8.9 | |
Labour | Eileen Hamilton | 408 | 42.8 | -5.9 | |
Liberal Democrat | Keith Falconbridge | 123 | 12.9 | +12.9 | |
Majority | 15 | 1.5 | |||
Turnout | 954 | 22.9 | -2.1 | ||
Conservative gain from Labour | Swing | ||||
Party | Candidate | Votes | % | ± | |
---|---|---|---|---|---|
Conservative | David Bowley | 1,259 | 59.8 | +16.9 | |
Labour | Charles Cutting | 646 | 30.7 | -10.4 | |
Liberal Democrat | Christopher Brown | 200 | 9.5 | -6.5 | |
Majority | 613 | 29.1 | +27.3 | ||
Turnout | 2,105 | 31.0 | -3.3 | ||
Conservative hold | Swing |
Party | Candidate | Votes | % | ± | |
---|---|---|---|---|---|
Conservative | Ron Ashton | 827 | 49.3 | +14.0 | |
Labour | Lyndsey Cox | 482 | 28.7 | -13.6 | |
BNP | Ken Cooper | 369 | 22.0 | +10.3 | |
Majority | 345 | 20.6 | +13.6 | ||
Turnout | 1,678 | 36.1 | -0.6 | ||
Conservative hold | Swing |
Party | Candidate | Votes | % | ± | |
---|---|---|---|---|---|
Conservative | Nigel Mills | 1,188 | 65.1 | +6.6 | |
Labour | Eric Lancashire | 636 | 34.9 | -6.6 | |
Majority | 552 | 30.2 | +13.2 | ||
Turnout | 1,824 | 40.0 | -2.0 | ||
Conservative hold | Swing |
Party | Candidate | Votes | % | ± | |
---|---|---|---|---|---|
Labour | John McCabe | 660 | 48.6 | -14.7 | |
Conservative | Sally West | 388 | 28.6 | -8.1 | |
BNP | John Dudley | 309 | 22.8 | +22.8 | |
Majority | 272 | 20.0 | -6.6 | ||
Turnout | 1,357 | 29.9 | +1.9 | ||
Labour hold | Swing |
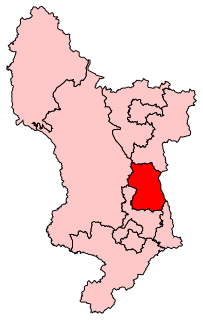
Amber Valley is a constituency, represented in the House of Commons of the UK Parliament since 2010 by Nigel Mills of the Conservative Party.
The 2008 Thurrock Council election took place on 1 May 2008 to elect members of Thurrock Council in Essex, England. One third of the council was up for election and the council stayed under no overall control.
The 2007 Thurrock Council election took place on 3 May 2007 to elect members of Thurrock Council in Essex, England. One third of the council was up for election and the Conservative party lost overall control of the council to no overall control.
Elections to Three Rivers District Council were held on 1 May 2008. One-third of the council was up for election. The Liberal Democrats won the most seats, despite the Conservatives winning more votes. The Conservatives also gained a seat, strengthening their position against the Liberal Democrats, who remained stayed in overall control of Three Rivers.
This article lists the British National Party's election results in the UK parliamentary, Scottish parliamentary and Welsh Assembly elections, as well as in the European Parliament elections and at a local level.
The 2004 Wakefield Metropolitan District Council election took place on 10 June 2004 to elect members of Wakefield Metropolitan District Council in West Yorkshire, England. The whole council was up for election with boundary changes since the last election in 2003. The Labour party stayed in overall control of the council.
The result of the Thurrock Council election, 2010 was that Thurrock Council stay under no overall control. The Conservative party gained two seats from Labour while Labour gained one seat from the Conservatives. Of the 16 wards contested, eight were won by the Conservatives and eight by Labour. The composition of the resulting council was:
Elections to Broxtowe Borough Council were held on 5 May 2011 to elect all 44 members to the Council.
The 2006 Solihull Metropolitan Borough Council election took place on 4 May 2006 to elect members of Solihull Metropolitan Borough Council in the West Midlands, England. One third of the council was up for election and the Conservative party stayed in overall control of the council.
The 2007 Solihull Metropolitan Borough Council election took place on 4 May 2007 to elect members of Solihull Metropolitan Borough Council in the West Midlands, England. One third of the council was up for election and the Conservative party lost overall control of the council to no overall control.
The 2003 Sunderland Council election took place on 1 May 2003 to elect members of Sunderland Metropolitan Borough Council in Tyne and Wear, England. One third of the council was up for election and the Labour party stayed in overall control of the council.
The 2006 Pendle Borough Council election took place on 4 May 2006 to elect members of Pendle Borough Council in Lancashire, England. One third of the council was up for election and the Liberal Democrats stayed in overall control of the council.
The 2003 Sandwell Metropolitan Borough Council election took place on 1 May 2003 to elect members of Sandwell Metropolitan Borough Council in the West Midlands, England. One third of the council was up for election and the Labour party stayed in overall control of the council.
The 2006 Sandwell Metropolitan Borough Council election took place on 4 May 2006 to elect members of Sandwell Metropolitan Borough Council in the West Midlands, England. One third of the council was up for election and the Labour party stayed in overall control of the council.
The 2007 Sandwell Metropolitan Borough Council election took place on 3 May 2007 to elect members of Sandwell Metropolitan Borough Council in the West Midlands, England. One third of the council was up for election and the Labour party stayed in overall control of the council.
The 2008 Sandwell Metropolitan Borough Council election took place on 1 May 2008 to elect members of Sandwell Metropolitan Borough Council in the West Midlands, England. One third of the council was up for election and the Labour party stayed in overall control of the council.
The 2010 Amber Valley Borough Council election took place on 6 May 2010 to elect members of Amber Valley Borough Council in Derbyshire, England. One third of the council was up for election and the Conservative party stayed in overall control of the council.
The 2011 Amber Valley Borough Council election took place on 5 May 2011 to elect members of Amber Valley Borough Council in Derbyshire, England. One third of the council was up for election and the Conservative party stayed in overall control of the council.
Elections to Three Rivers District Council were held on 3 May 2012 to elect one-third of the council of Three Rivers district in England.