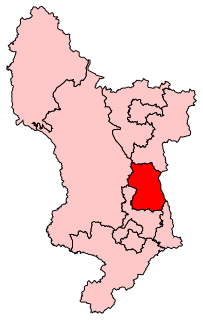
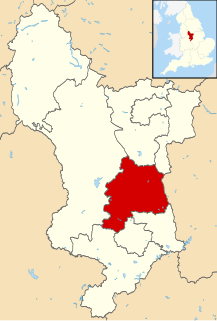
Elections to Amber Valley Borough Council were held on 4 May 2006. One third of the council was up for election and the Conservative party held overall control of the council. Overall turnout was 34%.
Amber Valley is a local government district and borough in Derbyshire, England. It takes its name from the River Amber and covers a semi-rural area with a number of small towns whose economy was formerly based on coal mining and engineering. The parliamentary constituency of Amber Valley covers a similar area. The Local Authority population at the 2011 Census was 122,309.
The Conservative Party, officially the Conservative and Unionist Party, is a centre-right political party in the United Kingdom. Presently led by Theresa May, it has been the governing party since 2010. It presently has 314 Members of Parliament in the House of Commons, 249 members of the House of Lords, and 18 members of the European Parliament. It also has 31 Members of the Scottish Parliament, 12 members of the Welsh Assembly, eight members of the London Assembly and 9,008 local councillors. One of the major parties of UK politics, it has formed the government on 45 occasions, more than any other party.
After the election, the composition of the council was
Party | Seats | Gains | Losses | Net gain/loss | Seats % | Votes % | Votes | +/− | |
---|---|---|---|---|---|---|---|---|---|
Labour | 8 | 0 | 3 | -3 | 53.3 | 39.4 | 9,361 | -3.6% | |
Conservative | 7 | 3 | 0 | +3 | 46.7 | 43.2 | 10,259 | +0.0% | |
Liberal | 0 | 0 | 0 | 0 | 0 | 11.6 | 2,758 | +1.8% | |
BNP | 0 | 0 | 0 | 0 | 0 | 4.7 | 1,116 | +2.0% | |
Green | 0 | 0 | 0 | 0 | 0 | 1.1 | 252 | +1.1% | |
Party | Candidate | Votes | % | ± | |
---|---|---|---|---|---|
Labour | John Walker | 1,044 | 55.8 | +8.5 | |
Conservative | David Wilson | 564 | 30.1 | +1.0 | |
Liberal | Paul Gibbons | 264 | 14.1 | -9.5 | |
Majority | 480 | 25.7 | +7.5 | ||
Turnout | 1,872 | 30 | -11 | ||
Labour hold | Swing | ||||
Party | Candidate | Votes | % | ± | |
---|---|---|---|---|---|
Conservative | Martin Tomlinson | 699 | 50.9 | +1.8 | |
Labour | Randall Sanders | 395 | 28.8 | -7.7 | |
Liberal | Hassan Dervish | 278 | 20.3 | +5.9 | |
Majority | 304 | 22.1 | +9.5 | ||
Turnout | 1,372 | 31 | |||
Conservative hold | Swing | ||||
Party | Candidate | Votes | % | ± | |
---|---|---|---|---|---|
Conservative | James Anderson | 529 | 43.3 | -13.0 | |
Labour | Peter Shepherd | 398 | 32.5 | -11.2 | |
Green | Colin Grimley | 163 | 13.3 | +13.3 | |
Liberal | Timothy Clark | 133 | 10.9 | +10.9 | |
Majority | 131 | 10.8 | -1.8 | ||
Turnout | 1,223 | 32 | |||
Conservative hold | Swing | ||||
Party | Candidate | Votes | % | ± | |
---|---|---|---|---|---|
Labour | Ian Fisher | 676 | 52.7 | -5.9 | |
Conservative | Roy Wildsmith | 424 | 33.0 | -8.4 | |
Liberal | Colin Murfin | 183 | 14.3 | +14.3 | |
Majority | 252 | 19.7 | +2.5 | ||
Turnout | 1,283 | 33 | -12 | ||
Labour hold | Swing | ||||
Party | Candidate | Votes | % | ± | |
---|---|---|---|---|---|
Conservative | Christopher Short | 982 | 64.9 | +7.6 | |
Liberal | Colin Thompson | 238 | 15.7 | -5.6 | |
Labour | Diana Hancock | 203 | 13.4 | -8.0 | |
Green | Karen How | 89 | 5.9 | +5.9 | |
Majority | 744 | 49.2 | +13.3 | ||
Turnout | 1,512 | 43 | -6 | ||
Conservative hold | Swing | ||||
Party | Candidate | Votes | % | ± | |
---|---|---|---|---|---|
Labour | John Moon | 731 | 43.4 | -10.5 | |
BNP | Paul Snell | 524 | 31.1 | +31.1 | |
Conservative | Jean Parry | 327 | 19.4 | -26.7 | |
Liberal | Sally Mcintosh | 103 | 6.1 | +6.1 | |
Majority | 207 | 12.3 | +4.5 | ||
Turnout | 1,685 | 41 | -1 | ||
Labour hold | Swing | ||||
Party | Candidate | Votes | % | ± | |
---|---|---|---|---|---|
Labour | Glynne Cato | 567 | 44.4 | -20.5 | |
Conservative | Linda Edwards-Milsom | 468 | 36.6 | +1.5 | |
Liberal | Gavin Sarkas-Bosman | 242 | 19.0 | +19.0 | |
Majority | 99 | 7.8 | -22.0 | ||
Turnout | 1,277 | 29 | -12 | ||
Labour hold | Swing | ||||
Party | Candidate | Votes | % | ± | |
---|---|---|---|---|---|
Labour | Paul Jones | 607 | 32.0 | -2.7 | |
BNP | Brian Edwards | 592 | 31.2 | +5.0 | |
Liberal | Judith Woolley | 427 | 22.5 | +6.2 | |
Conservative | Jade Wiltshire | 273 | 14.4 | -8.5 | |
Majority | 15 | 0.8 | -7.7 | ||
Turnout | 1,899 | 42 | -3 | ||
Labour hold | Swing | ||||
Party | Candidate | Votes | % | ± | |
---|---|---|---|---|---|
Labour | Paul Smith | 700 | 45.0 | +0.8 | |
Conservative | Patricia Bomar | 660 | 42.5 | -13.3 | |
Liberal | Gordon Monaghan | 194 | 12.5 | +12.5 | |
Majority | 40 | 2.5 | |||
Turnout | 1,554 | 34 | -8 | ||
Labour hold | Swing | ||||
Party | Candidate | Votes | % | ± | |
---|---|---|---|---|---|
Conservative | Jean Gemmell | 1,396 | 63.3 | +16.0 | |
Labour | John Grace | 811 | 36.7 | +3.2 | |
Majority | 585 | 26.6 | +12.8 | ||
Turnout | 2,207 | 36 | -11 | ||
Conservative gain from Labour | Swing | ||||
Party | Candidate | Votes | % | ± | |
---|---|---|---|---|---|
Labour | Stephanie Ward | 472 | 48.7 | -5.8 | |
Conservative | Terence Thorpe | 343 | 35.4 | +16.9 | |
Liberal | Keith Falconbridge | 154 | 15.9 | +6.9 | |
Majority | 129 | 13.3 | -22.7 | ||
Turnout | 969 | 25 | -15 | ||
Labour hold | Swing | ||||
Party | Candidate | Votes | % | ± | |
---|---|---|---|---|---|
Conservative | Elizabeth Bowley | 1,042 | 48.3 | -0.8 | |
Labour | Charles Cutting | 794 | 36.8 | +4.9 | |
Liberal | Catharine Smith | 322 | 14.9 | -4.1 | |
Majority | 248 | 11.5 | -5.7 | ||
Turnout | 2,158 | 32 | -9 | ||
Conservative gain from Labour | Swing | ||||
Party | Candidate | Votes | % | ± | |
---|---|---|---|---|---|
Conservative | Kevin Parkinson | 1,115 | 58.5 | +0.0 | |
Labour | Eric Lancashire | 790 | 41.5 | +0.0 | |
Majority | 325 | 17.0 | +0.0 | ||
Turnout | 1,905 | 42 | -8 | ||
Conservative gain from Labour | Swing | ||||
Party | Candidate | Votes | % | ± | |
---|---|---|---|---|---|
Labour | Brian Lyttle | 784 | 63.3 | +8.1 | |
Conservative | Sally West | 454 | 36.7 | +9.5 | |
Majority | 330 | 26.6 | -1.4 | ||
Turnout | 1,238 | 28 | -10 | ||
Labour hold | Swing | ||||
Party | Candidate | Votes | % | ± | |
---|---|---|---|---|---|
Conservative | Allen King | 983 | 61.7 | +5.8 | |
Labour | Michael Missett | 389 | 24.4 | -7.0 | |
Liberal | Paulette Robinson | 220 | 13.8 | +13.8 | |
Majority | 594 | 37.3 | +12.8 | ||
Turnout | 1,592 | 37 | |||
Conservative hold | Swing | ||||
Amber Valley is a constituency, represented in the House of Commons of the UK Parliament since 2010 by Nigel Mills of the Conservative Party.
One third of Amber Valley Borough Council in Derbyshire, England is elected each year, followed by one year without election. Since the last boundary changes in 2000, 45 councillors have been elected from 23 wards.
The 1998 Amber Valley Borough Council election took place on 7 May 1998 to elect members of Amber Valley Borough Council in Derbyshire, England. One third of the council was up for election and the Labour party kept overall control of the council.
The 1999 Amber Valley Borough Council election took place on 6 May 1999 to elect members of Amber Valley Borough Council in Derbyshire, England. One third of the council was up for election and the Labour party stayed in overall control of the council.
The 2000 Amber Valley Borough Council election took place on 4 May 2000 to elect members of Amber Valley Borough Council in Derbyshire, England. The whole council was up for election with boundary changes since the last election in 1999 increasing the number of seats by 2. The Conservative party gained control of the council from the Labour party.
Elections to Amber Valley Borough Council were held on 2 May 2002. One third of the council was up for election and the Conservative party held overall control of the council.
Elections to Amber Valley Borough Council were held on 1 May 2003. One third of the council was up for election and the Conservative party held overall control of the council.
Elections to Amber Valley Borough Council were held on 10 June 2004. One third of the council was up for election and the Conservative party held overall control of the council. Overall turnout was 44%.
Elections to Amber Valley Borough Council were held on 3 May 2007. One third of the council was up for election and the Conservative party held overall control of the council. Overall turnout was 37.7%.
Elections to Mole Valley Council were held on 4 May 2006. One third of the council was up for election and the Conservative party gained overall control of the council from no overall control. Overall turnout was 49.0%.
Elections to Amber Valley Borough Council in Derbyshire, England were held on 1 May 2008. One third of the council was up for election and the Conservative party held overall control of the council.
Local elections were held in the United Kingdom in 1980. These were the first annual local elections for the new Conservative Prime Minister Margaret Thatcher. Though the Conservatives in government lost seats, the projected share of the vote was close: Labour Party 42%, Conservative Party 40%, Liberal Party 13%. Labour were still being led by the former prime minister James Callaghan, who resigned later in the year to be succeeded by Michael Foot.
The 2010 Amber Valley Borough Council election took place on 6 May 2010 to elect members of Amber Valley Borough Council in Derbyshire, England. One third of the council was up for election and the Conservative party stayed in overall control of the council.
The 2011 Amber Valley Borough Council election took place on 5 May 2011 to elect members of Amber Valley Borough Council in Derbyshire, England. One third of the council was up for election and the Conservative party stayed in overall control of the council.
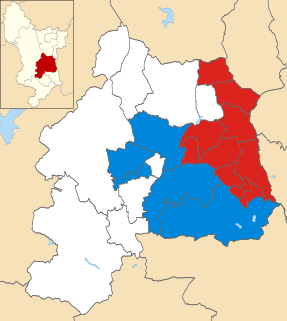
Elections to Amber Valley Borough Council in Derbyshire, England took place on Thursday 3 May 2012. One third of the council was up for election and the Conservative party held overall control of the council. Overall turnout in this election was 33.28 per cent.
The 2014 Amber Valley Borough Council election took place on 22 May 2014 to elect members of Amber Valley Borough Council in England. This was on the same day as other local elections.
The 2015 Amber Valley Borough Council election took place on 7 May 2015 to elect members of Amber Valley Borough Council in England. This was on the same day as other local elections. The Conservatives gained two seats and thereby retook control of the council.
Elections to Amber Valley Borough Council in Derbyshire, England took place on Thursday 5 May 2016. One third of the council seats were up for election and after the election the Conservative party continued to hold overall control of the council.
The 2018 Derby City Council election took place on 3 May 2018 to elect members of Derby City Council in England. This was on the same day as other local elections. The Labour group on the council suffered losses of both the Council Leader Ranjit Banwait and the mayor John Whitby, as well as then cabinet member Sara Bolton, who lost by over 1,000 votes to Conservative Rob Cooper. Labour lost its overall majority on the council, and a Conservative minority administration was formed with Liberal Democrat and UKIP backing.