West Oxfordshire District Council election, 2006

Last updated
Map of the results of the 2006 West Oxfordshire District Council election. Conservatives in blue, Liberal Democrats in yellow and independent in light grey. Wards in dark grey were not contested in 2006. West Oxfordshire UK local election 2006 map.svg
Map of the results of the 2006 West Oxfordshire District Council election. Conservatives in blue, Liberal Democrats in yellow and independent in light grey. Wards in dark grey were not contested in 2006.

The 2006 West Oxfordshire District Council election took place on 4 May 2006 to elect members of West Oxfordshire District Council in Oxfordshire, England. One third of the council was up for election and the Conservative party stayed in overall control of the council. [1]

West Oxfordshire Non-metropolitan district in England

West Oxfordshire is a local government district in northwest Oxfordshire, England, including towns such as Woodstock, Burford, Chipping Norton, Charlbury, Carterton and Witney, where the council is based.

Non-metropolitan district Type of local government district in England

Non-metropolitan districts, or colloquially "shire districts", are a type of local government district in England. As created, they are sub-divisions of non-metropolitan counties in a two-tier arrangement.

Oxfordshire County of England

Oxfordshire is a county in South East England. The ceremonial county borders Warwickshire to the north-west, Northamptonshire to the north-east, Buckinghamshire to the east, Berkshire to the south, Wiltshire to the south-west and Gloucestershire to the west.

Contents

After the election, the composition of the council was

Conservative Party (UK) Political party in the United Kingdom

The Conservative Party, officially the Conservative and Unionist Party, is a centre-right political party in the United Kingdom. The governing party since 2010, it is the largest in the House of Commons, with 313 Members of Parliament, and also has 249 members of the House of Lords, 18 members of the European Parliament, 31 Members of the Scottish Parliament, 12 members of the Welsh Assembly, eight members of the London Assembly and 8,916 local councillors.

Liberal Democrats (UK) Political party in the United Kingdom

The Liberal Democrats are a liberal political party in the United Kingdom. It is currently led by Vince Cable. They have 11 Members of Parliament in the House of Commons, 96 members of the House of Lords, one member of the European Parliament, five Members of the Scottish Parliament and one member in the Welsh Assembly and London Assembly. At the height of its influence, the party formed a coalition government with the Conservative Party from 2010 to 2015 with its leader Nick Clegg serving as Deputy Prime Minister.

The Labour Party is a centre-left political party in the United Kingdom that has been described as an alliance of social democrats, democratic socialists and trade unionists. The party's platform emphasises greater state intervention, social justice and strengthening workers' rights.

Background

After the last election in 2004 the Conservatives controlled the council with 29 councillors, while the Liberal Democrats had 13 seats, independents had six and the Labour party had one seat. [3] However, in April 2005 Conservative councillor Peter Green resigned from the party to sit as an independent, meaning that going into the 2006 election the Conservatives had 28 seats and there were 7 independents. [4] [5]

A Councillor is a member of a local government council.

For the 16 seats contested in 2006, the Conservatives had 16 candidates, Labour 13, Liberal Democrats 11, Green party 7 and there were 3 independents. [6]

Green Party of England and Wales Political party in England and Wales

The Green Party of England and Wales is a green, left-wing political party in England and Wales. Headquartered in London, since September 2018, its co-leaders are Siân Berry and Jonathan Bartley. The Green Party has one representative in the House of Commons, one in the House of Lords, and three in the European Parliament. In addition, it has various councillors in UK local government and two members of the London Assembly.

Election result

The Conservatives increased their majority on the council after gaining six seats to take 14 of the 16 seats contested. [5] This took the Conservatives to 34 councillors and came at the expense of the Liberal Democrats, who lost four seats, and the independents who lost two seats. [5] The Liberal Democrats were therefore reduced to nine councillors and the independents to five, while Labour remained with a single councillor. [5] Of the 10 councillors who sought re-election, nine were successful, with only Liberal Democrat Julian Cooper losing in Woodstock and Bladon ward by 34 votes to Conservative candidate Jill Dunsmore. [6] Overall turnout at the election was 40.25%. [6]

Woodstock, Oxfordshire town and civil parish in West Oxfordshire, northwest of Oxford

Woodstock is a market town and civil parish 8 miles (13 km) northwest of Oxford in Oxfordshire, England. The 2011 Census recorded the parish population as 3,100.

Bladon village and civil parish on the River Glyme in West Oxfordshire, England

Bladon is a village and civil parish on the River Glyme about 6 12 miles (10.5 km) northwest of Oxford, Oxfordshire, England, notable as the burial place of Sir Winston Churchill. The 2011 Census recorded the parish's population as 898.

The wards and electoral divisions in the United Kingdom are electoral districts at sub-national level represented by one or more councillors. The ward is the primary unit of English electoral geography for civil parishes and borough and district councils, electoral ward is the unit used by Welsh principal councils, while the electoral division is the unit used by English county councils and some unitary authorities. Each ward/division has an average electorate of about 5,500 people, but ward-population counts can vary substantially. As at the end of 2014 there were 9,456 electoral wards/divisions in the UK.

West Oxfordshire local election result 2006 [6]
PartySeatsGainsLossesNet gain/lossSeats %Votes %Votes+/−
  Conservative 1460+687.559.611,471+13.1%
  Liberal Democrat 104-46.320.03,850-10.4%
  Independent 102-26.36.61,273+0.8%
  Labour 000009.31,793-0.9%
  Green 000004.5866-2.6%

Ward results

Ascott and Shipton [6]
PartyCandidateVotes%±
Conservative Hilary Hibbert-Biles64978.6+21.2
Labour John Gittings9211.1+11.1
Liberal Democrat John Miller8510.3+10.3
Majority55767.4+52.6
Turnout 82650.3+3.2
Conservative hold Swing
Bampton and Clanfield [6]
PartyCandidateVotes%±
Independent Martin Barrett85657.6+57.6
Conservative Frederick Gray55837.5-15.9
Labour Mark Albert734.9+4.9
Majority29820.0
Turnout 1,48751.9+13.5
Independent hold Swing
Brize Norton and Shilton [6]
PartyCandidateVotes%±
Conservative Verena Hunt49076.3
Independent Shane Rae12018.7
Labour Duncan Enright325.0
Majority37057.6
Turnout 64243.0
Conservative hold Swing
Burford [6]
PartyCandidateVotes%±
Conservative Derek Cotterill55679.8+36.3
Liberal Democrat John Lilly10414.9+14.9
Labour Matthew Deans375.3+5.3
Majority45264.8
Turnout 69750.0+2.7
Conservative gain from Independent Swing
Carterton North East [6]
PartyCandidateVotes%±
Conservative Reginald Mason48662.1-8.5
Independent Paul Wesson29737.9+37.9
Majority18924.1-17.0
Turnout 78325.3+7.9
Conservative hold Swing
Carterton North West [6]
PartyCandidateVotes%±
Conservative David King84683.8+29.5
Labour Raymond Harris16316.2+4.6
Majority68367.7+47.6
Turnout 1,00931.2+4.7
Conservative hold Swing
Carterton South [6]
PartyCandidateVotes%±
Conservative Windell Walcott89281.2+31.8
Liberal Democrat Peter Madden20618.8-23.0
Majority68662.5+54.9
Turnout 1,09834.9+6.4
Conservative hold Swing
Chipping Norton [6]
PartyCandidateVotes%±
Conservative Robert Townley1,19861.0+12.0
Labour Robert Evans53327.2+2.9
Liberal Democrat Elizabeth Allen1387.0-11.4
Green Brian Luney944.8-3.5
Majority66533.9+9.2
Turnout 1,96342.8-1.3
Conservative gain from Independent Swing
Ducklington [6]
PartyCandidateVotes%±
Conservative Stephen Hayward44367.1+13.6
Labour William Tumbridge9113.8-8.8
Liberal Democrat Gillian Workman7611.5-12.4
Green Richard Dossett-Davies507.6+7.6
Majority35253.3+23.6
Turnout 66041.4+5.6
Conservative hold Swing
Eynsham and Cassington [6]
PartyCandidateVotes%±
Conservative Frances Pike86745.6+10.9
Liberal Democrat Richard Andrews76340.2-14.6
Green Xanthe Bevis1608.4-2.1
Labour Richard Kelsall1105.8+5.8
Majority1045.5
Turnout 1,90042.2-0.8
Conservative gain from Liberal Democrat Swing
Freeland and Hanborough [6]
PartyCandidateVotes%±
Conservative Colin Dingwall73248.9+4.8
Liberal Democrat Michael Baggaley60440.4-15.5
Green Jill Jones1006.7+6.7
Labour Georgina Burrows604.0+4.0
Majority1288.6
Turnout 1,49645.7-6.4
Conservative gain from Liberal Democrat Swing
Standlake, Aston and Stanton Harcourt [6]
PartyCandidateVotes%±
Liberal Democrat Brenda Smith77951.7+0.0
Conservative Elizabeth Fenton72948.3+0.0
Majority503.3-0.2
Turnout 1,50847.6-4.5
Liberal Democrat hold Swing
The Bartons [6]
PartyCandidateVotes%±
Conservative William Goffe47480.7
Labour Colin Carritt11319.3
Majority36161.5
Turnout 58738.0
Conservative hold Swing
Witney East [6]
PartyCandidateVotes%±
Conservative James Mills95960.9+11.5
Liberal Democrat Paul Slamin27517.5-6.2
Green Enid Dossett-Davies21713.8-1.4
Labour David Wesson1237.8-4.0
Majority68443.5+17.8
Turnout 1,57434.2-4.1
Conservative gain from Liberal Democrat Swing
Witney South [6]
PartyCandidateVotes%±
Conservative Anthony Harvey94460.9+8.2
Labour Phillip Edney24615.9-3.4
Liberal Democrat Michelle Coulson20613.3-3.9
Green Sandra Simpson1539.9-0.9
Majority69845.1+11.8
Turnout 1,54934.2-2.1
Conservative hold Swing
Woodstock and Bladon [6]
PartyCandidateVotes%±
Conservative Jill Dunsmore64844.0+0.1
Liberal Democrat Julian Cooper61441.7+7.3
Labour Susan Roberts1208.1-5.0
Green Paul Creighton926.2-2.5
Majority342.3-7.3
Turnout 1,47449.1-4.6
Conservative gain from Liberal Democrat Swing

By-elections between 2006 and 2007

A by-election was held in Witney Central on 25 January 2007 after the disappearance of Conservative councillor Andrew Creery. [7] The seat was held for Conservatives by Colin Adams with a majority of 210 votes over Liberal Democrat Brenda Churchill. [7]

By-elections, also spelled bye-elections, are used to fill elected offices that have become vacant between general elections.

Witney town and civil parish in West Oxfordshire, England

Witney is a historic market town on the River Windrush, 12 miles (19 km) west of Oxford in Oxfordshire, England.

Witney Central by-election 25 January 2007 [6]
PartyCandidateVotes%±
Conservative Colin Adams41753.5+10.6
Liberal Democrat Brenda Churchill20726.6+8.8
Labour David Wesson8711.2-16.5
Green Sandra Simpson688.7-2.9
Majority21027.0+11.9
Turnout 77925.1-16.0
Conservative hold Swing

Related Research Articles

2003 St Helens Metropolitan Borough Council election

The 2003 St Helens Metropolitan Borough Council election took place on 1 May 2003 to elect members of St Helens Metropolitan Borough Council in Merseyside, England. One third of the council was up for election and the Labour party stayed in overall control of the council.

The 1999 Craven District Council election took place on 6 May 1999 to elect members of Craven District Council in North Yorkshire, England. One third of the council was up for election and the Conservative party gained overall control of the council from no overall control.

The 2000 Craven District Council election took place on 4 May 2000 to elect members of Craven District Council in North Yorkshire, England. One third of the council was up for election and the Conservative party stayed in overall control of the council.

2004 Craven District Council election

The 2004 Craven District Council election took place on 10 June 2004 to elect members of Craven District Council in North Yorkshire, England. One third of the council was up for election and the council stayed under no overall control.

2003 Harlow District Council election

The 2003 Harlow District Council election took place on 1 May 2003 to elect members of Harlow District Council in Essex, England. One third of the council was up for election and the council stayed under no overall control.
2006 St Albans City and District Council election

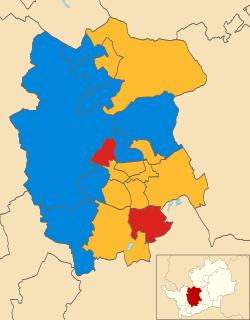
The 2006 St Albans City and District Council election took place on 4 May 2006 to elect members of St Albans District Council in Hertfordshire, England. One third of the council was up for election and the Liberal Democrats gained overall control of the council from no overall control.

2007 St Albans City and District Council election

The 2007 St Albans City and District Council election took place on 3 May 2007 to elect members of St Albans District Council in Hertfordshire, England. One third of the council was up for election and the Liberal Democrats lost overall control of the council to no overall control.
2003 Wychavon District Council election

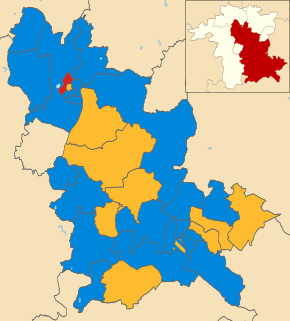
The 2003 Wychavon District Council election took place on 1 May 2003 to elect members of Wychavon District Council in Worcestershire, England. The whole council was up for election with boundary changes since the last election in 1999 reducing the number of seats by four. The Conservative party stayed in overall control of the council.

The 1998 West Oxfordshire District Council election took place on 7 May 1998 to elect members of West Oxfordshire District Council in Oxfordshire, England. One third of the council was up for election and the council stayed under no overall control.

The 2000 West Oxfordshire District Council election took place on 4 May 2000 to elect members of West Oxfordshire District Council in Oxfordshire, England. One third of the council was up for election and the Conservative party gained overall control of the council from no overall control.
2002 West Oxfordshire District Council election

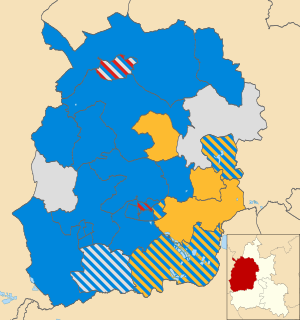
The 2002 West Oxfordshire District Council election took place on 2 May 2002 to elect members of West Oxfordshire District Council in Oxfordshire, England. The whole council was up for election with boundary changes since the last election in 2000. The Conservative party stayed in overall control of the council.

2003 West Oxfordshire District Council election

The 2003 West Oxfordshire District Council election took place on 1 May 2003 to elect members of West Oxfordshire District Council in Oxfordshire, England. One third of the council was up for election and the Conservative party stayed in overall control of the council.

2004 West Oxfordshire District Council election

The 2004 West Oxfordshire District Council election took place on 10 June 2004 to elect members of West Oxfordshire District Council in Oxfordshire, England. One third of the council was up for election and the Conservative party stayed in overall control of the council.

2007 West Oxfordshire District Council election

The 2007 West Oxfordshire District Council election took place on 3 May 2007 to elect members of West Oxfordshire District Council in Oxfordshire, England. One third of the council was up for election and the Conservative party stayed in overall control of the council.

2008 West Oxfordshire District Council election

The 2008 West Oxfordshire District Council election took place on 1 May 2008 to elect members of West Oxfordshire District Council in Oxfordshire, England. One third of the council was up for election and the Conservative party stayed in overall control of the council.

2010 West Oxfordshire District Council election

The 2010 West Oxfordshire District Council election took place on 6 May 2010 to elect members of West Oxfordshire District Council in Oxfordshire, England. One third of the council was up for election and the Conservative party stayed in overall control of the council.

2011 West Oxfordshire District Council election

The 2011 West Oxfordshire District Council election took place on 5 May 2011 to elect members of West Oxfordshire District Council in Oxfordshire, England. One third of the council was up for election and the Conservative party stayed in overall control of the council.

2012 West Oxfordshire District Council election

The 2012 West Oxfordshire District Council election took place on 3 May 2012 to elect members of West Oxfordshire District Council in Oxfordshire, England. One third of the council was up for election and the Conservative party stayed in overall control of the council.

2014 West Oxfordshire District Council election

The 2014 West Oxfordshire District Council election took place on 22 May 2014 to elect members of West Oxfordshire District Council in Oxfordshire, England. One third of the council was up for election and the Conservative party stayed in overall control of the council.

2015 West Oxfordshire District Council election

The 2015 West Oxfordshire District Council election took place on 22 May 2015 to elect members of West Oxfordshire District Council in Oxfordshire, England. One third of the council was up for election and the Conservative party stayed in overall control of the council.

References

  1. "UK local election results". Financial Times . NewsBank. 5 May 2006.
  2. "Local elections: West Oxfordshire". BBC News Online. 5 May 2006. Retrieved 11 August 2015.
  3. "West Oxfordshire council". BBC News Online. 11 June 2004. Retrieved 12 August 2015.
  4. "Mayor goes independent". Oxfordshire County Publications. NewsBank. 6 April 2005.
  5. 1 2 3 4 "Turnout high for elections". Worcestershire, West Midlands, Herefordshire, and Shropshire Counties Publications. NewsBank. 11 May 2006.
  6. 1 2 3 4 5 6 7 8 9 10 11 12 13 14 15 16 17 18 19 20 21 "West Oxfordshire District Council Election Results 1998 - 2010" (PDF). West Oxfordshire District Council. Retrieved 11 August 2015.
  7. 1 2 "Tory takes over missing man's seat". Oxfordshire County Publications. NewsBank. 26 January 2007.