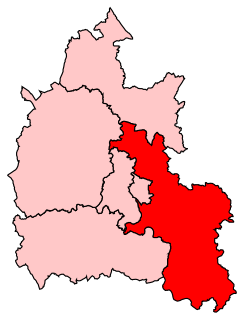
The 2004 Cherwell District Council election took place on 10 June 2004 to elect members of Cherwell District Council in Oxfordshire, England. One third of the council was up for election and the Conservative party stayed in overall control of the council. [1]
Non-metropolitan districts, or colloquially "shire districts", are a type of local government district in England. As created, they are sub-divisions of non-metropolitan counties in a two-tier arrangement.
Oxfordshire is a county in South East England. The ceremonial county borders Warwickshire to the north-west, Northamptonshire to the north-east, Buckinghamshire to the east, Berkshire to the south, Wiltshire to the south-west and Gloucestershire to the west.
England is a country that is part of the United Kingdom. It shares land borders with Wales to the west and Scotland to the north-northwest. The Irish Sea lies west of England and the Celtic Sea lies to the southwest. England is separated from continental Europe by the North Sea to the east and the English Channel to the south. The country covers five-eighths of the island of Great Britain, which lies in the North Atlantic, and includes over 100 smaller islands, such as the Isles of Scilly and the Isle of Wight.
After the election, the composition of the council was
Party | Seats | Gains | Losses | Net gain/loss | Seats % | Votes % | Votes | +/− | |
---|---|---|---|---|---|---|---|---|---|
Conservative | 14 | 2 | 0 | +2 | 87.5 | 57.1 | 14,099 | +9.4% | |
Labour | 2 | 0 | 2 | -2 | 12.5 | 24.2 | 5,982 | -1.2% | |
Liberal Democrat | 0 | 0 | 0 | 0 | 0 | 17.1 | 4,220 | -6.7% | |
National Front | 0 | 0 | 0 | 0 | 0 | 0.9 | 231 | +0.2% | |
Green | 0 | 0 | 0 | 0 | 0 | 0.6 | 152 | -0.2% |
Party | Candidate | Votes | % | ± | |
---|---|---|---|---|---|
Conservative | John Harper | 637 | 61.4 | ||
Liberal Democrat | Ian Thomas | 401 | 38.6 | ||
Majority | 236 | 22.8 | |||
Turnout | 1,038 | ||||
Conservative hold | Swing |
Party | Candidate | Votes | % | ± | |
---|---|---|---|---|---|
Conservative | Charles Blackwell | 1,511 | 69.3 | +21.4 | |
Labour | Royston Mold | 668 | 30.7 | +12.0 | |
Majority | 843 | 38.6 | +9.4 | ||
Turnout | 2,179 | ||||
Conservative hold | Swing |
Party | Candidate | Votes | % | ± | |
---|---|---|---|---|---|
Conservative | Carole Bonner | 1,099 | 57.1 | +6.4 | |
Labour | Neil Mepham | 827 | 42.9 | -6.4 | |
Majority | 272 | 14.2 | +12.8 | ||
Turnout | 1,926 | ||||
Conservative gain from Labour | Swing | ||||
Party | Candidate | Votes | % | ± | |
---|---|---|---|---|---|
Conservative | John Donaldson | 819 | 66.1 | +5.7 | |
Labour | Martin Weir | 420 | 33.9 | -5.7 | |
Majority | 399 | 32.2 | +11.4 | ||
Turnout | 1,239 | ||||
Conservative hold | Swing |
Party | Candidate | Votes | % | ± | |
---|---|---|---|---|---|
Labour | Surinder Dhesi | 656 | 55.3 | ||
Conservative | Wendy Moore | 530 | 44.7 | ||
Majority | 126 | 10.6 | |||
Turnout | 1,186 | ||||
Labour hold | Swing |
Party | Candidate | Votes | % | ± | |
---|---|---|---|---|---|
Labour | Patrick Cartledge | 883 | 53.6 | +2.7 | |
Conservative | Keith Strangwood | 763 | 46.4 | -2.7 | |
Majority | 120 | 7.2 | +5.4 | ||
Turnout | 1,646 | ||||
Labour hold | Swing |
Party | Candidate | Votes | % | ± | |
---|---|---|---|---|---|
Conservative | Ajit Bhart | 755 | 55.6 | +12.8 | |
Labour | John Broad | 603 | 44.4 | -2.2 | |
Majority | 152 | 11.2 | |||
Turnout | 1,358 | ||||
Conservative hold | Swing |
Party | Candidate | Votes | % | ± | |
---|---|---|---|---|---|
Conservative | Lynn Pratt | 957 | 64.2 | +6.8 | |
Liberal Democrat | Stephen Creed | 533 | 35.8 | +20.9 | |
Majority | 424 | 28.4 | -1.2 | ||
Turnout | 1,490 | ||||
Conservative hold | Swing |
Party | Candidate | Votes | % | ± | |
---|---|---|---|---|---|
Conservative | Daniel Sames | 688 | 55.0 | +12.4 | |
Liberal Democrat | Nicholas Cotter | 564 | 45.0 | +4.3 | |
Majority | 124 | 10.0 | +8.1 | ||
Turnout | 1,252 | ||||
Conservative hold | Swing |
Party | Candidate | Votes | % | ± | |
---|---|---|---|---|---|
Conservative | Deborah Pickford | 852 | 63.3 | +11.0 | |
Labour | Nicholas Cherry | 494 | 36.7 | +5.1 | |
Majority | 358 | 26.6 | +5.9 | ||
Turnout | 1,346 | ||||
Conservative hold | Swing |
Party | Candidate | Votes | % | ± | |
---|---|---|---|---|---|
Conservative | Russell Hurle | 1,144 | 57.4 | +18.8 | |
Labour | Alan Hasted | 618 | 31.0 | -12.3 | |
National Front | James Starkey | 231 | 11.6 | +3.7 | |
Majority | 526 | 26.4 | |||
Turnout | 1,993 | ||||
Conservative hold | Swing |
Party | Candidate | Votes | % | ± | |
---|---|---|---|---|---|
Conservative | Lynda Smart | 1,310 | 63.2 | ||
Liberal Democrat | Peter Davies | 763 | 36.8 | ||
Majority | 547 | 26.4 | |||
Turnout | 2,073 | ||||
Conservative hold | Swing |
Party | Candidate | Votes | % | ± | |
---|---|---|---|---|---|
Conservative | Catherine Fulljames | 505 | 71.6 | -3.4 | |
Liberal Democrat | Andrew Murray | 200 | 28.4 | +15.1 | |
Majority | 305 | 43.2 | -18.5 | ||
Turnout | 769 | ||||
Conservative hold | Swing |
Party | Candidate | Votes | % | ± | |
---|---|---|---|---|---|
Conservative | Maurice Billington | 1,004 | 38.0 | +9.5 | |
Liberal Democrat | Devena Rae | 833 | 31.5 | -2.4 | |
Labour | Robert Laynes | 656 | 24.8 | -12.8 | |
Green | Janet Warren | 152 | 5.7 | +5.7 | |
Majority | 171 | 6.5 | |||
Turnout | 2,645 | ||||
Conservative gain from Labour | Swing | ||||
Party | Candidate | Votes | % | ± | |
---|---|---|---|---|---|
Conservative | David Hughes | 740 | 78.4 | +1.4 | |
Liberal Democrat | Neil Walton | 204 | 21.6 | -1.4 | |
Majority | 536 | 56.8 | +2.8 | ||
Turnout | 944 | ||||
Conservative hold | Swing |
Party | Candidate | Votes | % | ± | |
---|---|---|---|---|---|
Conservative | Maureen Hastings | 785 | 47.2 | +7.5 | |
Liberal Democrat | Brendan Morrison | 722 | 43.4 | -11.8 | |
Labour | Joyce Ruiz | 157 | 9.4 | +9.4 | |
Majority | 63 | 3.8 | |||
Turnout | 1,664 | ||||
Conservative hold | Swing |
Henley is a constituency in Oxfordshire represented in the House of Commons of the UK Parliament since 2008 by John Howell, a member of the Conservative Party.
Banbury is a constituency in Oxfordshire created in 1553 and represented in the House of Commons of the UK Parliament since 2015 by Victoria Prentis of the Conservative Party. The constituency is occasionally, but erroneously, referred to as the North Oxfordshire constituency.
Witney is a county constituency in Oxfordshire represented in the House of Commons of the Parliament of the United Kingdom. It elects one Member of Parliament (MP) by the first-past-the-post system of election, and was created for the 1983 general election. It is a safe Conservative Party seat.
One third of Cherwell District Council in Oxfordshire, England is elected each year, followed by one year without election. Since the last boundary changes in 2002, 50 councillors have been elected from 28 wards.
The 2004 West Lancashire District Council election took place on 10 June 2004 to elect members of West Lancashire District Council in Lancashire, England. One third of the council was up for election and the Conservative party stayed in overall control of the council.
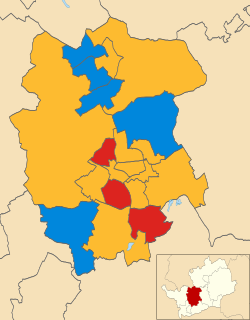
The 2004 South Lakeland District Council election took place on 10 June 2004 to elect members of South Lakeland District Council in Cumbria, England. One third of the council was up for election and the council stayed under no overall control.
The 1998 Cherwell District Council election took place on 7 May 1998 to elect members of Cherwell District Council in Oxfordshire, England. One third of the council was up for election and the council stayed under no overall control.
The 1999 Cherwell District Council election took place on 6 May 1999 to elect members of Cherwell District Council in Oxfordshire, England. One third of the council was up for election and the council stayed under no overall control.
The 2000 Cherwell District Council election took place on 4 May 2000 to elect members of Cherwell District Council in Oxfordshire, England. One third of the council was up for election and the Conservative party gained overall control of the council from no overall control.
The 2002 Cherwell District Council election took place on 2 May 2002 to elect members of Cherwell District Council in Oxfordshire, England. The whole council was up for election with boundary changes since the last election in 2000 reducing the number of seats by 2. The Conservative party stayed in overall control of the council.
The 2003 Cherwell District Council election took place on 1 May 2003 to elect members of Cherwell District Council in Oxfordshire, England. One third of the council was up for election and the Conservative party stayed in overall control of the council.
The 2006 Cherwell District Council election took place on 4 May 2006 to elect members of Cherwell District Council in Oxfordshire, England. One third of the council was up for election and the Conservative party stayed in overall control of the council.
The 2007 Cherwell District Council election took place on 3 May 2007 to elect members of Cherwell District Council in Oxfordshire, England. One third of the council was up for election and the Conservative party stayed in overall control of the council.
The 2008 Cherwell District Council election took place on 1 May 2008 to elect members of Cherwell District Council in Oxfordshire, England. One third of the council was up for election and the Conservative party stayed in overall control of the council.
The 2003 St Albans City and District Council election took place on 1 May 2003 to elect members of St Albans District Council in Hertfordshire, England. One third of the council was up for election and the council stayed under no overall control.
The 2004 St Albans City and District Council election took place on 10 June 2004 to elect members of St Albans District Council in Hertfordshire, England. One third of the council was up for election and the council stayed under no overall control.
The 2004 Wyre Forest District Council election took place on 10 June 2004 to elect members of Wyre Forest District Council in Worcestershire, England. The whole council was up for election with boundary changes since the last election in 2003. The council stayed under no overall control, but with the Conservatives taking over as the largest party on the council from the Health Concern party.
The 2011 Cherwell District Council election took place on 5 May 2011 to elect members of Cherwell District Council in Oxfordshire, England. One third of the council was up for election and the Conservative party stayed in overall control of the council.
The 2014 Cherwell District Council election took place on 22 May 2014 to elect members of Cherwell District Council in England. This was on the same day as other local elections.
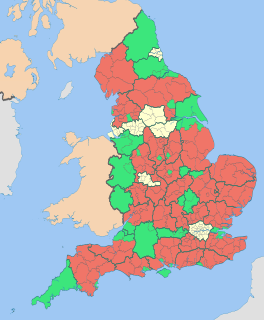
The 2018 Cherwell District Council election was held on 3 May 2018 to elect members of Cherwell District Council in England. This was on the same day as other local elections.