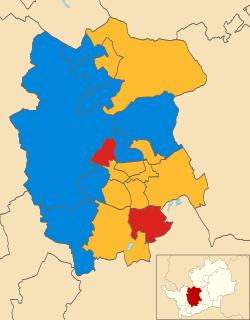
The 2000 Cherwell District Council election took place on 4 May 2000 to elect members of Cherwell District Council in Oxfordshire, England. One third of the council was up for election and the Conservative party gained overall control of the council from no overall control. [1]
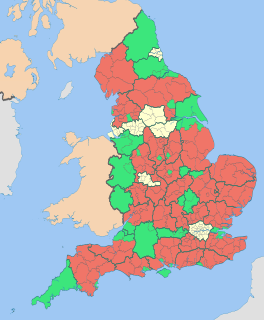
Non-metropolitan districts, or colloquially "shire districts", are a type of local government district in England. As created, they are sub-divisions of non-metropolitan counties in a two-tier arrangement.
Oxfordshire is a county in South East England. The ceremonial county borders Warwickshire to the north-west, Northamptonshire to the north-east, Buckinghamshire to the east, Berkshire to the south, Wiltshire to the south-west and Gloucestershire to the west.
England is a country that is part of the United Kingdom. It shares land borders with Wales to the west and Scotland to the north-northwest. The Irish Sea lies west of England and the Celtic Sea lies to the southwest. England is separated from continental Europe by the North Sea to the east and the English Channel to the south. The country covers five-eighths of the island of Great Britain, which lies in the North Atlantic, and includes over 100 smaller islands, such as the Isles of Scilly and the Isle of Wight.
The results saw the Conservatives gain 7 seats, 6 of them from the Labour party, to win a majority on the council for the first time since 1995. [2] Conservative gains came mainly in the Banbury and Bicester areas, with the biggest name Labour councillor to lose in the election being the former mayor, John Hanna. [3] One of the Conservative winners in the election was Mary Young, who won in South East Kidlington ward to become a councillor for the first time at the age of 81. [4] Turnout in the election varied from a high of 53% in Ruscote to a low of 11% in Neithrop. [3]
The Labour Party is a centre-left political party in the United Kingdom which has been described as an alliance of social democrats, democratic socialists and trade unionists. The party's platform emphasises greater state intervention, social justice and strengthening workers' rights.
Banbury is a historic market town on the River Cherwell in Oxfordshire, England. The town is situated 64 miles (103 km) northwest of London, 37 miles (60 km) southeast of Birmingham, 25 miles (40 km) south-by-southeast of Coventry and 22 miles (35 km) north-by-northwest of the county town of Oxford. It had a population of 46,853 at the 2011 census.
Bicester is a town and civil parish in the Cherwell district of northeastern Oxfordshire in England.
After the election, the composition of the council was
The Conservative Party, officially the Conservative and Unionist Party, is a centre-right political party in the United Kingdom. Presently led by Theresa May, it has been the governing party since 2010. It presently has 314 Members of Parliament in the House of Commons, 249 members of the House of Lords, and 18 members of the European Parliament. It also has 31 Members of the Scottish Parliament, 12 members of the Welsh Assembly, eight members of the London Assembly and 9,008 local councillors. One of the major parties of UK politics, it has formed the government on 45 occasions, more than any other party.
The Liberal Democrats are a liberal political party in the United Kingdom. They presently have 11 Members of Parliament in the House of Commons, 96 members of the House of Lords, and one member of the European Parliament. They also have five Members of the Scottish Parliament and a member each in the Welsh Assembly and London Assembly. The party reached the height of its influence in the early 2010s, forming a junior partner in a coalition government from 2010 to 2015. It is presently led by Vince Cable.
Party | Seats | Gains | Losses | Net gain/loss | Seats % | Votes % | Votes | +/− | |
---|---|---|---|---|---|---|---|---|---|
Conservative | 15 | 7 | 0 | +7 | 83.3 | 51.5 | 9,848 | ||
Labour | 2 | 0 | 6 | -6 | 11.1 | 29.2 | 5,587 | ||
Liberal Democrat | 1 | 1 | 2 | -1 | 5.6 | 19.3 | 3,702 |
Party | Candidate | Votes | % | ± | |
---|---|---|---|---|---|
Conservative | John Harper | 590 | 73.9 | ||
Liberal Democrat | David Puckering | 208 | 26.1 | ||
Majority | 382 | 47.8 | |||
Turnout | 798 | 38.1 | |||
Conservative hold | Swing |
Party | Candidate | Votes | % | ± | |
---|---|---|---|---|---|
Conservative | David Markham | 331 | 63.4 | ||
Liberal Democrat | Claire Brown | 191 | 36.6 | ||
Majority | 140 | 26.8 | |||
Turnout | 522 | 19.4 | |||
Conservative hold | Swing |
Party | Candidate | Votes | % | ± | |
---|---|---|---|---|---|
Conservative | Catharine Fulljames | 454 | 80.5 | ||
Liberal Democrat | Ralph Rookwood | 110 | 19.5 | ||
Majority | 354 | 61.0 | |||
Turnout | 564 | 21.6 | |||
Conservative hold | Swing |
Party | Candidate | Votes | % | ± | |
---|---|---|---|---|---|
Conservative | Rose Stratford | 1,073 | 50.8 | ||
Labour | John Hanna | 667 | 31.6 | ||
Liberal Democrat | Elizabeth Yardley | 374 | 17.7 | ||
Majority | 406 | 19.2 | |||
Turnout | 2,114 | 27.4 | |||
Conservative gain from Labour | Swing | ||||
Party | Candidate | Votes | % | ± | |
---|---|---|---|---|---|
Conservative | Diana Edwards | 483 | 61.4 | ||
Labour | Di Pettifer | 304 | 38.6 | ||
Majority | 179 | 22.8 | |||
Turnout | 787 | 24.7 |
Party | Candidate | Votes | % | ± | |
---|---|---|---|---|---|
Conservative | Norman Bolster | 1,130 | 47.4 | ||
Labour | Les Sibley | 937 | 39.3 | ||
Liberal Democrat | Kay Brown | 315 | 13.2 | ||
Majority | 193 | 8.1 | |||
Turnout | 2,382 | 30.9 |
Party | Candidate | Votes | % | ± | |
---|---|---|---|---|---|
Conservative | Ann Graham | 534 | 65.8 | ||
Liberal Democrat | Peter Davis | 277 | 34.2 | ||
Majority | 257 | 31.6 | |||
Turnout | 811 | 47.9 | |||
Conservative hold | Swing |
Party | Candidate | Votes | % | ± | |
---|---|---|---|---|---|
Conservative | Elizabeth Macleod | 853 | 60.5 | ||
Labour | Roy Mold | 379 | 26.9 | ||
Liberal Democrat | Geoffrey Fisher | 179 | 12.7 | ||
Majority | 474 | 33.6 | |||
Turnout | 1,411 | 20.2 |
Party | Candidate | Votes | % | ± | |
---|---|---|---|---|---|
Conservative | Hilary Smith | 952 | 59.2 | ||
Liberal Democrat | Daphne Nash | 423 | 26.3 | ||
Labour | Andrew Beere | 232 | 14.4 | ||
Majority | 529 | 32.9 | |||
Turnout | 1,607 | 31.7 | |||
Conservative gain from Liberal Democrat | Swing | ||||
Party | Candidate | Votes | % | ± | |
---|---|---|---|---|---|
Conservative | Maurice Billington | 230 | 46.6 | ||
Liberal Democrat | Anne Parsley | 218 | 44.1 | ||
Labour | Joyce Ruiz | 46 | 9.3 | ||
Majority | 12 | 2.5 | |||
Turnout | 494 | 47.7 | |||
Conservative hold | Swing |
Party | Candidate | Votes | % | ± | |
---|---|---|---|---|---|
Labour | Sandra Mold | 644 | 53.1 | ||
Conservative | Thomas Greeves | 568 | 46.9 | ||
Majority | 76 | 6.2 | |||
Turnout | 1,212 | 18.4 | |||
Labour hold | Swing |
Party | Candidate | Votes | % | ± | |
---|---|---|---|---|---|
Conservative | Elsie Milne | 617 | 61.5 | ||
Labour | Balbiz Dhesi | 387 | 38.5 | ||
Majority | 230 | 23.0 | |||
Turnout | 1,004 | 19.1 | |||
Conservative hold | Swing |
Party | Candidate | Votes | % | ± | |
---|---|---|---|---|---|
Conservative | Lorna Mansell | 231 | 54.9 | ||
Labour | Elizabeth Gatliff | 135 | 32.1 | ||
Liberal Democrat | Mervyn Probert | 55 | 13.1 | ||
Majority | 96 | 22.8 | |||
Turnout | 421 | 40.7 | |||
Conservative hold | Swing |
Party | Candidate | Votes | % | ± | |
---|---|---|---|---|---|
Liberal Democrat | Christopher Pack | 852 | 60.2 | ||
Labour | Andrew Hornsby-Smith | 564 | 39.8 | ||
Majority | 288 | 20.4 | |||
Turnout | 1,416 | 31.1 | |||
Liberal Democrat gain from Labour | Swing | ||||
Party | Candidate | Votes | % | ± | |
---|---|---|---|---|---|
Conservative | Mary Young | 533 | 42.8 | ||
Labour | Anthony Chinn | 435 | 34.9 | ||
Liberal Democrat | Devena Rae | 277 | 22.2 | ||
Majority | 98 | 7.9 | |||
Turnout | 1,245 | 28.2 |
Party | Candidate | Votes | % | ± | |
---|---|---|---|---|---|
Conservative | William Evans | 474 | 80.7 | ||
Liberal Democrat | Derek Turner | 113 | 19.3 | ||
Majority | 361 | 61.4 | |||
Turnout | 587 | 34.9 | |||
Conservative hold | Swing |
Party | Candidate | Votes | % | ± | |
---|---|---|---|---|---|
Labour | Richard Doy | 470 | 58.1 | ||
Conservative | Christopher Mills | 339 | 41.9 | ||
Majority | 131 | 16.2 | |||
Turnout | 809 | 11.5 | |||
Labour hold | Swing |
Party | Candidate | Votes | % | ± | |
---|---|---|---|---|---|
Conservative | Keith Strangwood | 456 | 47.8 | ||
Labour | Wendy Humphries | 387 | 40.6 | ||
Liberal Democrat | Anthony Burns | 110 | 11.5 | ||
Majority | 69 | 7.2 | |||
Turnout | 953 | 53.0 | |||
Conservative gain from Labour | Swing | ||||
One third of Cherwell District Council in Oxfordshire, England is elected each year, followed by one year without election. Since the last boundary changes in 2002, 50 councillors have been elected from 28 wards.
The 2002 Redditch Borough Council election of 2 May 2002 elected members of Redditch Borough Council in the West Midlands region, England. One third of the council stood for re-election and the Labour party lost overall control of the council to no overall control for the first time in many years.
Elections to Hartlepool Borough Council in the ceremonial county of County Durham in England were held on 4 May 2000. One third of the council was up for election and the Labour party lost overall control of the council to no overall control.
The 1999 Bromsgrove District Council election took place on 6 May 1999 to elect members of Bromsgrove district council in Worcestershire, England. The whole council was up for election and the Conservative party gained overall control of the council from the Labour party.
The 1998 Cherwell District Council election took place on 7 May 1998 to elect members of Cherwell District Council in Oxfordshire, England. One third of the council was up for election and the council stayed under no overall control.
The 1999 Cherwell District Council election took place on 6 May 1999 to elect members of Cherwell District Council in Oxfordshire, England. One third of the council was up for election and the council stayed under no overall control.
The 2002 Cherwell District Council election took place on 2 May 2002 to elect members of Cherwell District Council in Oxfordshire, England. The whole council was up for election with boundary changes since the last election in 2000 reducing the number of seats by 2. The Conservative party stayed in overall control of the council.
The 2003 Cherwell District Council election took place on 1 May 2003 to elect members of Cherwell District Council in Oxfordshire, England. One third of the council was up for election and the Conservative party stayed in overall control of the council.
The 2006 Cherwell District Council election took place on 4 May 2006 to elect members of Cherwell District Council in Oxfordshire, England. One third of the council was up for election and the Conservative party stayed in overall control of the council.
The 2007 Cherwell District Council election took place on 3 May 2007 to elect members of Cherwell District Council in Oxfordshire, England. One third of the council was up for election and the Conservative party stayed in overall control of the council.
The 2008 Cherwell District Council election took place on 1 May 2008 to elect members of Cherwell District Council in Oxfordshire, England. One third of the council was up for election and the Conservative party stayed in overall control of the council.
The 2006 St Albans City and District Council election took place on 4 May 2006 to elect members of St Albans District Council in Hertfordshire, England. One third of the council was up for election and the Liberal Democrats gained overall control of the council from no overall control.
The 2007 St Albans City and District Council election took place on 3 May 2007 to elect members of St Albans District Council in Hertfordshire, England. One third of the council was up for election and the Liberal Democrats lost overall control of the council to no overall control.
The 2008 Wyre Forest District Council election took place on 1 May 2008 to elect members of Wyre Forest District Council in Worcestershire, England. One third of the council was up for election and the Conservative party gained overall control of the council from no overall control.
The 2000 Solihull Metropolitan Borough Council election took place on 4 May 2000 to elect members of Solihull Metropolitan Borough Council in the West Midlands, England. One third of the council was up for election and the Conservative party gained overall control of the council from no overall control.
The 2006 Solihull Metropolitan Borough Council election took place on 4 May 2006 to elect members of Solihull Metropolitan Borough Council in the West Midlands, England. One third of the council was up for election and the Conservative party stayed in overall control of the council.
The 2006 Sunderland Council election took place on 4 May 2006 to elect members of Sunderland City Council in Tyne and Wear, England. One third of the Council was up for election and the Labour party stayed in overall control.
The 2008 Sunderland Council election took place on 1 May 2008 to elect members of Sunderland Metropolitan Borough Council in Tyne and Wear, England. One third of the council was up for election and the Labour party stayed in overall control of the council.
The 2011 Cherwell District Council election took place on 5 May 2011 to elect members of Cherwell District Council in Oxfordshire, England. One third of the council was up for election and the Conservative party stayed in overall control of the council.
The 2015 West Oxfordshire District Council election took place on 22 May 2015 to elect members of West Oxfordshire District Council in Oxfordshire, England. One third of the council was up for election and the Conservative party stayed in overall control of the council.