West Oxfordshire District Council election, 1998

Last updated

The 1998 West Oxfordshire District Council election took place on 7 May 1998 to elect members of West Oxfordshire District Council in Oxfordshire, England. One third of the council was up for election and the council stayed under no overall control. [1]

West Oxfordshire Non-metropolitan district in England

West Oxfordshire is a local government district in northwest Oxfordshire, England, including towns such as Woodstock, Burford, Chipping Norton, Charlbury, Carterton and Witney, where the council is based.

Non-metropolitan district Type of local government district in England

Non-metropolitan districts, or colloquially "shire districts", are a type of local government district in England. As created, they are sub-divisions of non-metropolitan counties in a two-tier arrangement.

Oxfordshire County of England

Oxfordshire is a county in South East England. The ceremonial county borders Warwickshire to the north-west, Northamptonshire to the north-east, Buckinghamshire to the east, Berkshire to the south, Wiltshire to the south-west and Gloucestershire to the west.

Contents

After the election, the composition of the council was

Conservative Party (UK) Political party in the United Kingdom

The Conservative Party, officially the Conservative and Unionist Party, is a centre-right political party in the United Kingdom. The governing party since 2010, it is the largest in the House of Commons, with 313 Members of Parliament, and also has 249 members of the House of Lords, 18 members of the European Parliament, 31 Members of the Scottish Parliament, 12 members of the Welsh Assembly, eight members of the London Assembly and 8,916 local councillors.

Liberal Democrats (UK) Political party in the United Kingdom

The Liberal Democrats are a liberal political party in the United Kingdom. It is currently led by Vince Cable. They have 11 Members of Parliament in the House of Commons, 96 members of the House of Lords, one member of the European Parliament, five Members of the Scottish Parliament and one member in the Welsh Assembly and London Assembly. At the height of its influence, the party formed a coalition government with the Conservative Party from 2010 to 2015 with its leader Nick Clegg serving as Deputy Prime Minister.

The Labour Party is a centre-left political party in the United Kingdom that has been described as an alliance of social democrats, democratic socialists and trade unionists. The party's platform emphasises greater state intervention, social justice and strengthening workers' rights.

Background

Before the election there were 15 independent councillors, the Liberal Democrats had 14 seats, Labour had 11 and the Conservatives had 9. [3] An alliance between the Liberal Democrats and the Labour party controlled the council with a majority of one seat. [3]

A Councillor is a member of a local government council.

Among the councillors who stood down at the election was independent David Walker, who had quit the Conservatives in the early 1990s over the poll tax, as well as Patrick Madden, Peg McWilliam, Elizabeth Mortimer and Susan Swann. [3] 49 candidates stood for the 18 seats that were contested in 1998, including one candidate from the Green party, with the Liberal Democrats defending the most seats at eight. [3]

Poll tax (Great Britain)

The Community Charge, commonly known as the poll tax, was a system of taxation introduced in replacement of domestic rates in Scotland from 1989, prior to its introduction in England and Wales from 1990. It provided for a single flat-rate per-capita tax on every adult, at a rate set by the local authority. The charge was replaced by Council Tax in 1993, two years after its abolition was announced.

Green Party of England and Wales Political party in England and Wales

The Green Party of England and Wales is a green, left-wing political party in England and Wales. Headquartered in London, since September 2018, its co-leaders are Siân Berry and Jonathan Bartley. The Green Party has one representative in the House of Commons, one in the House of Lords, and three in the European Parliament. In addition, it has various councillors in UK local government and two members of the London Assembly.

Election result

The Conservatives became the largest group on the council after gaining five seats. [4]

West Oxfordshire local election result 1998 [1] [5]
PartySeatsGainsLossesNet gain/lossSeats %Votes %Votes+/−
  Conservative 950+550.039.05,758
  Liberal Democrat 602-233.328.94,262
  Independent 202-211.16.4949
  Labour 101-15.625.43,752
  Green 000000.227

Ward results

Ascott and Shipton [3] [5]
PartyCandidateVotes%±
Independent Robert Barrett29545.9
Conservative Rodney Rose24037.3
Labour Frances Ashworth10816.8
Majority558.6
Turnout 64341.4
Independent hold Swing
Aston Bampton and Standlake [3] [5]
PartyCandidateVotes%±
Liberal Democrat Brenda Smith57674.7
Conservative Martin Chapman15319.8
Labour Christine Ainsley-Cowlishaw425.4
Majority42354.9
Turnout 77138.4
Liberal Democrat hold Swing
Bampton [3] [5]
PartyCandidateVotes%±
Independent Jonathan Phillips48083.2
Labour Duncan Enright5910.2
Liberal Democrat Gareth Epps386.6
Majority42173.0
Turnout 57728.9
Independent hold Swing
Bartons [3] [5]
PartyCandidateVotes%±
Conservative William Goffe24356.1
Liberal Democrat Richard Noviss11727.0
Labour Matthew Deans7316.9
Majority12629.1
Turnout 43329.5
Conservative hold Swing
Bladon and Cassington [3] [5]
PartyCandidateVotes%±
Conservative Louise Chapman30658.4
Labour Laurence Whitehead21841.6
Majority8816.8
Turnout 52443.5
Conservative hold Swing
Brize Norton and Curbridge [3] [5]
PartyCandidateVotes%±
Conservative Verena Hunt46260.8
Labour William Tumbridge20426.8
Liberal Democrat David Rossiter9412.4
Majority25833.9
Turnout 76025.7
Conservative gain from Independent Swing
Burford [5]
PartyCandidateVotes%±
Liberal Democrat Christopher Davis38349.5
Conservative Mary Sanderson32942.5
Labour Alison Bettle354.5
Green Ann Edmonds273.5
Majority547.0
Turnout 77446.8
Liberal Democrat hold Swing
Carterton North [3] [5]
PartyCandidateVotes%±
Conservative Charles Marlow50249.5
Labour William Stevenson18818.5
Independent Keith Stone17417.1
Liberal Democrat Richard Harold15114.9
Majority31430.9
Turnout 1,01520.7
Conservative gain from Independent Swing
Carterton South [3] [5]
PartyCandidateVotes%±
Conservative Paul Wesson33149.3
Liberal Democrat Peter Madden20029.8
Labour John Rowe14121.0
Majority13119.5
Turnout 67222.3
Conservative gain from Liberal Democrat Swing
Charlbury [3] [5]
PartyCandidateVotes%±
Liberal Democrat Christopher Tatton68660.2
Labour Reginald James25222.1
Conservative Brian Stacey20117.6
Majority43438.1
Turnout 1,13949.7
Liberal Democrat hold Swing
Chipping Norton [3] [5]
PartyCandidateVotes%±
Labour Evelyn Coles71760.6
Conservative Rosalind Stroud46639.4
Majority25121.2
Turnout 1,18326.6
Labour hold Swing
Clanfield and Shilton [5]
PartyCandidateVotes%±
Conservative Angela Neale28668.6
Labour Sally Webster13131.4
Majority15537.2
Turnout 41728.5
Conservative hold Swing
Eynsham [3] [5]
PartyCandidateVotes%±
Liberal Democrat Harry Wyatt67560.5
Conservative Stephen Hayward23921.4
Labour Christopher Miles20218.1
Majority43639.1
Turnout 1,11630.5
Liberal Democrat hold Swing
Filkins and Langford [5]
PartyCandidateVotes%±
Conservative Donald Seale30774.3
Labour Michael Enright10625.7
Majority20148.7
Turnout 41341.7
Conservative hold Swing
Freeland and Hanborough [3] [5]
PartyCandidateVotes%±
Liberal Democrat David James52743.4
Conservative David Dawes52243.0
Labour Kim Simkin16513.6
Majority50.4
Turnout 1,21437.5
Liberal Democrat hold Swing
Witney North [3] [5]
PartyCandidateVotes%±
Conservative David Robertson21836.2
Liberal Democrat Brenda Churchill20734.3
Labour John Ryall17829.5
Majority111.8
Turnout 60325.2
Conservative gain from Liberal Democrat Swing
Witney South [3] [5]
PartyCandidateVotes%±
Conservative Anthony Harvey68654.1
Labour Frederick Saxby58245.9
Majority1048.2
Turnout 1,26823.9
Conservative gain from Labour Swing
Woodstock [3] [5]
PartyCandidateVotes%±
Liberal Democrat Julian Cooper60849.6
Labour Ian Baxter35128.6
Conservative Sandra Rasch26721.8
Majority25721.0
Turnout 1,22649.7
Liberal Democrat hold Swing

Related Research Articles

The 1999 Craven District Council election took place on 6 May 1999 to elect members of Craven District Council in North Yorkshire, England. One third of the council was up for election and the Conservative party gained overall control of the council from no overall control.

The 2000 Craven District Council election took place on 4 May 2000 to elect members of Craven District Council in North Yorkshire, England. One third of the council was up for election and the Conservative party stayed in overall control of the council.

2003 Harlow District Council election

The 2003 Harlow District Council election took place on 1 May 2003 to elect members of Harlow District Council in Essex, England. One third of the council was up for election and the council stayed under no overall control.

2006 St Albans City and District Council election

The 2006 St Albans City and District Council election took place on 4 May 2006 to elect members of St Albans District Council in Hertfordshire, England. One third of the council was up for election and the Liberal Democrats gained overall control of the council from no overall control.

2007 St Albans City and District Council election

The 2007 St Albans City and District Council election took place on 3 May 2007 to elect members of St Albans District Council in Hertfordshire, England. One third of the council was up for election and the Liberal Democrats lost overall control of the council to no overall control.

2014 Craven District Council election

The 2014 Craven District Council election took place on 22 May 2014 to elect members of Craven District Council in North Yorkshire, England. One third of the council was up for election and the Conservative party stayed in overall control of the council.

2003 Wychavon District Council election

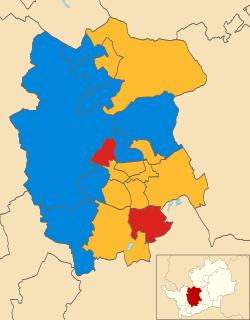
The 2003 Wychavon District Council election took place on 1 May 2003 to elect members of Wychavon District Council in Worcestershire, England. The whole council was up for election with boundary changes since the last election in 1999 reducing the number of seats by four. The Conservative party stayed in overall control of the council.

2007 Wychavon District Council election

The 2007 Wychavon District Council election took place on 3 May 2007 to elect members of Wychavon District Council in Worcestershire, England. The whole council was up for election and the Conservative party stayed in overall control of the council.

The 2000 West Oxfordshire District Council election took place on 4 May 2000 to elect members of West Oxfordshire District Council in Oxfordshire, England. One third of the council was up for election and the Conservative party gained overall control of the council from no overall control.

2002 West Oxfordshire District Council election

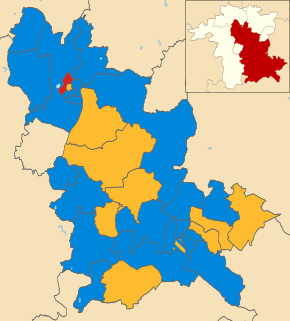
The 2002 West Oxfordshire District Council election took place on 2 May 2002 to elect members of West Oxfordshire District Council in Oxfordshire, England. The whole council was up for election with boundary changes since the last election in 2000. The Conservative party stayed in overall control of the council.

2003 West Oxfordshire District Council election

The 2003 West Oxfordshire District Council election took place on 1 May 2003 to elect members of West Oxfordshire District Council in Oxfordshire, England. One third of the council was up for election and the Conservative party stayed in overall control of the council.

2004 West Oxfordshire District Council election

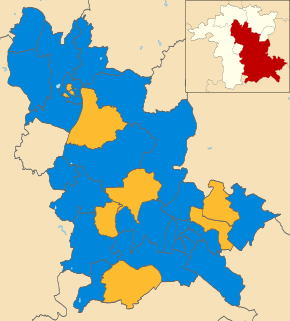
The 2004 West Oxfordshire District Council election took place on 10 June 2004 to elect members of West Oxfordshire District Council in Oxfordshire, England. One third of the council was up for election and the Conservative party stayed in overall control of the council.

2006 West Oxfordshire District Council election

The 2006 West Oxfordshire District Council election took place on 4 May 2006 to elect members of West Oxfordshire District Council in Oxfordshire, England. One third of the council was up for election and the Conservative party stayed in overall control of the council.

2007 West Oxfordshire District Council election

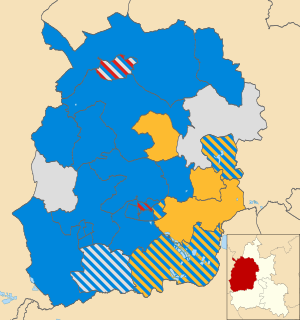
The 2007 West Oxfordshire District Council election took place on 3 May 2007 to elect members of West Oxfordshire District Council in Oxfordshire, England. One third of the council was up for election and the Conservative party stayed in overall control of the council.

2008 West Oxfordshire District Council election

The 2008 West Oxfordshire District Council election took place on 1 May 2008 to elect members of West Oxfordshire District Council in Oxfordshire, England. One third of the council was up for election and the Conservative party stayed in overall control of the council.

2010 West Oxfordshire District Council election

The 2010 West Oxfordshire District Council election took place on 6 May 2010 to elect members of West Oxfordshire District Council in Oxfordshire, England. One third of the council was up for election and the Conservative party stayed in overall control of the council.

2011 West Oxfordshire District Council election

The 2011 West Oxfordshire District Council election took place on 5 May 2011 to elect members of West Oxfordshire District Council in Oxfordshire, England. One third of the council was up for election and the Conservative party stayed in overall control of the council.

2012 West Oxfordshire District Council election

The 2012 West Oxfordshire District Council election took place on 3 May 2012 to elect members of West Oxfordshire District Council in Oxfordshire, England. One third of the council was up for election and the Conservative party stayed in overall control of the council.

2014 West Oxfordshire District Council election

The 2014 West Oxfordshire District Council election took place on 22 May 2014 to elect members of West Oxfordshire District Council in Oxfordshire, England. One third of the council was up for election and the Conservative party stayed in overall control of the council.

2015 West Oxfordshire District Council election

The 2015 West Oxfordshire District Council election took place on 22 May 2015 to elect members of West Oxfordshire District Council in Oxfordshire, England. One third of the council was up for election and the Conservative party stayed in overall control of the council.

References

  1. 1 2 "Local Elections results". The Times . NewsBank. 9 May 1998. p. 46.
  2. "Local government election results". The Independent . NewsBank. 8 May 1998.
  3. 1 2 3 4 5 6 7 8 9 10 11 12 13 14 15 16 17 18 19 "Majority of one". Oxfordshire County Publications. NewsBank. 8 April 1998.
  4. "Lord Mayor beats Greens". Oxfordshire County Publications. NewsBank. 8 May 1998.
  5. 1 2 3 4 5 6 7 8 9 10 11 12 13 14 15 16 17 18 19 "West Oxfordshire District Council Election Results 1998 - 2010" (PDF). West Oxfordshire District Council. Retrieved 2 August 2015.