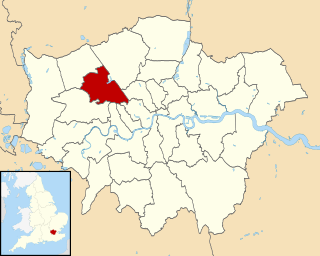
The 1998 Brent London Borough Council election took place on 7 May 1998 to elect members of Brent London Borough Council in London, England. The whole council was up for election and the Labour party gained overall control of the council from no overall control. [1]
The London Borough of Brent is a London borough in north west London, and forms part of Outer London. The major areas are Wembley, Kilburn, Willesden, Harlesden and Neasden.
England is a country that is part of the United Kingdom. It shares land borders with Wales to the west and Scotland to the north-northwest. The Irish Sea lies west of England and the Celtic Sea lies to the southwest. England is separated from continental Europe by the North Sea to the east and the English Channel to the south. The country covers five-eighths of the island of Great Britain, which lies in the North Atlantic, and includes over 100 smaller islands, such as the Isles of Scilly and the Isle of Wight.
The Labour Party is a centre-left political party in the United Kingdom which has been described as an alliance of social democrats, democratic socialists and trade unionists. The party's platform emphasises greater state intervention, social justice and strengthening workers' rights.
Before the election Labour ran the council with the support of the Liberal Democrats. [2] However the Conservatives targeted the council with the Conservative Shadow Secretary of State for the Environment, Transport and the Regions, Norman Fowler, predicting that the Conservatives would make gains in Brent. [3] The Conservatives required a 1% swing from the 1994 election to win a majority on the council, where previously no party had a majority. [4]
The Liberal Democrats are a liberal political party in the United Kingdom. They presently have 11 Members of Parliament in the House of Commons, 96 members of the House of Lords, and one member of the European Parliament. They also have five Members of the Scottish Parliament and a member each in the Welsh Assembly and London Assembly. The party reached the height of its influence in the early 2010s, forming a junior partner in a coalition government from 2010 to 2015. It is presently led by Vince Cable.
The Conservative Party, officially the Conservative and Unionist Party, is a centre-right political party in the United Kingdom. Presently led by Theresa May, it has been the governing party since 2010. It presently has 314 Members of Parliament in the House of Commons, 249 members of the House of Lords, and 18 members of the European Parliament. It also has 31 Members of the Scottish Parliament, 12 members of the Welsh Assembly, eight members of the London Assembly and 9,008 local councillors. One of the major parties of UK politics, it has formed the government on 45 occasions, more than any other party.
The Labour party took a 20-seat majority on the council after gaining 15 seats, with the gains including taking all of the seats in Fryent and Roe Green wards and 1 seat in Queensbury ward from the Conservatives. [2] [5] The Conservatives put their defeat in Brent down to the popularity of the national Labour government and unhappiness at the closure of Edgware General Hospital's casualty department by the previous Conservative government. [2] [5] The Liberal Democrats failed to make gains and dropped from 5 to 4 councillors. [2] Overall turnout at the election was 36.8%, down from 48.3% in 1994. [6]
The wards and electoral divisions in the United Kingdom are electoral districts at sub-national level represented by one or more councillors. The ward is the primary unit of English electoral geography for civil parishes and borough and district councils, electoral ward is the unit used by Welsh principal councils, while the electoral division is the unit used by English county councils and some unitary authorities. Each ward/division has an average electorate of about 5,500 people, but ward-population counts can vary substantially. As at the end of 2014 there were 9,456 electoral wards/divisions in the UK.
Queensbury is an area of northwest London, England, in the southeast of the London Borough of Harrow on the boundary with the London Borough of Brent.
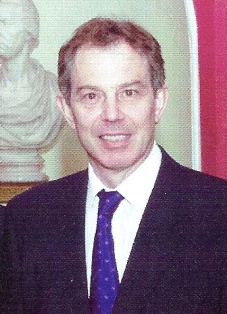
The premiership of Tony Blair began on 2 May 1997 and ended upon his resignation on 27 June 2007. Whilst serving as Prime Minister of the United Kingdom, Tony Blair concurrently served as the First Lord of the Treasury, the Minister for the Civil Service, the Leader of the Labour Party and the Member of Parliament for Sedgefield. He remains a Privy Counsellor, having first been appointed in July 1994 when he became Leader of the Opposition. Blair is the Labour Party's longest-serving Prime Minister, the only Labour Prime Minister to have led the party to victory since 1974, and—having led the party to three consecutive general election victories—also the only Labour Prime Minister to serve two full consecutive terms. Blair is both credited with and criticised for moving the Labour Party towards the centre of British politics, using the term "New Labour" to distinguish his pro-market policies from the more socialist policies which the party had espoused in the past.
Party | Seats | Gains | Losses | Net gain/loss | Seats % | Votes % | Votes | +/− | |
---|---|---|---|---|---|---|---|---|---|
Labour | 43 | +15 | 65.2 | 47.2 | 29,124 | ||||
Conservative | 19 | -13 | 28.8 | 35.4 | 21,855 | ||||
Liberal Democrat | 4 | -1 | 6.1 | 14.5 | 8,936 | ||||
Green | 0 | 0 | 0 | 1.2 | 716 | ||||
Independent | 0 | -1 | 0 | 1.1 | 710 | ||||
Others | 0 | 0 | 0 | 0.7 | 424 |
Party | Candidate | Votes | % | ± | |
---|---|---|---|---|---|
Liberal Democrat | Daniel Brown | 1,310 | |||
Liberal Democrat | John Rattray | 1,227 | |||
Labour | Ronald Collman | 720 | |||
Labour | Leon Turini | 541 | |||
Conservative | Dineshkumar Mistry | 271 | |||
Independent | Ratnasabapathy Ananthanathan | 216 | |||
Conservative | Everton Williams | 194 | |||
Turnout | 4,479 | 43.9 |
Party | Candidate | Votes | % | ± | |
---|---|---|---|---|---|
Liberal Democrat | Paul Lorber | 1,023 | |||
Liberal Democrat | Anthony Hughes | 898 | |||
Labour | Victor Humphrey | 603 | |||
Conservative | Christie Fernandes | 594 | |||
Conservative | Bruce Embleton | 573 | |||
Labour | Anton Singarayer | 515 | |||
Turnout | 4,206 | 44.9 |
Party | Candidate | Votes | % | ± | |
---|---|---|---|---|---|
Conservative | Irwin Van Colle | 1,066 | |||
Conservative | Suresh Kansagra | 1,013 | |||
Labour | Conal O'Connor | 467 | |||
Labour | Maureen Queally | 467 | |||
Liberal Democrat | Sydney Leigh | 157 | |||
Liberal Democrat | Ishaq Mohammed | 126 | |||
Turnout | 3,296 | 35.9 |
Party | Candidate | Votes | % | ± | |
---|---|---|---|---|---|
Labour | Ralph Fox | 1,409 | |||
Labour | Akbertkhan Sarguroh | 1,237 | |||
Conservative | Alan Wall | 1,026 | |||
Conservative | Ian Lyon | 979 | |||
Liberal Democrat | Diana Ayres | 206 | |||
Liberal Democrat | Gisele Sukhram | 171 | |||
Turnout | 5,028 | 43.2 |
Party | Candidate | Votes | % | ± | |
---|---|---|---|---|---|
Labour | Keith Ferry | 1,068 | |||
Labour | Gabrielle Kagan | 1,054 | |||
Conservative | Albert Wakelin | 762 | |||
Conservative | Ghulam Qureshi | 700 | |||
Liberal Democrat | Madeleine Gaskin | 224 | |||
Liberal Democrat | Chunilal Hirani | 161 | |||
Green | Simone Aspis | 160 | |||
Turnout | 4,129 | 35.8 |
Party | Candidate | Votes | % | ± | |
---|---|---|---|---|---|
Labour | Mary Arnold | 874 | |||
Labour | John Lebor | 768 | |||
Conservative | Shane Andrews | 165 | |||
Conservative | Ibrar Qureshi | 120 | |||
Liberal Democrat | Zoe Ryle | 97 | |||
Turnout | 2,024 | 28.8 |
Party | Candidate | Votes | % | ± | |
---|---|---|---|---|---|
Labour | Charles Lemmon | 1,196 | |||
Labour | Jon Godfrey | 1,138 | |||
Conservative | Christopher Rees | 879 | |||
Conservative | John Warren | 865 | |||
Liberal Democrat | Jonathan Pincus | 165 | |||
Green | Philip Dymond | 157 | |||
Liberal Democrat | Jack Papasavva | 155 | |||
Turnout | 4,555 | 45.2 |
Party | Candidate | Votes | % | ± | |
---|---|---|---|---|---|
Labour | Dorman Long | 624 | |||
Labour | Bobby Thomas | 617 | |||
Conservative | Ratilal Shah | 518 | |||
Conservative | David Gauke | 473 | |||
Liberal Democrat | Dudley Gaskin | 127 | |||
Liberal Democrat | Robert Wenley | 125 | |||
Turnout | 2,484 | 30.4 |
Party | Candidate | Votes | % | ± | |
---|---|---|---|---|---|
Conservative | Carol Shaw | 1,282 | |||
Conservative | Jack Sayers | 1,191 | |||
Labour | George Crane | 853 | |||
Labour | James Powney | 841 | |||
Liberal Democrat | Christian Baker | 200 | |||
Liberal Democrat | Azwar Mohammed | 127 | |||
Turnout | 4,494 | 39.4 |
Party | Candidate | Votes | % | ± | |
---|---|---|---|---|---|
Labour | Lawrence Pardoe | 1,197 | |||
Labour | Asish Sengupta | 1,027 | |||
Conservative | Joel Games | 839 | |||
Conservative | Peter Nelke | 767 | |||
Liberal Democrat | Frederick Gordon | 248 | |||
Liberal Democrat | Steven Billam | 177 | |||
Turnout | 4,255 | 39.1 |
Party | Candidate | Votes | % | ± | |
---|---|---|---|---|---|
Labour | Michael Lyon | 1,069 | |||
Labour | Abdul Sattar-Butt | 964 | |||
Conservative | Edward Lazarus | 959 | |||
Conservative | Francis Torrens | 908 | |||
Liberal Democrat | William Anderson | 170 | |||
Liberal Democrat | Alastair MacEwan | 111 | |||
Turnout | 4,181 | 39.8 |
Party | Candidate | Votes | % | ± | |
---|---|---|---|---|---|
Labour | Paul Daisley | 819 | |||
Labour | Ann Reeder | 757 | |||
Conservative | Sanjaykumar Patel | 148 | |||
Conservative | Rosaline Owaka | 143 | |||
Liberal Democrat | Joseph Fahey | 127 | |||
Liberal Democrat | Brenda Shuttleworth | 91 | |||
Turnout | 2,085 | 29.4 |
Party | Candidate | Votes | % | ± | |
---|---|---|---|---|---|
Labour | Bertha Joseph | 910 | |||
Labour | Helga Gladbaum | 833 | |||
Liberal Democrat | Geoffrey Walley | 160 | |||
Liberal Democrat | Eamon Ryan | 134 | |||
Conservative | Kenneth Sinclair | 126 | |||
Conservative | Smart Owaka | 116 | |||
Turnout | 2,279 | 30.8 |
Party | Candidate | Votes | % | ± | |
---|---|---|---|---|---|
Conservative | Arthur Steel | 1,480 | |||
Conservative | Sean O'Sullivan | 1,410 | |||
Labour | Dorothy Bryson | 733 | |||
Labour | Mary Daly | 713 | |||
Liberal Democrat | Annie Bliss | 256 | |||
Liberal Democrat | Bridget Kelly | 242 | |||
Turnout | 4,834 | 35.7 |
Party | Candidate | Votes | % | ± | |
---|---|---|---|---|---|
Labour | Peter Pendsay | 1,023 | |||
Labour | Mary Cribbin | 955 | |||
Liberal Democrat | Elizabeth Clark | 272 | |||
Conservative | Stephen Batten | 264 | |||
Conservative | Mohammad Chugtai | 207 | |||
Liberal Democrat | Roger Crouch | 152 | |||
Socialist Alliance | Philip Kent | 54 | |||
Turnout | 2,927 | 32.9 |
Party | Candidate | Votes | % | ± | |
---|---|---|---|---|---|
Conservative | Reginald Colwill | 1,084 | |||
Conservative | Carupiah Selvarajah | 1,004 | |||
Labour | William Mears | 834 | |||
Labour | Malcolm Gosling | 781 | |||
Liberal Democrat | Alan Klein | 180 | |||
Liberal Democrat | Rodney Saunders | 136 | |||
Turnout | 4,019 | 36.5 |
Party | Candidate | Votes | % | ± | |
---|---|---|---|---|---|
Labour | Andrew Ammerlaan | 923 | |||
Labour | Moore Giwa | 773 | |||
Conservative | Akua Abban-Davis | 230 | |||
Liberal Democrat | John Chapman | 228 | |||
Liberal Democrat | Donald MacArthur | 197 | |||
Conservative | Harry Quainoo | 163 | |||
Green | Sally Ibbotson | 144 | |||
Turnout | 2,658 | 30.3 |
Party | Candidate | Votes | % | ± | |
---|---|---|---|---|---|
Labour | Janice Long | 1,081 | |||
Labour | Ian Bellia | 926 | |||
Conservative | Peter Czarniecki | 784 | |||
Conservative | Pamela O'Brien | 660 | |||
Liberal Democrat | James Heath | 128 | |||
Green | Donald Lowe | 119 | |||
Liberal Democrat | Emma Talbot | 87 | |||
Turnout | 3,785 | 37.8 |
Party | Candidate | Votes | % | ± | |
---|---|---|---|---|---|
Conservative | Robert Blackman | 1,922 | |||
Conservative | Harshadbhai Patel | 1,734 | |||
Conservative | Thomas Taylor | 1,731 | |||
Labour | Eileen Macklin | 1,019 | |||
Labour | Cyril McGovern | 1,014 | |||
Labour | George Macklin | 959 | |||
Conservative Independent | Chunilal Chavda | 279 | |||
Liberal Democrat | Richard Thomas | 260 | |||
Liberal Democrat | Jacqueline Bunce-Linsell | 259 | |||
Turnout | 9,177 | 36.0 |
Party | Candidate | Votes | % | ± | |
---|---|---|---|---|---|
Labour | Neil Nerva | 1,038 | |||
Labour | Sarah Walker | 1,005 | |||
Liberal Democrat | Anthony Spitzel | 340 | |||
Liberal Democrat | Robert Wharton | 286 | |||
Conservative | Wendy MacHugh | 217 | |||
Conservative | Jennifer Seaton-Brown | 202 | |||
Turnout | 3,088 | 41.8 |
Party | Candidate | Votes | % | ± | |
---|---|---|---|---|---|
Labour | Rameshchandra Patel | 832 | |||
Conservative | Eric McDonald | 738 | |||
Labour | Anthony Burleton | 733 | |||
Conservative | Mohammad Rizvi | 679 | |||
Liberal Democrat | Hilda Glazer | 94 | |||
Liberal Democrat | Elizabeth Kornfeld | 66 | |||
Turnout | 3,142 | 38.6 |
Party | Candidate | Votes | % | ± | |
---|---|---|---|---|---|
Labour | William Dromey | 1,183 | |||
Labour | John Duffy | 1,178 | |||
Conservative | Navinchandra Patel | 855 | |||
Conservative | Peter Golds | 823 | |||
Liberal Democrat | Vivienne Williamson | 155 | |||
Liberal Democrat | Anthony Littman | 111 | |||
Turnout | 4,305 | 41.1 |
Party | Candidate | Votes | % | ± | |
---|---|---|---|---|---|
Labour | Joyce Bacchus | 753 | |||
Labour | Mohammad Zakriya | 625 | |||
Independent | James Fitzpatrick | 416 | |||
Conservative | Jean Chopping | 135 | |||
Conservative | Abid Ashary | 131 | |||
Liberal Democrat | Benedict Rich | 74 | |||
Liberal Democrat | Mohammad Khokhar | 57 | |||
Turnout | 2,191 | 29.5 |
Party | Candidate | Votes | % | ± | |
---|---|---|---|---|---|
Labour | Columbus Moloney | 568 | |||
Labour | Robert Hamadi | 543 | |||
Liberal Democrat | Rosa Gordon | 142 | |||
Conservative | Bhiku Patel | 133 | |||
Liberal Democrat | Leslie Lewis | 115 | |||
Conservative | Abdul Rehman | 109 | |||
Independent | Kanwal Shergill | 78 | |||
Turnout | 1,688 | 27.4 |
Party | Candidate | Votes | % | ± | |
---|---|---|---|---|---|
Labour | Richard Harrod | 690 | |||
Conservative | James O'Sullivan | 636 | |||
Conservative | Naginbhai Parmar | 607 | |||
Labour | Aston Walters | 594 | |||
Liberal Democrat | Helen Durnford | 86 | |||
Liberal Democrat | Bernard Luby | 78 | |||
Turnout | 2,691 | 38.3 |
Party | Candidate | Votes | % | ± | |
---|---|---|---|---|---|
Labour | David Coughlin | 1,125 | |||
Labour | Ann John | 1,106 | |||
Labour | Kantibhai Patel | 996 | |||
Conservative | Emanuel Henry | 317 | |||
Conservative | Natalie Colwill | 283 | |||
Conservative | Manibhai Hathalia | 228 | |||
Liberal Democrat | Eileen Barker | 208 | |||
Liberal Democrat | Christopher Queen | 146 | |||
Liberal Democrat | Andrew Scott | 119 | |||
Turnout | 4,528 | 24.1 |
Party | Candidate | Votes | % | ± | |
---|---|---|---|---|---|
Conservative | Uma Fernandes | 1,086 | |||
Conservative | Cormach Moore | 1,010 | |||
Conservative | Neil Rands | 990 | |||
Labour | Christopher Alexis | 984 | |||
Liberal Democrat | John Lewis | 975 | |||
Liberal Democrat | Violet Steele | 944 | |||
Liberal Democrat | Henry Melzack | 893 | |||
Labour | Mohammad Hoda | 845 | |||
Labour | Lewis Hodgetts | 841 | |||
Turnout | 8,568 | 41.4 |
Party | Candidate | Votes | % | ± | |
---|---|---|---|---|---|
Conservative | Gideon Fiegel | 985 | |||
Conservative | Vanessa Howells | 927 | |||
Labour | Mary Finnegan | 864 | |||
Labour | Deborah Kafka | 768 | |||
Liberal Democrat | Sue Lorber | 175 | |||
Liberal Democrat | Alan Johnston | 149 | |||
Turnout | 3,868 | 34.4 |
Party | Candidate | Votes | % | ± | |
---|---|---|---|---|---|
Labour | Alec Castle | 1,451 | |||
Labour | Orugbani Douglas | 1,427 | |||
Conservative | Nicola Blackman | 1,365 | |||
Labour | Dhirajlal Kataria | 1,318 | |||
Conservative | Janet Graham | 1,227 | |||
Conservative | Manibhai Patel | 1,152 | |||
Liberal Democrat | Diana Lewis | 198 | |||
Liberal Democrat | Chandrakant Patel | 190 | |||
Liberal Democrat | Nathalal Hingorani | 119 | |||
Turnout | 8,447 | 40.1 |
Party | Candidate | Votes | % | ± | |
---|---|---|---|---|---|
Labour | Lincoln Beswick | 1,035 | |||
Labour | Tullah Persaud | 905 | |||
Liberal Democrat | Chandubhai Patel | 817 | |||
Liberal Democrat | Valerie Brown | 736 | |||
Conservative | Harihar Patel | 644 | |||
Conservative | Pearl Mordish | 559 | |||
Turnout | 4,696 | 44.4 |
Party | Candidate | Votes | % | ± | |
---|---|---|---|---|---|
Labour | Lesley Jones | 1,179 | |||
Labour | Ahmad Shahzad | 947 | |||
Conservative | Gabriel Reynolds | 345 | |||
Conservative | Mohammed Chughtai | 312 | |||
Green | Brian Orr | 136 | |||
Liberal Democrat | Arvindbhai Patel | 134 | |||
Socialist Alliance | Stanley Keable | 91 | |||
Liberal Democrat | Farhana Salama | 81 | |||
Turnout | 3,225 | 33.3 |
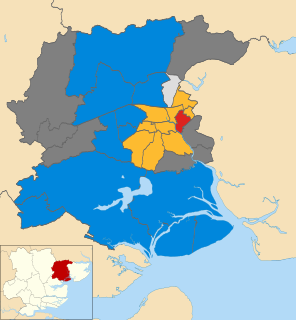
The 2006 Colchester Borough Council election took place on 4 May 2006 to elect members of Colchester Borough Council in Essex, England. One third of the council was up for election and the council stayed under no overall control.
The 1999 Harlow District Council election took place on 6 May 1999 to elect members of Harlow District Council in Essex, England. One third of the council was up for election and the Labour party stayed in overall control of the council.
The 2003 Harlow District Council election took place on 1 May 2003 to elect members of Harlow District Council in Essex, England. One third of the council was up for election and the council stayed under no overall control.
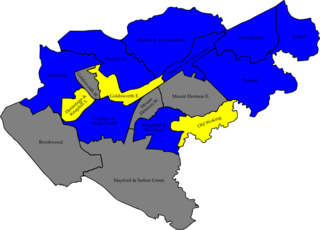
The 2007 Woking Council election took place on 3 May 2007 to elect members of Woking Borough Council in Surrey, England. One third of the council was up for election and the Conservative party gained overall control of the council from no overall control.
The 2006 Maidstone Borough Council election took place on 4 May 2006 to elect members of Maidstone Borough Council in Kent, England. One third of the council was up for election and the council stayed under no overall control.
The 2008 Maidstone Borough Council election took place on 1 May 2008 to elect members of Maidstone Borough Council in Kent, England. One third of the council was up for election and the Conservative party gained overall control of the council from no overall control.
The 2004 Colchester Borough Council election took place on 10 June 2004 to elect members of Colchester Borough Council in Essex, England. This was the same day as the other 2004 United Kingdom local elections and as the 2004 European Parliament Elections. One third of the seats were up for election and the council stayed under no overall control.
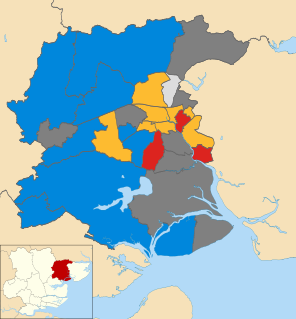
The 2007 Colchester Borough Council election took place on 3 May 2007 to elect members of Colchester Borough Council in Essex, England. One third of the council was up for election and the council stayed under no overall control.
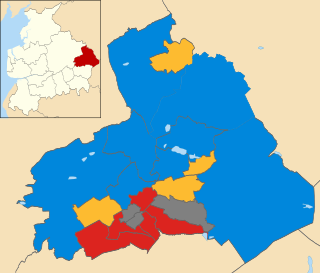
The 2011 Pendle Borough Council election took place on 5 May 2011 to elect members of Pendle Borough Council in Lancashire, England. One third of the council was up for election and the council stayed under no overall control.
The 2006 Havant Borough Council election took place on 4 May 2006 to elect members of Havant Borough Council in Hampshire, England. One third of the council was up for election and the Conservative party stayed in overall control of the council.
The 2007 Havant Borough Council election took place on 3 May 2007 to elect members of Havant Borough Council in Hampshire, England. One third of the council was up for election and the Conservative party stayed in overall control of the council.
The 2008 Havant Borough Council election took place on 1 May 2008 to elect members of Havant Borough Council in Hampshire, England. One third of the council was up for election and the Conservative party stayed in overall control of the council.
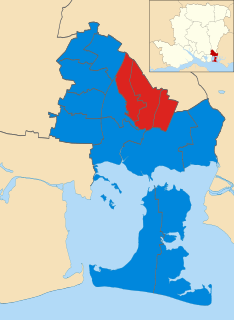
The 2012 Havant Borough Council election took place on 3 May 2012 to elect members of Havant Borough Council in Hampshire, England. One third of the council was up for election and the Conservative party stayed in overall control of the council.
The 2012 Harlow District Council election took place on 3 May 2012 to elect members of Harlow District Council in Essex, England. One third of the council was up for election and the Labour party gained overall control of the council from the Conservative party.
The 2006 Brent London Borough Council election took place on 4 May 2006 to elect members of Brent London Borough Council in London, England. The whole council was up for election and the Labour party lost overall control of the council to no overall control.
The 2010 Brent London Borough Council election took place on 6 May 2010 to elect members of Brent London Borough Council in London, England. The whole council was up for election and the Labour party gained overall control of the council from no overall control.
The 2014 Brent London Borough Council election took place on 22 May 2014 to elect members of Brent London Borough Council in London, England. The whole council was up for election and the Labour Party stayed in overall control of the council.
The 2012 Tandridge District Council election took place on 3 May 2012 to elect members of Tandridge District Council in Surrey, England. One third of the council was up for election and the Conservative party stayed in overall control of the council.
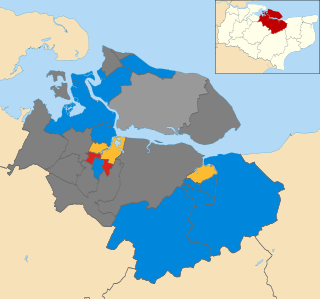
The 2008 Swale Borough Council election took place on 1 May 2008 to elect members of Swale Borough Council in Kent, England. One third of the council was up for election and the Conservative party stayed in overall control of the council.
The 2010 Swale Borough Council election took place on 6 May 2010 to elect members of Swale Borough Council in Kent, England. One third of the council was up for election and the Conservative party stayed in overall control of the council.