
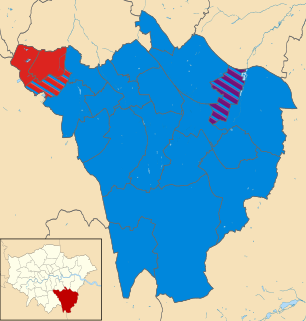
The 2014 Sutton Council election took place on 22 May 2014 to elect members of Sutton Council in England. [1] This was on the same day as other local elections.
The 2014 Sutton Council election took place on 22 May 2014 to elect members of Sutton Council in England. [1] This was on the same day as other local elections.
The Liberal Democrats retained control winning 45 seats (+2) with the Conservatives winning 9 seats (−2). [1]
| Party | Seats | Gains | Losses | Net gain/loss | Seats % | Votes % | Votes | +/− | |
|---|---|---|---|---|---|---|---|---|---|
| Liberal Democrat | 45 | 83 | 43 | ||||||
| Conservative | 9 | 17 | 30 | ||||||
| Labour | 0 | 0 | 15 | ||||||
| UKIP | 0 | 0 | 8 | ||||||
| Green | 0 | 0 | 3 | ||||||
| Keep Our St. Helier Hospital Party | 0 | 0 | <1 | ||||||
| TUSC | 0 | 0 | <1 | ||||||
| Independent | 0 | 0 | <1 | ||||||
| English Democrat | 0 | 0 | <1 | ||||||
| Christian Peoples | 0 | 0 | <1 | ||||||
| Party | Candidate | Votes | % | ± | |
|---|---|---|---|---|---|
| Liberal Democrat | Pat Ali | 1,299 | |||
| Liberal Democrat | Nick Mattey | 1,290 | |||
| Liberal Democrat | Nighat Piracha | 1,048 | |||
| UKIP | Leslie Price | 779 | |||
| Conservative | Hilary Wortley | 776 | |||
| Conservative | Anusha Vamadeva | 705 | |||
| Conservative | Leon Emirali | 673 | |||
| Labour | Sarah Gwynn | 654 | |||
| Labour | Margaret Hughes | 600 | |||
| Labour | Nawaz Ahmad | 570 | |||
| Green | Joan Hartfield | 257 | |||
| Green | Frederick Hartfield | 235 | |||
| Turnout | 3,372 | 42.4 | −28.8 | ||
| Liberal Democrat hold | Swing | ||||
| Liberal Democrat hold | Swing | ||||
| Liberal Democrat hold | Swing | ||||
In January 2016, Cllr Mattey was expelled from the Liberal Democrats after sighting his vocal opposition to a proposed incinerator which is set to be erected in the ward. [4]
| Party | Candidate | Votes | % | ± | |
|---|---|---|---|---|---|
| Liberal Democrat | Ed Joyce | 1,215 | |||
| Conservative | Neil Garratt | 1,120 | |||
| Liberal Democrat | Manuel Abellan | 1,079 | |||
| Conservative | Jim Simms | 1,045 | |||
| Liberal Democrat | Abdullah Okuyucu | 982 | |||
| Conservative | Andy Williams | 949 | |||
| UKIP | Bill Main-Ian | 788 | |||
| Labour | Mary Towler | 464 | |||
| Labour | Patrick Sim | 440 | |||
| Labour | Alfred Thomas | 430 | |||
| Turnout | 3,325 | 40.9 | −26.0 | ||
| Liberal Democrat hold | Swing | ||||
| Conservative hold | Swing | ||||
| Liberal Democrat hold | Swing | ||||
| Party | Candidate | Votes | % | ± | |
|---|---|---|---|---|---|
| Conservative | David Hicks | 1,687 | |||
| Conservative | Patrick McManus | 1,534 | |||
| Conservative | Jane Pascoe | 1,389 | |||
| Liberal Democrat | Barbara McIntosh | 881 | |||
| Liberal Democrat | Cherry Mattey | 809 | |||
| Liberal Democrat | Russell Neale | 738 | |||
| UKIP | Adrian Noble | 653 | |||
| Labour | Gale Blears | 432 | |||
| Labour | Stephen Blears | 406 | |||
| Labour | Marian Wingrove | 376 | |||
| Turnout | 3,351 | 42.8 | −32.0 | ||
| Conservative hold | Swing | ||||
| Conservative hold | Swing | ||||
| Conservative hold | Swing | ||||
| Party | Candidate | Votes | % | ± | |
|---|---|---|---|---|---|
| Liberal Democrat | Hamish Pollock | 1,634 | |||
| Liberal Democrat | Alan Salter | 1,469 | |||
| Liberal Democrat | Jill Whitehead | 1,460 | |||
| Conservative | Simon Higgs | 1,077 | |||
| Conservative | Arthur Spirling | 989 | |||
| Conservative | Penny Spirling | 974 | |||
| UKIP | Michael Norman | 671 | |||
| Labour | Michael Cawley | 393 | |||
| Labour | Margaret Onians | 384 | |||
| Labour | Alan Tate | 351 | |||
| Green | Bob Steel | 324 | |||
| Green | Andrew Lindsay | 309 | |||
| Green | Mandi Suheimat | 205 | |||
| Christian Peoples | Ashley Dickenson | 90 | |||
| TUSC | Allan Matusevics | 74 | |||
| Turnout | 3,866 | 48.5 | −26.6 | ||
| Liberal Democrat hold | Swing | ||||
| Liberal Democrat hold | Swing | ||||
| Liberal Democrat hold | Swing | ||||
| Party | Candidate | Votes | % | ± | |
|---|---|---|---|---|---|
| Conservative | Tim Crowley | 1,449 | |||
| Conservative | Moira Butt | 1,365 | |||
| Liberal Democrat | Amy Haldane | 1,276 | |||
| Liberal Democrat | Peter Fosdike | 1,268 | |||
| Conservative | Tony Smith | 1,155 | |||
| Liberal Democrat | Alex Vicente-Machado | 1,100 | |||
| UKIP | Alexandra Wraith | 617 | |||
| Green | Ross Hemingway | 488 | |||
| Labour | Marilynne Burbage | 366 | |||
| Labour | David Davis | 331 | |||
| Labour | Claire Shearer | 259 | |||
| Green | Brian Dougherty | 245 | |||
| Turnout | 3,630 | 47.2 | −28.8 | ||
| Conservative hold | Swing | ||||
| Conservative hold | Swing | ||||
| Liberal Democrat hold | Swing | ||||
| Party | Candidate | Votes | % | ± | |
|---|---|---|---|---|---|
| Liberal Democrat | Mary Burstow | 1,761 | |||
| Conservative | Holly Ramsey | 1,688 | |||
| Conservative | Graham Whitham | 1,495 | |||
| Liberal Democrat | Abigail Lock | 1,273 | |||
| Conservative | Misdaq Zaidi | 1,205 | |||
| Liberal Democrat | Simon Youlton | 1,156 | |||
| UKIP | Steve Carpenter | 595 | |||
| UKIP | Angus Dalgleish | 569 | |||
| Keep Our St Helier Hospital Party | David Ash | 396 | |||
| Labour | Alan Aylward | 244 | |||
| Labour | Laura Herridge | 236 | |||
| Labour | Lyndon Edwards | 207 | |||
| Turnout | 3,934 | 48.6 | −27.8 | ||
| Liberal Democrat hold | Swing | ||||
| Conservative hold | Swing | ||||
| Conservative hold | Swing | ||||
| Party | Candidate | Votes | % | ± | |
|---|---|---|---|---|---|
| Liberal Democrat | Samantha Bourne | 1,744 | |||
| Liberal Democrat | Richard Broadbent | 1,570 | |||
| Liberal Democrat | Daniel Sangster | 1,431 | |||
| Conservative | Eric Allen | 1,361 | |||
| Conservative | Alan Plant | 1,291 | |||
| Conservative | Rona Forzani | 1,226 | |||
| UKIP | Howard Cowley | 901 | |||
| Labour | Laura Mullaney | 408 | |||
| Labour | Marcus Papadopoulos | 330 | |||
| Labour | Shawn Buck | 311 | |||
| Turnout | 4,057 | 48.8 | −25.3 | ||
| Liberal Democrat hold | Swing | ||||
| Liberal Democrat hold | Swing | ||||
| Liberal Democrat gain from Conservative | Swing | ||||
| Party | Candidate | Votes | % | ± | |
|---|---|---|---|---|---|
| Liberal Democrat | Jean Crossby | 1,195 | |||
| Liberal Democrat | Martin Gonzalez | 1,070 | |||
| Liberal Democrat | Doug Hunt | 1,069 | |||
| UKIP | Michael Lyon | 843 | |||
| Labour | Nicola Rosenbaum | 734 | |||
| Labour | John Keys | 685 | |||
| Labour | Andrew Theobald | 637 | |||
| Conservative | Lottie Crowley | 380 | |||
| Conservative | Alan Oliver | 320 | |||
| Conservative | Alison Huneke | 306 | |||
| Turnout | 2,910 | 34.7 | −23.4 | ||
| Liberal Democrat hold | Swing | ||||
| Liberal Democrat hold | Swing | ||||
| Liberal Democrat hold | Swing | ||||
| Party | Candidate | Votes | % | ± | |
|---|---|---|---|---|---|
| Liberal Democrat | Adrian Davey | 1,440 | |||
| Liberal Democrat | Nick Emmerson | 1,341 | |||
| Liberal Democrat | Miguel Javelot | 1,205 | |||
| Conservative | Malcolm Brown | 958 | |||
| Conservative | Graham Jarvis | 953 | |||
| UKIP | Lorraine Crawley | 886 | |||
| Conservative | Sheena Munsami | 691 | |||
| Labour | Victoria Barlow | 482 | |||
| Labour | Tessa Cornell | 395 | |||
| Labour | Bill Lang | 380 | |||
| Green | David Booth | 311 | |||
| TUSC | Livvy Najman | 74 | |||
| Turnout | 3,458 | 42.0 | −29.3 | ||
| Liberal Democrat hold | Swing | ||||
| Liberal Democrat hold | Swing | ||||
| Liberal Democrat hold | Swing | ||||
| Party | Candidate | Votes | % | ± | |
|---|---|---|---|---|---|
| Liberal Democrat | David Bartolucci | 1,480 | |||
| Liberal Democrat | Vincent Galligan | 1,365 | |||
| Liberal Democrat | Ali Mirhashem | 1,192 | |||
| Labour | Emily Brothers | 662 | |||
| UKIP | Jake Grogan | 584 | |||
| Conservative | Charles Cornwell | 563 | |||
| Labour | Charles Mansell | 550 | |||
| Labour | Vic Paulino | 480 | |||
| Conservative | Nigel Cornwell | 463 | |||
| Conservative | Marie Grant | 412 | |||
| Green | Simon Honey | 369 | |||
| TUSC | Pauline Gorman | 90 | |||
| Turnout | 3,164 | 38.5 | −26.2 | ||
| Liberal Democrat hold | Swing | ||||
| Liberal Democrat hold | Swing | ||||
| Liberal Democrat hold | Swing | ||||
| Party | Candidate | Votes | % | ± | |
|---|---|---|---|---|---|
| Liberal Democrat | Ruth Dombey | 1,658 | |||
| Liberal Democrat | Marlene Heron | 1,539 | |||
| Liberal Democrat | Stephen Penneck | 1,410 | |||
| UKIP | Stewart Wood | 781 | |||
| Conservative | Alec Beeson | 742 | |||
| Conservative | Millie Shields | 659 | |||
| Conservative | Mukesh Rao | 516 | |||
| Labour | Kathy Allen | 502 | |||
| Labour | Ann Morrison | 420 | |||
| Labour | Dawn Lever | 416 | |||
| Turnout | 3,345 | 42.6 | −26.9 | ||
| Liberal Democrat hold | Swing | ||||
| Liberal Democrat hold | Swing | ||||
| Liberal Democrat hold | Swing | ||||
| Party | Candidate | Votes | % | ± | |
|---|---|---|---|---|---|
| Liberal Democrat | Richard Clifton | 1,380 | |||
| Liberal Democrat | Trish Fivey | 1,296 | |||
| Conservative | Tony Shields | 1,197 | |||
| Conservative | Jason Hughes | 1,089 | |||
| Conservative | Heather Howell | 1,075 | |||
| Liberal Democrat | John Phillips | 1,040 | |||
| UKIP | Jerry Wraith | 418 | |||
| Keep Our St Helier Hospital Party | Tiz North | 372 | |||
| Labour | Kathryn Brennan | 371 | |||
| Labour | Ronald Phillips | 307 | |||
| Labour | Patricia Simons | 302 | |||
| TUSC | Steve Appleton | 108 | |||
| Turnout | 3,297 | 43.2 | −25.8 | ||
| Liberal Democrat hold | Swing | ||||
| Liberal Democrat hold | Swing | ||||
| Conservative hold | Swing | ||||
| Party | Candidate | Votes | % | ± | |
|---|---|---|---|---|---|
| Liberal Democrat | Kevin Burke | 1,648 | |||
| Liberal Democrat | Wendy Mathys | 1,477 | |||
| Liberal Democrat | Simon Wales | 1,424 | |||
| Conservative | Richard Butt | 836 | |||
| Conservative | Mary Edwards | 815 | |||
| Conservative | Jonathan Pritchard | 712 | |||
| UKIP | Glen Roberts | 540 | |||
| Labour | Andy Cook | 501 | |||
| Labour | Maria Ponto | 448 | |||
| Labour | Margaret Sinclair | 406 | |||
| Keep Our St Helier Hospital Party | Frances Cornford | 358 | |||
| Turnout | 3,447 | 42.0 | −28.5 | ||
| Liberal Democrat hold | Swing | ||||
| Liberal Democrat hold | Swing | ||||
| Liberal Democrat hold | Swing | ||||
| Party | Candidate | Votes | % | ± | |
|---|---|---|---|---|---|
| Liberal Democrat | Callum Morton | 1,341 | |||
| Liberal Democrat | Colin Stears | 1,337 | |||
| Liberal Democrat | Naliben Patel | 1,199 | |||
| UKIP | Chris Howe | 754 | |||
| Conservative | Benjamin Scully | 513 | |||
| Conservative | Charles Manton | 487 | |||
| Labour | Deirdre Barry | 455 | |||
| Labour | Alex Milligan | 415 | |||
| Conservative | Marion Williams | 378 | |||
| Labour | Tony Thorpe | 365 | |||
| Green | Derek Coleman | 303 | |||
| Turnout | 4,936 | 40.1 | −26.7 | ||
| Liberal Democrat hold | Swing | ||||
| Liberal Democrat hold | Swing | ||||
| Liberal Democrat hold | Swing | ||||
| Party | Candidate | Votes | % | ± | |
|---|---|---|---|---|---|
| Liberal Democrat | Sunita Gordon | 1,363 | |||
| Liberal Democrat | Joyce Melican | 1,317 | |||
| Liberal Democrat | Marian Radford | 1,247 | |||
| Conservative | Elliot Colburn | 1,033 | |||
| Conservative | James McDermott-Hill | 865 | |||
| UKIP | Carole Lander | 823 | |||
| Conservative | Omonlyl Giwa | 737 | |||
| Labour | Victoria Rosenbaum | 470 | |||
| Labour | Richard Smith | 447 | |||
| Labour | Peter Turner | 415 | |||
| Green | Jim Duffy | 341 | |||
| Green | Penny Mouncey | 280 | |||
| Green | Phil Mouncey | 205 | |||
| Turnout | 3,696 | 44.0 | −27.0 | ||
| Liberal Democrat hold | Swing | ||||
| Liberal Democrat hold | Swing | ||||
| Liberal Democrat hold | Swing | ||||
| Party | Candidate | Votes | % | ± | |
|---|---|---|---|---|---|
| Liberal Democrat | Colin Hall | 1,593 | |||
| Liberal Democrat | Jayne McCoy | 1,558 | |||
| Liberal Democrat | Muhammad Sadiq | 1,221 | |||
| Conservative | Steven Ayres | 825 | |||
| UKIP | Marion Houghton | 694 | |||
| Conservative | Christopher Wortley | 649 | |||
| Conservative | Stephen Odunton | 571 | |||
| Keep Our St Helier Hospital Party | David Murray | 377 | |||
| Labour | David Towler | 374 | |||
| Labour | Susan Theobald | 358 | |||
| Green | Maeve Tomlinson | 301 | |||
| Labour | Jas Weir | 283 | |||
| Green | Rosa Rajendran | 274 | |||
| English Democrat | David Jeffreys | 110 | |||
| Turnout | 3,455 | 43.1 | −27.7 | ||
| Liberal Democrat hold | Swing | ||||
| Liberal Democrat hold | Swing | ||||
| Liberal Democrat hold | Swing | ||||
| Party | Candidate | Votes | % | ± | |
|---|---|---|---|---|---|
| Liberal Democrat | Margaret Court | 1,156 | |||
| Liberal Democrat | Hanna Zuchowska | 929 | |||
| Liberal Democrat | Jason Reynolds | 891 | |||
| UKIP | Graham Murray | 867 | |||
| Labour | Stephen McGrane | 705 | |||
| Labour | Bonnie Craven | 697 | |||
| Labour | Michael Craven | 633 | |||
| Conservative | James England | 436 | |||
| Green | Stephen Hart | 380 | |||
| Conservative | Jonathan Downer | 333 | |||
| Conservative | Peter Wootten | 314 | |||
| Turnout | 2,943 | 35.0 | −25.1 | ||
| Liberal Democrat hold | Swing | ||||
| Liberal Democrat hold | Swing | ||||
| Liberal Democrat hold | Swing | ||||
| Party | Candidate | Votes | % | ± | |
|---|---|---|---|---|---|
| Liberal Democrat | Arthur Hookway | 1,508 | |||
| Liberal Democrat | Richard Marston | 1,455 | |||
| Liberal Democrat | Paul Wingfield | 1,300 | |||
| Conservative | Stuart Mackay | 1,264 | |||
| Conservative | Simon Densley | 1,226 | |||
| Conservative | Gino Marotta | 1,146 | |||
| UKIP | Han-Ley Tang | 768 | |||
| Labour | John Evers | 474 | |||
| Labour | Hilary Hosking | 462 | |||
| Labour | David Hosking | 421 | |||
| Independent | Richard Edmonds | 185 | |||
| Turnout | 3,950 | 43.7 | −27.9 | ||
| Liberal Democrat hold | Swing | ||||
| Liberal Democrat hold | Swing | ||||
| Liberal Democrat gain from Conservative | Swing | ||||
Kingston and Surbiton is a constituency created in 1997 represented in the House of Commons of the UK Parliament since 2017 by Sir Ed Davey of the Liberal Democrats. Kingston and Surbiton has been considered relative to others a very marginal seat, as well as a swing seat, since 2010 as its winner's majority has not exceeded 6.6% of the vote since the 13.2% majority won in 2010 and the seat has changed hands twice since that year.
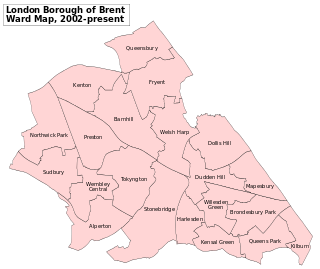
Brent London Borough Council in London, England is elected every four years. Since the last boundary changes in 2002, 63 councillors have been elected from 21 wards.
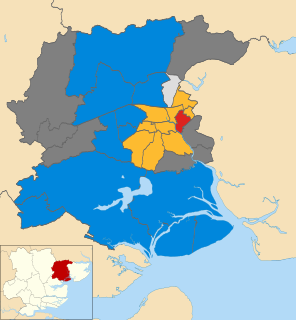
The 2006 Colchester Borough Council election took place on 4 May 2006 to elect members of Colchester Borough Council in Essex, England. One third of the council was up for election and the council stayed under no overall control.

Sutton London Borough Council in London, England is elected every four years.
Elections for the London Borough of Merton were held on 7 May 1998 to elect members of Merton London Borough Council in London, England. This was on the same day as other local elections in England and a referendum on the Greater London Authority; in the latter, Merton voted in favour of creating the Greater London Authority by 72.2% on a 37.6% turnout.

The 2010 Sandwell Metropolitan Borough Council election took place on 6 May 2010 to elect members of Sandwell Metropolitan Borough Council in the West Midlands, England. One third of the council was up for election and the Labour party stayed in overall control of the council.
The 2012 Fareham Borough Council elections took take place on 3 May 2012 to elect half the members of Fareham Borough Council in Hampshire, England. The Conservative Party are currently the largest party on the council.
Elections to Bromley Council were held on 22 May 2014.

The 2014 Enfield Council election took place on 22 May 2014 to elect members of Enfield London Borough Council in London, England. The whole council was up for election and the Labour party retained overall control of the council, increasing their majority over the Conservative party by five seats.

The 2014 Barking and Dagenham Council election took place on 23 May 2014 to elect members of Barking and Dagenham Council in England. This was on the same day as other local elections.

The 2014 Ealing Council election took place on 22 May 2014 to elect members of Ealing Council in London. This was on the same day as other local elections. The Labour Party retained overall control of the council, increasing their majority over the Conservative Party by 13 seats.
The 2000 Colchester Borough Council election took place on 4 May 2000 to elect members of Colchester Borough Council in Essex, England. One third of the council was up for election and the council stayed under no overall control.

The 2008 Colchester Borough Council election took place on 1 May 2008 to elect members of Colchester Borough Council in Essex, England. One third of the council was up for election and the Conservative party lost overall control of the council to no overall control.

The 2014 Havant Borough Council election took place on 22 May 2014 to elect members of Havant Borough Council in Hampshire, England. One third of the council was up for election and the Conservative party stayed in overall control of the council.

The 2014 Brent London Borough Council election took place on 22 May 2014 to elect members of Brent London Borough Council in London, England. The whole council was up for election and the Labour Party stayed in overall control of the council.

The 2014 St Helens Metropolitan Borough Council election took place on 22 May 2014 to elect members of St Helens Metropolitan Borough Council in Merseyside, England. One third of the council was up for election and the Labour party stayed in overall control of the council.

Local government elections took place in London on 3 May 2018, as part of the wider local elections in England.
The 2016 Sefton Metropolitan Borough Council election took place on 5 May 2016 to elect members of Sefton Metropolitan Borough Council in England. This was on the same day as other local elections. Sefton is split up into 22 wards, each electing 3 councillors, totalling up to 66 seats. Note, only 22 seats were up for election.
Council elections in England were held on Thursday 3 May 2018. Elections were held in all 32 London boroughs, 34 metropolitan boroughs, 67 district and borough councils and 17 unitary authorities. There were also direct elections for the mayoralties of Hackney, Lewisham, Newham, Tower Hamlets and Watford.

The 2018 Sutton Council election took place on 3 May 2018 to elect members of Sutton Council in London. This was on the same day as other local elections.
| Mayor of London | |
|---|---|
| London Assembly | |
| Inner London Education Authority | |
| Greater London Council | |
| London County Council | |
| Borough Councils | |
| Referendums | |