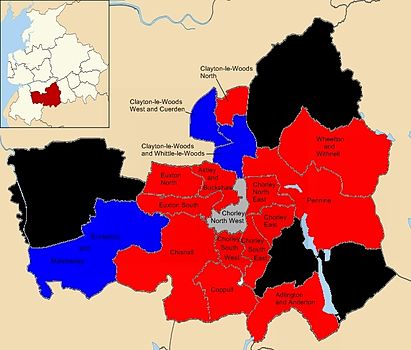
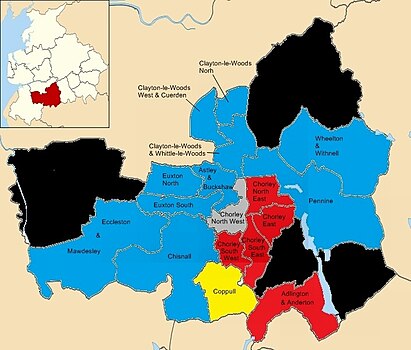
Results map
 |  |
The 2014 Chorley Borough Council election took place on 22 May 2014 to elect members of Chorley Borough Council in England. [1] This was on the same day as other local elections. One third of the council was up for election and the Labour party held control.
The Labour Party is a centre-left political party in the United Kingdom which has been described as an alliance of social democrats, democratic socialists and trade unionists. The party's platform emphasises greater state intervention, social justice and strengthening workers' rights.
After the election, the composition of the council was:
| Party | Seats | Current Council (2014) | ||||||||||||||||||||||||||||||||||||||||||||||||||
|---|---|---|---|---|---|---|---|---|---|---|---|---|---|---|---|---|---|---|---|---|---|---|---|---|---|---|---|---|---|---|---|---|---|---|---|---|---|---|---|---|---|---|---|---|---|---|---|---|---|---|---|---|
| 2010 | 2011 | 2012 | 2014 | |||||||||||||||||||||||||||||||||||||||||||||||||
| Labour | 15 | 20 | 24 | 32 | ||||||||||||||||||||||||||||||||||||||||||||||||
| Conservative | 27 | 23 | 20 | 13 | ||||||||||||||||||||||||||||||||||||||||||||||||
| Independent | 2 | 2 | 2 | 2 | ||||||||||||||||||||||||||||||||||||||||||||||||
| Lib Dems | 3 | 2 | 1 | 0 | ||||||||||||||||||||||||||||||||||||||||||||||||
| Party | Seats | Gains | Losses | Net gain/loss | Seats % | Votes % | Votes | +/− | |
|---|---|---|---|---|---|---|---|---|---|
| Labour | 13 | 8 | 0 | +8 | 76.5 | 46.2 | 13,908 | +7.2 | |
| Conservative | 3 | 0 | 7 | −7 | 17.6 | 32.2 | 9,706 | −6.8 | |
| Independent | 1 | 0 | 0 | 0 | 5.9 | 7.8 | 2,354 | −0.2 | |
| UKIP | 0 | 0 | 0 | 0 | 0 | 11.5 | 3,547 | +10.5 | |
| Liberal Democrat | 0 | 0 | 1 | −1 | 0 | 1.4 | 424 | −10.6 | |
| Green | 0 | 0 | 0 | 0 | 0 | 0.5 | 160 | +0.0 | |
 |  |
| Party | Candidate | Votes | % | ± | |
|---|---|---|---|---|---|
| Labour | Graham Dunn | 1,126 | 48.3 | −9.7 | |
| Conservative | Charlotte Woods | 607 | 26.1 | −3.9 | |
| UKIP | Hayden Clewlow | 520 | 22.3 | N/A | |
| Liberal Democrat | Philip William Pilling | 76 | 3.3 | −9.7 | |
| Majority | 519 | 22.3 | |||
| Turnout | 2,329 | 40.8 | |||
| Labour hold | Swing | ||||
| Party | Candidate | Votes | % | ± | |
|---|---|---|---|---|---|
| Labour | Matthew John Lynch | 788 | 47.1 | +1.1 | |
| Conservative | Alan Platt | 621 | 37.1 | −16.9 | |
| UKIP | Jeffrey Flinders Mallinson | 265 | 15.8 | N/A | |
| Majority | 167 | 10.0 | |||
| Turnout | 1,674 | 43.0 | |||
| Labour gain from Conservative | Swing | +9.0 | |||
| Party | Candidate | Votes | % | ± | |
|---|---|---|---|---|---|
| Labour | Alan Whittaker | 848 | 57.1 | +24.1 | |
| Conservative | Harold Heaton | 637 | 42.9 | −8.1 | |
| Majority | 211 | 14.2 | |||
| Turnout | 1,485 | 45.7 | |||
| Labour gain from Conservative | Swing | ||||
| Party | Candidate | Votes | % | ± | |
|---|---|---|---|---|---|
| Labour | Hasina Khan | 1,008 | 56.9 | −1.1 | |
| UKIP | Christopher Suart | 435 | 24.6 | N/A | |
| Conservative | Alan Cullens | 223 | 12.6 | −11.4 | |
| Independent | Melville George Coombes | 97 | 5.5 | −14.5 | |
| Green | Anne Calderbank | 18 | 1.0 | N/A | |
| Majority | 573 | 32.4 | |||
| Turnout | 1,771 | 36.0 | |||
| Labour hold | Swing | ||||
| Party | Candidate | Votes | % | ± | |
|---|---|---|---|---|---|
| Labour | Alistair William Morwood | 1,162 | 69.1 | −2 | |
| Conservative | Matt Hansford | 519 | 30.9 | −15 | |
| Majority | 643 | 38.2 | |||
| Turnout | 1,681 | 35.0 | |||
| Labour hold | Swing | +7 | |||
| Party | Candidate | Votes | % | ± | |
|---|---|---|---|---|---|
| Independent | Ralph Snape | 1,787 | 72.5 | −10.5 | |
| Labour | Aaron Beaver | 400 | 16.2 | N/A | |
| Conservative | Peter Malpas | 276 | 11.2 | −0.9 | |
| Majority | 1,387 | 52 | |||
| Turnout | 2,463 | 52.2 | |||
| Independent hold | Swing | ||||
| Party | Candidate | Votes | % | ± | |
|---|---|---|---|---|---|
| Labour | Mrs. Beverley Murray | 968 | 49.0 | +3.6 | |
| Conservative | Mrs. Sarah Louise Kiley | 504 | 25.5 | −9.1 | |
| UKIP | David John McManus | 392 | 19.8 | N/A | |
| Green | Alistair James Straw | 66 | 3.3 | −1.0 | |
| Liberal Democrat | David Porter | 47 | 2.4 | −13.3 | |
| Majority | 464 | 23.5 | |||
| Turnout | 1,977 | 36.2 | |||
| Labour hold | Swing | ||||
| Party | Candidate | Votes | % | ± | |
|---|---|---|---|---|---|
| Labour | Roy Lees | 1,184 | 67.3 | +20.3 | |
| Conservative | Dominic Keiran Jewell | 575 | 32.7 | −0.3 | |
| Majority | 609 | 34.6 | |||
| Turnout | 1,759 | 30.7 | |||
| Labour hold | Swing | +10.6 | |||
| Party | Candidate | Votes | % | ± | |
|---|---|---|---|---|---|
| Conservative | Eric Bell | 1,409 | 58.6 | +3.6 | |
| Labour | Dan Croft | 703 | 41.4 | +17.4 | |
| Liberal Democrat | Glenda Charlesworth | 205 | 2.4 | −18.6 | |
| Majority | 706 | 17.3 | |||
| Turnout | 2,317 | 36.0 | |||
| Conservative hold | Swing | ||||
| Party | Candidate | Votes | % | ± | |
|---|---|---|---|---|---|
| Labour | Charlie Bromilow | 732 | 58.4 | +24.4 | |
| Conservative | Chris Morris | 480 | 41.6 | +3.6 | |
| UKIP | Raymond McGrady | 458 | 19.8 | N/A | |
| Liberal Democrat | Stephen John Fenn | 96 | 2.4 | −25.6 | |
| Green | Mark Lee | 76 | 9.3 | N/A | |
| Majority | 289 | 17 | +8 | ||
| Turnout | 1,711 | 34.5 | |||
| Labour gain from Conservative | Swing | +4 | |||
| Party | Candidate | Votes | % | ± | |
|---|---|---|---|---|---|
| Conservative | Mick Muncaster | 736 | 51.2 | −3.8 | |
| Labour | Paul Clark | 701 | 48.8 | +3.8 | |
| Majority | 35 | 2.4 | |||
| Turnout | 1,437 | 43.0 | |||
| Conservative hold | Swing | −3.8 | |||
| Party | Candidate | Votes | % | ± | |
|---|---|---|---|---|---|
| Labour | Richard Toon | 885 | 57.3 | +24.1 | |
| Independent | Kenneth William Ball | 470 | 16.5 | N/A | |
| UKIP | Mark Smith | 383 | 19.8 | N/A | |
| Conservative | Tom Norris | 181 | 11.3 | −5.7 | |
| Majority | 462 | 26.1 | |||
| Turnout | 1,919 | 39.0 | |||
| Labour gain from Liberal Democrat | Swing | ||||
| Party | Candidate | Votes | % | ± | |
|---|---|---|---|---|---|
| Conservative | Keith Iddon | 944 | 46.6 | −11.4 | |
| Labour | Stan Ely | 741 | 42.2 | +0.2 | |
| UKIP | Richard George Croll | 402 | 11.1 | N/A | |
| Majority | 203 | 4.4 | −10 | ||
| Turnout | 2,164 | 43.0 | |||
| Conservative hold | Swing | −5.8 | |||
| Party | Candidate | Votes | % | ± | |
|---|---|---|---|---|---|
| Labour | Mike Handley | 692 | 53.8 | +6.7 | |
| Conservative | Robert Aron Wilding | 570 | 34.9 | −12.1 | |
| UKIP | Stuart Rickaby | 289 | 11.4 | N/A | |
| Majority | 122 | 18.9 | |||
| Turnout | 1,551 | 44.3 | |||
| Labour gain from Conservative | Swing | +9.4 | |||
| Party | Candidate | Votes | % | ± | |
|---|---|---|---|---|---|
| Labour | Mark Andrew Jarnell | 572 | 40.2 | +13.8 | |
| Conservative | Debra Platt | 569 | 40.0 | −25.1 | |
| UKIP | David Smithies | 283 | 19.9 | N/A | |
| Majority | 3 | 0.2 | |||
| Turnout | 1,424 | 44.7 | |||
| Labour gain from Conservative | Swing | +19.5 | |||
| Party | Candidate | Votes | % | ± | |
|---|---|---|---|---|---|
| Labour | Gordon France | 354 | 44.3 | +6.3 | |
| Conservative | Marie Elizabeth Gray | 325 | 40.7 | −21.3 | |
| UKIP | Tom Shorrock | 120 | 15.0 | N/A | |
| Majority | 29 | 3.6 | |||
| Turnout | 799 | 46.0 | |||
| Labour gain from Conservative | Swing | ||||
| Party | Candidate | Votes | % | ± | |
|---|---|---|---|---|---|
| Labour | Margaret Mary France | 1,044 | 66.3 | +19.1 | |
| Conservative | Alison Marie Hansford | 530 | 33.7 | −19.1 | |
| Majority | 514 | 32.7 | |||
| Turnout | 1,574 | 49.4 | |||
| Labour gain from Conservative | Swing | +19.1 | |||

Chorley is a town in Lancashire, England, 8.1 miles (13 km) north of Wigan, 10.8 miles (17 km) south west of Blackburn, 11 miles (18 km) north west of Bolton, 12 miles (19 km) south of Preston and 19.5 miles (31 km) north west of Manchester. The town's wealth came principally from the cotton industry.

The Borough of Chorley is a local government district with borough status in Lancashire, England. The population of the Borough at the 2011 census was 104,155. It is named after its largest settlement, the town of Chorley.

Chorley is a constituency represented in the House of Commons of the UK Parliament since 1997 by Sir Lindsay Hoyle of the Labour Party.
One third of Chorley Borough Council is elected each year, followed by one year without election.
Elections to Chorley Borough Council were held on 7 May 1998. One third of the council was up for election and the Labour party kept overall control of the council.
Elections to Chorley Borough Council were held on 6 May 1999. One third of the council was up for election and the Labour party kept overall control of the council.
Elections to Chorley Borough Council were held on 4 May 2000. One third of the council was up for election and the Labour party lost overall control of the council to no overall control.
Elections to Chorley Borough Council were held on 2 May 2002. The whole council was up for election with boundary changes since the last election in 2000 reducing the number of seats by one. The council stayed under no overall control.
Elections to Chorley Borough Council were held on 1 May 2003. One third of the council was up for election and the council stayed under no overall control.
Elections to Chorley Borough Council were held on 10 June 2004. One third of the council was up for election and the council stayed under no overall control.
Elections to Chorley Borough Council were held on 4 May 2006. One third of the council was up for election and the Conservative party gained overall control of the council from no overall control.

Heath Charnock is a small village and civil parish of the Borough of Chorley in Lancashire, England. According to the United Kingdom Census 2001 it has a population of 2,065, reducing to 2,026 at the 2011 Census.
Elections to Chorley Borough Council were held on 3 May 2007. One third of the council was up for election and the Conservative party retained overall control.
The Chorley Borough Council elections took place on 1 May 2008. One third of the council was up for election.
Elections to Chorley Borough Council were held on 6 May 2010. One third of the council was up for election and the Conservative party held overall control.
Elections to Chorley Borough Council were held on 3 May 2012. One third of the council was up for election and the Labour party won majority control from the Conservative-Liberal Democrat Coalition. Labour gaining control of this council was notable as David Cameron visited the town in 2006 when the Conservative Party gained control saying "this is the beginning." Nick Robinson of the BBC asked on the election coverage, "then what is it now?"
The Chorley by-election was a Parliamentary by-election. It returned one Member of Parliament to the House of Commons of the United Kingdom, elected by the first past the post voting system. Although it was a safe Unionist seat which was held, the reduction in the Unionist majority was notable.

The 2014 United Kingdom local elections were held on 22 May 2014. Usually these elections are held on the first Thursday in May but were postponed to coincide with the 2014 European Parliament Elections. Direct elections were held for all 32 London boroughs, all 36 metropolitan boroughs, 74 district/borough councils, 20 unitary authorities and various mayoral posts in England and elections to the new councils in Northern Ireland.
The 2015 Chorley Borough Council election took place on 7 May 2015 to elect members of Chorley Borough Council in England. This was on the same day as other local elections.
The 2016 Chorley Borough Council election took place on 5 May 2016 to elect members of Chorley Borough Council in England. This was on the same day as other local elections.