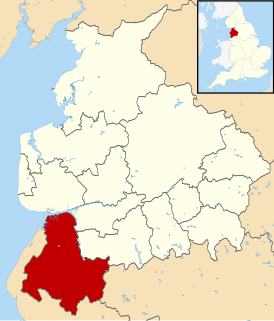
The 2006 West Lancashire District Council election took place on 4 May 2006 to elect members of West Lancashire District Council in Lancashire, England. One third of the council was up for election and the Conservative party stayed in overall control of the council. [1]
West Lancashire is a non-metropolitan district with the status of a borough in Lancashire, England. Its council is based in Ormskirk. The other town in the borough is Skelmersdale. The population of the District taken at the 2011 census was 110,685. The district was formed in 1974 under the Local Government Act 1972, as a merger of Ormskirk and Skelmersdale and Holland urban districts along with part of West Lancashire Rural District and part of the former Wigan Rural District.
Lancashire is a ceremonial county in North West England. The administrative centre is Preston. The county has a population of 1,449,300 and an area of 1,189 square miles (3,080 km2). People from Lancashire are known as Lancastrians.
England is a country that is part of the United Kingdom. It shares land borders with Wales to the west and Scotland to the north-northwest. The Irish Sea lies west of England and the Celtic Sea lies to the southwest. England is separated from continental Europe by the North Sea to the east and the English Channel to the south. The country covers five-eighths of the island of Great Britain, which lies in the North Atlantic, and includes over 100 smaller islands, such as the Isles of Scilly and the Isle of Wight.
After the election, the composition of the council was:
Party | Seats | ± | |
---|---|---|---|
Conservative | 33 | +3 | |
Labour | 22 | -3 |
Before the election the Conservatives ran the council with a 4-seat majority over the Labour party. [3] Most seats only had Conservative and Labour party candidates, with no Liberal Democrats standing in the election. [3]
The Labour Party is a centre-left political party in the United Kingdom that has been described as an alliance of social democrats, democratic socialists and trade unionists. The party's platform emphasises greater state intervention, social justice and strengthening workers' rights.
The Liberal Democrats are a liberal political party in the United Kingdom. It is currently led by Vince Cable. They have 11 Members of Parliament in the House of Commons, 96 members of the House of Lords, one member of the European Parliament, five Members of the Scottish Parliament and one member in the Welsh Assembly and London Assembly. At the height of its influence, the party formed a coalition government with the Conservative Party from 2010 to 2015 with its leader Nick Clegg serving as Deputy Prime Minister.
The Conservatives focused their campaign on crime and the environment, while targeting the Labour held wards of Burscough East, Burscough West and Scott. [3] However Labour targeted the Conservative wards of Derby, Newburgh and Parbold, while criticising the Conservatives for holding a failed vote on transferring council housing. [3]
Burscough is a small town and civil parish within West Lancashire in North West England, to the north of Ormskirk and Skelmersdale.The parish also includes the hamlet of Tarlscough and the Martin Mere Wetland Centre. The population taken at the 2011 Census was 9,182.
Newburgh is a rural village and civil parish in Lancashire, England, 3 miles (5 km) from Skelmersdale and 5 miles (8 km) from Ormskirk. Its population in 2011 was 1,056.
Parbold is a village and civil parish in West Lancashire, England.
The results saw the Conservatives increase their control of the council, which they had held since 2002. [4] They gained 3 seats from Labour in Burscough East, Burscough West and Scott wards, [5] with the Labour leader on the council, Alan Bullen, saying that it had "not been a good night". [4]
Overall turnout in the election was 32.2%, which was up on 2003 but down from 2004. [4]
Voter turnout is the percentage of eligible voters who cast a ballot in an election. Eligibility varies by country, and the voting-eligible population should not be confused with the total adult population. Age and citizenship status are often among the criteria used to determine eligibility, but some countries further restrict eligibility based on sex, race, or religion.
Party | Seats | Gains | Losses | Net gain/loss | Seats % | Votes % | Votes | +/− | |
---|---|---|---|---|---|---|---|---|---|
Conservative | 13 | 3 | 0 | +3 | 72.2 | 59.6 | 13,649 | +12.2% | |
Labour | 5 | 0 | 3 | -3 | 27.8 | 34.4 | 7,869 | -2.5% | |
Green | 0 | 0 | 0 | 0 | 0 | 4.5 | 1,021 | +1.2% | |
Independent | 0 | 0 | 0 | 0 | 0 | 1.5 | 344 | -10.2% | |
Clause 28 | 0 | 0 | 0 | 0 | 0 | 0.1 | 16 | +0.1% |
Party | Candidate | Votes | % | ± | |
---|---|---|---|---|---|
Labour | Ian Duffy | 774 | 68.3 | +10.9 | |
Conservative | Richard Shepherd | 360 | 31.7 | +10.9 | |
Majority | 414 | 36.6 | +1.1 | ||
Turnout | 1,134 | 23.1 | -10.3 | ||
Labour hold | Swing |
Party | Candidate | Votes | % | ± | |
---|---|---|---|---|---|
Conservative | David O'Toole | 1,271 | 75.2 | -2.2 | |
Labour | Gordon Rankin | 419 | 24.8 | +2.2 | |
Majority | 852 | 50.4 | -4.4 | ||
Turnout | 1,690 | 36.8 | -12.6 | ||
Conservative hold | Swing |
Party | Candidate | Votes | % | ± | |
---|---|---|---|---|---|
Conservative | Ian Grant | 912 | 79.9 | +1.9 | |
Labour | Derek Latham | 230 | 20.1 | -1.9 | |
Majority | 682 | 59.8 | +3.8 | ||
Turnout | 1,142 | 36.3 | +8.0 | ||
Conservative hold | Swing |
Party | Candidate | Votes | % | ± | |
---|---|---|---|---|---|
Conservative | Ruth Melling | 833 | 66.2 | +5.6 | |
Labour | Mary Whitby | 426 | 33.8 | -5.6 | |
Majority | 407 | 32.4 | +11.2 | ||
Turnout | 1,259 | 38.0 | -11.7 | ||
Conservative gain from Labour | Swing | ||||
Party | Candidate | Votes | % | ± | |
---|---|---|---|---|---|
Conservative | David Griffiths | 821 | 55.9 | +3.7 | |
Labour | Kathryn Anderson | 649 | 44.1 | -3.7 | |
Majority | 172 | 14.8 | +10.4 | ||
Turnout | 1,470 | 37.0 | -4.6 | ||
Conservative gain from Labour | Swing | ||||
Party | Candidate | Votes | % | ± | |
---|---|---|---|---|---|
Conservative | Paul Greenall | 867 | 57.9 | +12.4 | |
Labour | Jonathan Sockett | 394 | 26.3 | +1.0 | |
Green | Anne Doyle | 237 | 15.8 | +9.1 | |
Majority | 473 | 31.6 | +11.4 | ||
Turnout | 1,498 | 32.2 | -14.8 | ||
Conservative hold | Swing |
Party | Candidate | Votes | % | ± | |
---|---|---|---|---|---|
Conservative | Christopher Ashcroft | 844 | 85.0 | +21.2 | |
Labour | Christopher Mawdsley | 149 | 15.0 | +15.0 | |
Majority | 695 | 70.0 | +42.4 | ||
Turnout | 993 | 31.4 | -11.4 | ||
Conservative hold | Swing |
Party | Candidate | Votes | % | ± | |
---|---|---|---|---|---|
Conservative | Valerie Hopley | 1,062 | 62.6 | +1.2 | |
Labour | Charles Cavaghan | 409 | 24.1 | -5.3 | |
Green | John Watt | 225 | 13.3 | +4.1 | |
Majority | 653 | 38.5 | +6.5 | ||
Turnout | 1,696 | 36.9 | -12.3 | ||
Conservative hold | Swing |
Party | Candidate | Votes | % | ± | |
---|---|---|---|---|---|
Labour | Patricia Carson | 505 | 79.7 | -2.6 | |
Conservative | Carolyn Evans | 129 | 20.3 | +2.6 | |
Majority | 376 | 59.4 | -5.2 | ||
Turnout | 634 | 21.8 | -7.4 | ||
Labour hold | Swing |
Party | Candidate | Votes | % | ± | |
---|---|---|---|---|---|
Conservative | Edward Pope | 620 | 79.2 | +7.0 | |
Labour | Jacqueline Citarella | 163 | 20.8 | -7.0 | |
Majority | 457 | 58.4 | +14.0 | ||
Turnout | 783 | 45.1 | |||
Conservative hold | Swing |
Party | Candidate | Votes | % | ± | |
---|---|---|---|---|---|
Conservative | John Baldock | 620 | 56.5 | +7.6 | |
Independent | Joan Draper | 243 | 22.2 | -14.0 | |
Labour | Sarah Keegan | 126 | 11.5 | -3.3 | |
Green | Nicholas Kemp | 108 | 9.8 | +9.8 | |
Majority | 377 | 34.3 | +21.6 | ||
Turnout | 1,097 | 22.0 | -2.7 | ||
Conservative hold | Swing |
Party | Candidate | Votes | % | ± | |
---|---|---|---|---|---|
Conservative | Robert Collinson | 980 | 74.5 | +15.7 | |
Labour | Clare Gillard | 335 | 25.5 | +11.1 | |
Majority | 645 | 49.0 | +17.0 | ||
Turnout | 1,315 | 41.2 | +0.9 | ||
Conservative hold | Swing |
Party | Candidate | Votes | % | ± | |
---|---|---|---|---|---|
Conservative | William Cropper | 853 | 69.5 | -2.5 | |
Labour | Shan Annis | 209 | 17.0 | -11.0 | |
Green | Geoffery Barnes | 166 | 13.5 | +13.5 | |
Majority | 644 | 52.5 | +8.5 | ||
Turnout | 1,228 | 39.7 | +13.1 | ||
Conservative hold | Swing |
Party | Candidate | Votes | % | ± | |
---|---|---|---|---|---|
Conservative | David Meadows | 863 | 47.2 | -0.9 | |
Labour | Noel Delaney | 650 | 35.6 | -2.2 | |
Green | Maurice George | 197 | 10.8 | -3.3 | |
Independent | Kenneth Walters | 101 | 5.5 | +5.5 | |
Clause 28 | David Braid | 16 | 0.9 | +0.9 | |
Majority | 213 | 11.6 | +1.3 | ||
Turnout | 1,827 | 39.4 | -7.6 | ||
Conservative gain from Labour | Swing | ||||
Party | Candidate | Votes | % | ± | |
---|---|---|---|---|---|
Labour | David McKay | 922 | 76.0 | +12.4 | |
Conservative | Susan Cropper | 291 | 24.0 | +4.3 | |
Majority | 631 | 52.0 | +8.1 | ||
Turnout | 1,213 | 23.7 | -10.2 | ||
Labour hold | Swing |
Party | Candidate | Votes | % | ± | |
---|---|---|---|---|---|
Labour | Robert Pendleton | 482 | 64.4 | -11.9 | |
Conservative | Irene O'Donnell | 179 | 23.9 | +0.2 | |
Green | Martin Lowe | 88 | 11.7 | +11.7 | |
Majority | 303 | 40.5 | -12.1 | ||
Turnout | 749 | 21.4 | +5.1 | ||
Labour hold | Swing |
Party | Candidate | Votes | % | ± | |
---|---|---|---|---|---|
Conservative | James Kay | 1,371 | 86.0 | +22.1 | |
Labour | Pauline Roughley | 223 | 14.0 | +14.0 | |
Majority | 1,148 | 72.0 | +44.2 | ||
Turnout | 1,594 | 35.3 | -15.2 | ||
Conservative hold | Swing |
Party | Candidate | Votes | % | ± | |
---|---|---|---|---|---|
Labour | David Phythian | 804 | 51.0 | +3.0 | |
Conservative | Ruth Pollock | 773 | 49.0 | +13.5 | |
Majority | 31 | 2.0 | -10.5 | ||
Turnout | 1,577 | 31.5 | -13.7 | ||
Labour hold | Swing |
The 2002 St Helens Metropolitan Borough Council election took place on 2 May 2002 to elect members of St Helens Metropolitan Borough Council in Merseyside, England. One third of the council was up for election and the Labour party stayed in overall control of the council.
The 2003 St Helens Metropolitan Borough Council election took place on 1 May 2003 to elect members of St Helens Metropolitan Borough Council in Merseyside, England. One third of the council was up for election and the Labour party stayed in overall control of the council.
The 2002 West Lancashire District Council election took place on 2 May 2002 to elect members of West Lancashire District Council in Lancashire, England. The whole council was up for election with boundary changes since the last election in 2000 reducing the number of seats by 1. The Conservative party gained overall control of the council from Labour.
The 2003 West Lancashire District Council election took place on 1 May 2003 to elect members of West Lancashire District Council in Lancashire, England. One third of the council was up for election and the Conservative party stayed in overall control of the council.
The 2004 West Lancashire District Council election took place on 10 June 2004 to elect members of West Lancashire District Council in Lancashire, England. One third of the council was up for election and the Conservative party stayed in overall control of the council.
The 1998 Brent London Borough Council election took place on 7 May 1998 to elect members of Brent London Borough Council in London, England. The whole council was up for election and the Labour party gained overall control of the council from no overall control.
Local elections were held in the United Kingdom on 6 May 1976. Elections were for one third of the seats on Metropolitan borough councils and for all seats on Non-Metropolitan district councils in England; and for all seats on the Welsh district councils.
The 2008 West Lancashire District Council election took place on 1 May 2008 to elect members of West Lancashire District Council in Lancashire, England. One third of the council was up for election and the Conservative party stayed in overall control of the council.
The 2007 Thurrock Council election took place on 3 May 2007 to elect members of Thurrock Council in Essex, England. One third of the council was up for election and the Conservative party lost overall control of the council to no overall control.
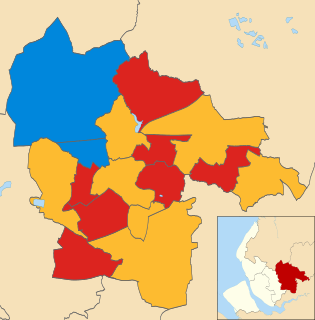
The 2007 St Helens Metropolitan Borough Council election took place on 3 May 2007 to elect members of St Helens Metropolitan Borough Council in Merseyside, England. One third of the council was up for election and the council stayed under no overall control.
The 1999 Lichfield District Council election took place on 6 May 1999 to elect members of Lichfield District Council in Staffordshire, England. The whole council was up for election and the Conservative party gained overall control of the council from the Labour party.
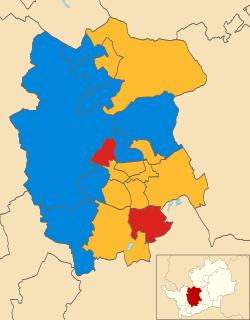
The 2006 St Albans City and District Council election took place on 4 May 2006 to elect members of St Albans District Council in Hertfordshire, England. One third of the council was up for election and the Liberal Democrats gained overall control of the council from no overall control.
The 2006 Halton Borough Council election took place on 4 May 2006 to elect members of Halton Unitary Council in Cheshire, England. One third of the council was up for election and the Labour party stayed in overall control of the council.
The 2006 Southend-on-Sea Council election took place on 4 May 2006 to elect members of Southend-on-Sea Unitary Council in Essex, England. One third of the council was up for election and the Conservative party stayed in overall control of the council.
The 2007 West Lancashire District Council election took place on 3 May 2007 to elect members of West Lancashire District Council in Lancashire, England. One third of the council was up for election and the Conservative party stayed in overall control of the council.
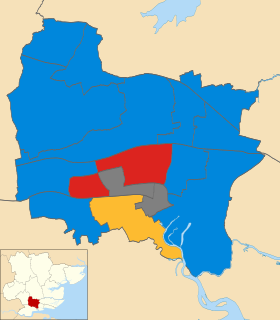
The 2010 West Lancashire Borough Council election took place on 6 May 2010 to elect members of West Lancashire Borough Council in Lancashire, England. One third of the council was up for election and the Conservative party stayed in overall control of the council.
The 2006 Basildon District Council election took place on 4 May 2006 to elect members of Basildon District Council in Essex, England. One third of the council was up for election and the Conservative party stayed in overall control of the council.
The 2007 Basildon District Council election took place on 3 May 2007 to elect members of Basildon District Council in Essex, England. One third of the council was up for election and the Conservative party stayed in overall control of the council.
The 2011 Sunderland Council election took place on 5 May 2011 to elect members of Sunderland Metropolitan Borough Council in Tyne and Wear, England. One third of the council was up for election and the Labour party stayed in overall control of the council.
The 2007 West Oxfordshire District Council election took place on 3 May 2007 to elect members of West Oxfordshire District Council in Oxfordshire, England. One third of the council was up for election and the Conservative party stayed in overall control of the council.