Elections to Wolverhampton City Council were held on 3 May 2006 in Wolverhampton, England. One third of the council was up for election and the Labour Party kept overall control of the council.
Wolverhampton is a city and metropolitan borough in the West Midlands, England. At the 2011 census, it had a population of 249,470. The demonym for people from the city is 'Wulfrunian'.
England is a country that is part of the United Kingdom. It shares land borders with Wales to the west and Scotland to the north-northwest. The Irish Sea lies west of England and the Celtic Sea lies to the southwest. England is separated from continental Europe by the North Sea to the east and the English Channel to the south. The country covers five-eighths of the island of Great Britain, which lies in the North Atlantic, and includes over 100 smaller islands, such as the Isles of Scilly and the Isle of Wight.
The Labour Party is a centre-left political party in the United Kingdom that has been described as an alliance of social democrats, democratic socialists and trade unionists. The party's platform emphasises greater state intervention, social justice and strengthening workers' rights.
Prior to the election, the composition of the council was
The Conservative Party, officially the Conservative and Unionist Party, is a centre-right political party in the United Kingdom. The governing party since 2010, it is the largest in the House of Commons, with 313 Members of Parliament, and also has 249 members of the House of Lords, 18 members of the European Parliament, 31 Members of the Scottish Parliament, 12 members of the Welsh Assembly, eight members of the London Assembly and 8,916 local councillors.
The Liberal Democrats are a centrist, liberal political party in the United Kingdom. It is currently led by Vince Cable. It has 11 Members of Parliament in the House of Commons, 96 members of the House of Lords, one member of the European Parliament, five Members of the Scottish Parliament and one member in the Welsh Assembly and London Assembly. At the height of its influence, the party served as junior partners in a coalition government with the Conservative Party from 2010 to 2015.
After the election, the composition of the council was
The Liberal Party is a British political party that was founded in 1989 by members of the original Liberal Party opposed to its merger with the Social Democratic Party (SDP) to form the Liberal Democrats. The party holds seven local council seats.
Party | Candidate | Votes | % | ± | |
---|---|---|---|---|---|
Labour | Stephen Simkins | 1185 | 43.41 | ||
Conservative | Ann Modi | 710 | 26.01 | ||
Independent | Tom Fellows | 600 | 21.98 | ||
Liberal Democrat | Roger Gray | 217 | 7.95 | ||
Majority | 475 | 17.40 | |||
Turnout | 2,730 | 29.68 | |||
Labour hold | Swing | ||||
Party | Candidate | Votes | % | ± | |
---|---|---|---|---|---|
Labour | Philip Page | 1318 | 43.13 | ||
Conservative | Gill Fellows | 970 | 31.74 | ||
UKIP | Kevin Simmons | 325 | 10.63 | ||
Liberal Democrat | Frances Heap | 242 | 7.92 | ||
Green | Eddie Clarke | 195 | 6.38 | ||
Majority | 348 | 11.39 | |||
Turnout | 3,056 | 33.87 | |||
Labour hold | Swing | ||||
Party | Candidate | Votes | % | ± | |
---|---|---|---|---|---|
Labour | Judith Rowley | 2314 | 71.20 | ||
Conservative | John Corns | 625 | 19.23 | ||
Liberal Democrat | Edward Pringle | 292 | 8.98 | ||
Majority | 1689 | 51.97 | |||
Turnout | 3,250 | 37.58 | |||
Labour hold | Swing | ||||
Party | Candidate | Votes | % | ± | |
---|---|---|---|---|---|
Conservative | Neville Patten | 1571 | 47.06 | ||
Labour | Paul Allen | 1154 | 34.57 | ||
Liberal Democrat | James Lindly | 569 | 17.05 | ||
Majority | 417 | 12.49 | |||
Turnout | 3,338 | 37.00 | |||
Conservative gain from Labour | Swing | ||||
Party | Candidate | Votes | % | ± | |
---|---|---|---|---|---|
Labour | Paul Sweet | 1187 | 55.60 | ||
Conservative | Andrew Dawson | 562 | 26.32 | ||
Liberal Democrat | Ian Jenkins | 364 | 17.05 | ||
Majority | 625 | 29.27 | |||
Turnout | 2,135 | 23.62 | |||
Labour hold | Swing | ||||
Party | Candidate | Votes | % | ± | |
---|---|---|---|---|---|
Labour | Keith Inston | 1351 | 52.45 | ||
Conservative | Peter Dobb | 733 | 28.45 | ||
Liberal Democrat | Ann Whitehouse | 472 | 18.32 | ||
Majority | 618 | 23.99 | |||
Turnout | 2,576 | 28.83 | |||
Labour hold | Swing | ||||
Party | Candidate | Votes | % | ± | |
---|---|---|---|---|---|
Labour | Andrew Johnson | 1860 | 64.03 | ||
Conservative | Brian Fellows | 581 | 20.00 | ||
Liberal Democrat | Eileen Birch | 444 | 15.28 | ||
Majority | 1279 | 44.03 | |||
Turnout | 2,905 | 30.49 | |||
Labour hold | Swing | ||||
Party | Candidate | Votes | % | ± | |
---|---|---|---|---|---|
Labour | Steven Evans | 1488 | 47.03 | ||
Conservative | Carol Bourne | 1159 | 36.63 | ||
Liberal Democrat | Stephen Birch | 496 | 15.68 | ||
Majority | 329 | 10.40 | |||
Turnout | 3,164 | 35.45 | |||
Labour hold | Swing | ||||
Party | Candidate | Votes | % | ± | |
---|---|---|---|---|---|
Labour | Man Mohan Passi | 2033 | 51.30 | ||
Conservative | John Mellor | 1440 | 36.34 | ||
Liberal Democrat | Bryan Lewis | 472 | 11.91 | ||
Majority | 593 | 14.96 | |||
Turnout | 3,963 | 44.04 | |||
Labour hold | Swing | ||||
Party | Candidate | Votes | % | ± | |
---|---|---|---|---|---|
Labour | Caroline Siarkiewicz | 937 | 42.61 | ||
Liberal | Colin Hallmark | 489 | 22.24 | ||
Conservative | Lucinda Turner | 484 | 22.01 | ||
Liberal Democrat | David Jack | 274 | 12.46 | ||
Majority | 448 | 20.37 | |||
Turnout | 2,199 | 28.43 | |||
Labour hold | Swing | ||||
Party | Candidate | Votes | % | ± | |
---|---|---|---|---|---|
Conservative | Christine Mills | 2306 | 60.16 | ||
Labour | Jagnandan Ghera | 849 | 22.15 | ||
Liberal Democrat | Jessica Pringle | 639 | 16.67 | ||
Majority | 1457 | 38.01 | |||
Turnout | 3,833 | 40.85 | |||
Conservative hold | Swing | ||||
Party | Candidate | Votes | % | ± | |
---|---|---|---|---|---|
Labour | George Lockett | 1335 | 48.37 | ||
Conservative | Ian Lucas | 1013 | 36.70 | ||
Liberal Democrat | John Steatham | 400 | 14.49 | ||
Majority | 322 | 11.67 | |||
Turnout | 2,760 | 30.02 | |||
Labour hold | Swing | ||||
Party | Candidate | Votes | % | ± | |
---|---|---|---|---|---|
Labour | Manohar Minhas | 1405 | 36.61 | ||
Liberal Democrat | Robin Lawrence | 1277 | 33.27 | ||
Conservative | Martin Berrington | 1129 | 29.42 | ||
Majority | 128 | 3.34 | |||
Turnout | 3,838 | 44.74 | |||
Labour hold | Swing | ||||
Party | Candidate | Votes | % | ± | |
---|---|---|---|---|---|
Conservative | Patricia Patten | 2503 | 56.69 | ||
Labour | Ricky Chima | 1191 | 36.98 | ||
Liberal Democrat | June Hemsley | 686 | 15.54 | ||
Majority | 1312 | 29.72 | |||
Turnout | 4,415 | 44.05 | |||
Conservative hold | Swing | ||||
Party | Candidate | Votes | % | ± | |
---|---|---|---|---|---|
Liberal | Malcolm Gwinnett | 1106 | 34.27 | ||
Labour | William Langford | 904 | 28.01 | ||
Liberal Democrat | Sandra Terry | 785 | 24.33 | ||
Conservative | Robert Green | 408 | 12.64 | ||
Majority | 202 | 6.26 | |||
Turnout | 3,227 | 37.00 | |||
Liberal gain from Liberal Democrat | Swing | ||||
Party | Candidate | Votes | % | ± | |
---|---|---|---|---|---|
Labour | Tersaim Singh | 1311 | 62.40 | ||
Liberal Democrat | Alexandra Lawrence | 408 | 19.42 | ||
Conservative | Lionel Berry | 372 | 17.71 | ||
Majority | 903 | 42.98 | |||
Turnout | 2,101 | 28.82 | |||
Labour hold | Swing | ||||
Party | Candidate | Votes | % | ± | |
---|---|---|---|---|---|
Conservative | Barry Findlay | 2654 | 66.95 | ||
Labour | David Hartley | 746 | 18.82 | ||
Liberal Democrat | Colin Ross | 541 | 13.65 | ||
Majority | 1908 | 48.13 | |||
Turnout | 3,964 | 43.09 | |||
Conservative hold | Swing | ||||
Party | Candidate | Votes | % | ± | |
---|---|---|---|---|---|
Conservative | Andrew Wynne | 3197 | 73.73 | ||
Labour | Muhammad Khan | 588 | 13.56 | ||
Liberal Democrat | Philip Bennett | 527 | 12.15 | ||
Majority | 2609 | 60.17 | |||
Turnout | 4,336 | 47.16 | |||
Conservative hold | Swing | ||||
Party | Candidate | Votes | % | ± | |
---|---|---|---|---|---|
Conservative | David Bourne | 1225 | 30.83 | ||
Labour | Gwendoline Stafford Good | 1157 | 29.12 | ||
BNP | Dennis Organ | 1016 | 25.57 | ||
Independent | Arthur Newman | 563 | 14.17 | ||
Majority | 68 | 1.71 | |||
Turnout | 3,973 | 44.00 | |||
Conservative gain from Independent | Swing | ||||
Party | Candidate | Votes | % | ± | |
---|---|---|---|---|---|
Conservative | Matthew Holdcroft | 1555 | 48.04 | ||
Labour | Paul Kalinauckas | 1194 | 36.89 | ||
Liberal Democrat | Carole Jenkins | 262 | 8.09 | ||
Green | Stuart Hinde | 212 | 6.55 | ||
Majority | 361 | 11.15 | |||
Turnout | 3,237 | 37.53 | |||
Conservative hold | Swing | ||||
Of the main political parties, both the Conservative Party and Labour Party fielded a full slate of 20 candidates each.
The Liberal Democrats fielded 19 candidates, failing to have a candidate in place in Wednesfield North.
One independent candidate stood in each of the following 2 wards:
The Green Party had a candidate in each of the following 2 wards:
The Green Party of England and Wales is a green, left-wing political party in England and Wales. Headquartered in London, since September 2018, its co-leaders are Siân Berry and Jonathan Bartley. The Green Party has one representative in the House of Commons, one in the House of Lords, and three in the European Parliament. In addition, it has various councillors in UK local government and two members of the London Assembly.
The British National Party fielded only 1 candidate, in Wednesfield North ward.
The Liberal Party stood in only one ward, Heath Town.
The 1998 Wolverhampton Metropolitan Borough Council election took place on 7 May 1998 to elect members of Wolverhampton Metropolitan Borough Council in the West Midlands, England. One third of the council was up for election and the Labour party kept overall control of the council.
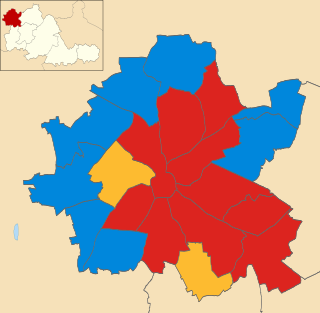
Elections to Wolverhampton City Council were held on 3 May 2007 in Wolverhampton, England. One third of the council was up for election and the Labour Party kept overall control of the council.
The 1999 Craven District Council election took place on 6 May 1999 to elect members of Craven District Council in North Yorkshire, England. One third of the council was up for election and the Conservative party gained overall control of the council from no overall control.
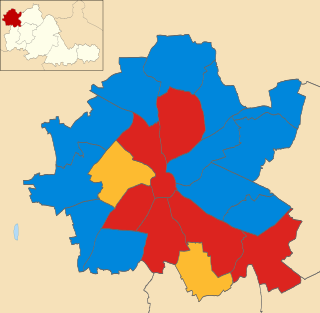
Elections to Wolverhampton City Council were held on 1 May 2008 in Wolverhampton, England. One third of the council was up for election and the Labour group lost overall control after losing eight seats across the City.
Elections to Calderdale Metropolitan Borough Council were held on 3 May 2007 with the exception of the Warley ward which was postponed until 14 June 2007 due to the sudden death of one of the candidates. One third of the council was up for election and the council stayed under no overall control with a minority Conservative administration. The total turnout of the election was 38.01%. The winning candidate in each ward is highlighted in bold.
The Council elections held in Wolverhampton on Thursday 1 May 1986 were one third, and 20 of the 60 seats were up for election.
The Council elections held in Wolverhampton on Thursday 7 May 1987 were one third, and 20 of the 60 seats were up for election.
The 2007 St Albans City and District Council election took place on 3 May 2007 to elect members of St Albans District Council in Hertfordshire, England. One third of the council was up for election and the Liberal Democrats lost overall control of the council to no overall control.
Elections to Wolverhampton City Council were held on 6 May 2010 in Wolverhampton, England. One third of the council was up for election, with the Wednesfield North ward electing two Councillors due to the resignation of a Councillor in January 2010 - the winning candidate will serve a 4-year term of office and the second placed candidate will serve a 1-year term.
The 2010 Barnet Council election took place on 6 May 2010 to elect members of Barnet London Borough Council in London, England. The whole council was up for election and the Conservative party stayed in overall control of the council.
Elections to Brighton and Hove City Council were held on 5 May 2011, in line with other local elections in the United Kingdom. The whole council, a unitary authority, was up for election with 54 councillors elected from 21 wards.
The 1999 Pendle Borough Council election took place on 6 May 1999 to elect members of Pendle Borough Council in Lancashire, England. One third of the council was up for election and the Liberal Democrats lost overall control of the council to no overall control.
The 2008 Basildon District Council election took place on 1 May 2008 to elect members of Basildon District Council in Essex, England. One third of the council was up for election and the Conservative party stayed in overall control of the council.
The 2007 Carlisle City Council election took place on 3 May 2007 to elect members of Carlisle District Council in Cumbria, England. One third of the council was up for election and the council stayed under no overall control.
The 2014 St Albans City and District Council election took place on 22 May 2014 to elect members of St Albans District Council in Hertfordshire, England. One third of the council was up for election and the council stayed under no overall control.
The 2012 Pendle Borough Council election took place on 3 May 2012 to elect members of Pendle Borough Council in Lancashire, England. One third of the council was up for election and the council stayed under no overall control.
The 2007 Huntingdonshire District Council election took place on 3 May 2007 to elect members of Huntingdonshire District Council in Cambridgeshire, England. One third of the council was up for election and the Conservative party stayed in overall control of the council.
The 2014 West Oxfordshire District Council election took place on 22 May 2014 to elect members of West Oxfordshire District Council in Oxfordshire, England. One third of the council was up for election and the Conservative party stayed in overall control of the council.
The 2018 City of Bradford Metropolitan District Council took place on 3 May 2018 to elect members of Bradford District Council in England. This was on the same day as other local elections. One councillor was elected in each ward for a four-year term so the councillors elected in 2018 last stood for election in 2014. Each ward is represented by three councillors, the election of which is staggered, so only one third of the councillors were elected in this election. Before the election there was a Labour majority and afterwards Labour had increased their majority.
The 2018 Sunderland City Council election took place on 3 May 2018 to elect members of Sunderland City Council in England. The election took place on the same day as other local elections.