Birmingham City Council election, 2018

Last updated

Birmingham City Council election, 2018
Birmingham City Flag.svg
  2016 3 May 20182022 

All 101 seats to Birmingham City Council
51 seats needed for a majority

 First partySecond party
 
Lab
Con
LeaderIan WardRobert Alden
Party Labour Conservative
Leader's seat Shard End Erdington
Last election80 seats,
50.5%
29 seats,
22.7%
Seats won6725
Seat Change (%)Decrease2.svg0.4%Increase2.svg0.6%
Popular Vote120,08368,840
Percentage50.2%28.8%
SwingDecrease2.svg0.3%Increase2.svg6.1%

 Third partyFourth party
 
LD
Grn
LeaderJon HuntJulien Pritchard
Party Liberal Democrat Green
Leader's seat
Perry Barr
Druids Heath
and
Monyhull
Last election10 seats,
13.2%
0 seats,
4.4%
Seats won81
Seat Change (%)Decrease2.svg0.4%Increase2.svg1.0%
Popular Vote33,64810,557
Percentage14.1%4.4%
SwingIncrease2.svg0.9%Steady2.svg

Birmingham Election Ward 2018.svg
2018 local election results in Birmingham.

Council control before election

Labour

Council control after election

Labour

The 2018 Birmingham City Council election is one of many local elections that took place in England on 3 May 2018. This was the first 'all-out' election for Birmingham City Council following a boundary review, which reduced the number of councillors from 120 to 101, serving 69 wards (previously 40 wards). [1] [2] Since the election, the city council has been composed of 37 single-member wards and 32 two-member wards. [3]

Birmingham City Council Local government body for the English city

Birmingham City Council is the local government body responsible for the governance of the City of Birmingham in England, which has been a metropolitan district since 1974. It is the most populated local council in the United Kingdom with, following a reorganisation of boundaries in June 2004, 120 Birmingham City councillors representing over one million people, in 40 wards. This means that Birmingham is technically the largest city in the United Kingdom. The council headquarters are at the Council House in the city centre. The council is responsible for running nearly all local services, with the exception of those run by joint boards. The provision of certain services has in recent years been devolved to several council constituencies, which each have a constituency committee made up of councillors from that district.

Contents

Eligibility to vote

All registered electors (British, Irish, Commonwealth and European Union citizens) who are aged 18 or over on polling day will be entitled to vote in the local elections. [4] A person who has two homes (such as a university student having a term-time address and living at home during holidays) can register to vote at both addresses as long as they are not in the same electoral area, and can vote in the local elections for the two different local councils. [5]

In general, a Commonwealth citizen is a citizen of a member state of the Commonwealth of Nations. This designation is given legal effect in the nationality laws of some Commonwealth countries, and Commonwealth citizens may enjoy some privileges in the United Kingdom and, less commonly, other member states. Each Commonwealth country determines what special rights, if any, are accorded to citizens of other Commonwealth countries. The status is most significant in British law and has little effect in many other Commonwealth countries, such as Canada.

Citizenship of the European Union (EU) is afforded to qualifying citizens of European Union member states. It was given to the citizens of member states by the 1992 Maastricht Treaty, at the same time as the European Community was gaining its own legal identity. The treaty established a direct legal relationship between that new legal identity and its citizens by establishing a directly elected European Parliament and the ability for citizens to bring cases directly to the ECJ, and has been in force since 1993. European Union citizenship is additional to national citizenship. EU citizenship affords rights, freedoms and legal protections to all of its citizens.

Election Results

Overall election result

Overall result compared with 2016.

Birmingham City Council election result, 2018
PartyCandidatesVotes
StoodElectedNetNet %% of total%Net %
Labour 10167Decrease2.svg13Decrease2.svg0.466.350.2120,083Decrease2.svg0.3
Conservative 10125Decrease2.svg4Increase2.svg0.624.828.868,840Increase2.svg6.1
Liberal Democrat 1018Decrease2.svg2Decrease2.svg0.47.914.133,648Increase2.svg0.9
Green 471Increase2.svg1Increase2.svg1.01.04.410,557Steady2.svg
Independent 110Decrease2.svg1Decrease2.svg0.80.02.04,765Increase2.svg1.6
TUSC 100Steady2.svgSteady2.svg0.00.3750Decrease2.svg0.1
Birmingham Worker30Steady2.svgSteady2.svg0.00.1296N/A
Liberal 10Steady2.svgSteady2.svg0.00.1170N/A
UKIP 10Steady2.svgSteady2.svg0.00.0111Decrease2.svg7.9
Common Good 10Steady2.svgSteady2.svg0.00.072N/A

[6]

Council Composition

Prior to the election

2016 local election results in Birmingham Birmingham wards 2016.png
2016 local election results in Birmingham

Prior to the 2018 election, Birmingham City Council was composed of 120 councillors across 40 wards. The council has been controlled by the Labour Party since 2012, which held two-thirds (80) of the seats. The Conservative Party last held sole control of the council in 1984. It was under no overall control from 2003 until 2012, run by a Labour-Liberal Democrat coalition from 2003 to 2004 and by a Conservative-Liberal Democrat coalition from 2004 to 2012. [7]

The Labour Party is a centre-left political party in the United Kingdom which has been described as an alliance of social democrats, democratic socialists and trade unionists. The party's platform emphasises greater state intervention, social justice and strengthening workers' rights.

Conservative Party (UK) Political party in the United Kingdom

The Conservative Party, officially the Conservative and Unionist Party, is a centre-right political party in the United Kingdom. Presently led by Theresa May, it has been the governing party since 2010. It presently has 314 Members of Parliament in the House of Commons, 249 members of the House of Lords, and 18 members of the European Parliament. It also has 31 Members of the Scottish Parliament, 12 members of the Welsh Assembly, eight members of the London Assembly and 9,008 local councillors. One of the major parties of UK politics, it has formed the government on 45 occasions, more than any other party.

8029101
LabourConservativeLib DemI
Lib Dem – Liberal Democrats
I – Independent

After the election

672581
LabourConservativeLib DemG
Lib Dem – Liberal Democrats
G – Green

Ward results

City centre and surrounding area

Aston

Aston 2018 (2)
PartyCandidateVotes%±
Labour Muhammad Afzal 2,902
Labour Nagina Kauser 2,793
Liberal Democrat Ayoub Khan2,252
Liberal Democrat Sham Uddin1,546
Independent Abdul Aziz1,134
Conservative Jahid Choudhury891
Conservative Margaret Bennett328
Green Vijay Rana160
Majority
Turnout
Labour hold Swing
Labour hold Swing

Birchfield

Birchfield 2018 (1)
PartyCandidateVotes%±
Labour Mahmood Hussain 1,905 83.7
Conservative Raja Khan2179.5
Liberal Democrat Rezaul Billah1556.8
Majority
Turnout 2,277
Labour win (new seat)

Bordesley & Highgate

Bordesley & Highgate 2018 (1)
PartyCandidateVotes%±
Labour Yvonne Mosquito 1,176 78.5
Liberal Democrat Daniel Iliff1208.0
Conservative Julia Mackey1137.5
Green Tom Jenkins906.0
Majority1,056
Turnout 1,512
Labour win (new seat)

Bordesley Green

Bordesley Green 2018 (1)
PartyCandidateVotes%±
Labour Chauhdry Rashid 1,664 69.4 Increase2.svg 11.1
Liberal Democrat Mohammed Saeed54022.5Decrease2.svg 8.6
Conservative Ayan Tifow1094.5Increase2.svg 1.9
Green Alan Clawley843.5Increase2.svg 0.2
Majority1,124
Turnout 2,420
Labour hold Swing

Edgbaston

Edgbaston 2018 (2)
PartyCandidateVotes%±
Conservative Deirdre Alden 2,607 31.1
Conservative Matt Bennett 1,969 23.5
Labour Jenny Nolan1,57118.8
Labour Marcus Bernasconi1,47017.5
Green Alexander Nettle2793.3
Liberal Democrat Daniel Chamberlain2593.1
Liberal Democrat Jamie Scott2222.7
Majority
Turnout 8,377
Conservative hold Swing

Handsworth

Handsworth 2018 (1)
PartyCandidateVotes%±
Labour Hendrina Quinnen 1,726 71.7
Conservative Enam-Ur Rahman45518.9
Green Susan Green1466.1
Liberal Democrat Kingsley Douglas803.3
Majority1,271
Turnout 2,417
Labour win (new seat)

Handsworth Wood

Handsworth Wood 2018 (2)
PartyCandidateVotes%±
Labour Narinder Kooner 2,606
Labour Gurdial Atwal 2,509
Conservative Steve White693
Conservative Ravi Chumber679
Green Eric Fairclough283
Liberal Democrat Nicholas Joliffe245
Liberal Democrat Rizwan Ali200
TUSC Rachel Jenkins134
Independent PG Aathouli-Singh64
Majority
Turnout
Labour hold Swing
Labour hold Swing

Harborne

Harborne 2018 (2)
PartyCandidateVotes%±
Labour Jayne Francis 2,623
Conservative Peter Fowler 2,533
Conservative Akaal Sidhu2,390
Labour Sundip Meghani2,061
Liberal Democrat Colin Green657
Green Phil Simpson650
Liberal Democrat Ian Garrett646
Majority
Turnout 6109
Labour hold Swing
Conservative gain from Labour Swing

Holyhead

Holyhead 2018 (1)
PartyCandidateVotes%±
Labour Paulette Hamilton 1,646 70.4
Conservative Mujakkir Ahmed43618.6
Liberal Democrat Foysol Ahmed25711.0
Majority1,210
Turnout 2,366
Labour win (new seat)

Ladywood

Ladywood 2018 (2)
PartyCandidateVotes%±
Labour Kath Hartley 1,639 32.07
Labour Albert Bore 1,631 31.91
Conservative Kenneth Morris4899.56
Conservative Nayaz Qazi3887.59
Green Robert Jones3426.69
Liberal Democrat Lee Dargue3406.65
Liberal Democrat Stephen Lambert2785.44
Majority327364.05
Turnout
Labour hold Swing
Labour hold Swing

Lozells

Lozells 2018 (1)
PartyCandidateVotes%±
Labour Waseem Zaffer 2,071 64.5
Conservative Abdul Khalique74523.2
Liberal Democrat Sadek Hussain39512.3
Majority1,326
Turnout 3211
Labour win (new seat)

Nechells

Nechells 2018 (1)
PartyCandidateVotes%±
Labour Tahir Ali 1,237 81.2 Increase2.svg 12.5
Conservative Neil Shastri-Hurst16410.8Decrease2.svg 1.7
Liberal Democrat Shazad Iqbal1238.1Increase2.svg 1.4
Majority1,073
Turnout 1,542
Labour hold Swing

Newtown

Newtown 2018 (1)
PartyCandidateVotes%±
Labour Ziaul Islam 1,319 77.4
Conservative Desmond Jaddoo31018.2
Liberal Democrat Sultan Ahmed764.5
Majority1,009
Turnout 1,722
Labour win (new seat)

North Edgbaston

North Edgbaston 2018 (2)
PartyCandidateVotes%±
Labour Carl Rice 2,854 35.23
Labour Sharon Thompson 2,383 29.42
Conservative Dal Sidhu1,25415.48
Conservative Raj Padda96211.88
Liberal Democrat Joni Hood2412.97
Independent Gino Bellavia2272.80
Liberal Democrat Ned Hilton1802.22
Majority
Turnout 8101
Labour win (new seat)

Quinton

Quinton 2018 (2)
PartyCandidateVotes%±
Labour Co-op Kate Booth 2,332
Labour Co-op John Clancy 2,307
Conservative Georgina Chandler2,206
Conservative Rachel Okello1,919
Green James Bolton344
Liberal Democrat Julia Garrett343
Liberal Democrat Jo Walker146
Majority
Turnout
Labour Co-op hold Swing

Soho & Jewellery Quarter

Soho & Jewellery Quarter 2018 (2)
PartyCandidateVotes%±
Labour Chaman Lal 2,365 34.80
Labour Sybil Spence 2,097 30.94
Conservative Janatul Choudhury6449.50
Liberal Democrat Gareth Hardy5668.35
Conservative Mohammed Islam4606.79
Liberal Democrat Richard Maxwell3735.50
Green Kefentse Dennis2724.01
Majority
Turnout
Labour win (new seat)

East of city centre

Alum Rock

Alum Rock 2018 (2)
PartyCandidateVotes%±
Labour Mohammed Idrees 4,910
Labour Mariam Khan 4,464
Liberal Democrat Thomas Lister296
Conservative Richard Brookes-Bland215
Conservative Amil Khan214
Liberal Democrat Colin Ross187
Labour win (new seat)

Bromford & Hodge Hill

Bromford & Hodge Hill 2018 (2)
PartyCandidateVotes%±
Labour Majid Mahmood 2,569
Labour Diane Donaldson 2,435
Conservative Aminur Rahman721
Conservative Bogdan Tudor617
Liberal Democrat Gwyn Neilly424
Liberal Democrat Asad Mehmood254
Majority
Turnout
Labour win (new seat)

Garretts Green

Garretts Green 2018 (1)
PartyCandidateVotes%±
Labour Saddak Miah 961 49.6
Liberal Democrat Carol Jones82442.6
Conservative Simon Conn1517.8
Majority92
Turnout 1,940
Labour win (new seat)

Glebe Farm & Tile Cross

Glebe Farm & Tile Cross 2018 (2)
PartyCandidateVotes%±
Labour Marje Bridle 2,302
Labour John Cotton 2,102
Conservative Rosemary Gasson518
Conservative Fergus Robinson456
Independent Paul Clayton366
Liberal Democrat Rafiqur Rahman256
Liberal Democrat Shamsur Rehman244
Majority
Turnout
Labour win (new seat)

Heartlands

Heartlands 2018 (1)
PartyCandidateVotes%±
Labour Shafique Shah 2,136 78.9
Independent Aftab Hussain2348.6
Liberal Democrat Faisal Mahmood1666.1
Conservative Mary Storer1114.1
Green Janet Assheton592.2
Majority1,902
Turnout 2,728
Labour win (new seat)

Shard End

Shard End 2018 (1)
PartyCandidateVotes%±
Labour Ian Ward 911 60.8 Decrease2.svg 11.2
Conservative John Alden37124.8Increase2.svg 20.0
Liberal Democrat Christopher Barber664.4Increase2.svg 2.7
Green Mike Harrison614.1Increase2.svg 2.3
Independent James Scroggie614.1Increase2.svg 4.1
TUSC Mark Andrews281.9Increase2.svg 1.9
Majority540
Turnout 1,506
Labour hold Swing

Sheldon

Sheldon 2018 (2)
PartyCandidateVotes%±
Liberal Democrat Paul Tilsley 2,565
Liberal Democrat Mike Ward 2,342
Labour Bob Collins900
Labour Julia Larden880
Conservative Nicholas Psirides474
Conservative Suhel Ali452
Green Kevin Harrison131
Majority
Turnout
Liberal Democrat hold Swing

Small Heath

Small Heath 2018 (2)
PartyCandidateVotes%±
Labour Zaheer Khan 3,270
Labour Safia Akhtar 3,196
Liberal Democrat Shaukat Khan1,738
Liberal Democrat Gerry Moynihan1,017
Conservative Kabir Uddin655
Independent Shaaky Ahmed604
Conservative Pervez Akhtar547
Green Hazel Clawley149
Majority
Turnout
Labour win (new seat)

South Yardley

South Yardley 2018 (1)
PartyCandidateVotes%±
Liberal Democrat Zaker Choudhry 1,507 60.4 Increase2.svg 23.9
Labour David Welburn60124.1Decrease2.svg 24.1
Conservative Susan Axford34413.8Increase2.svg 7.5
Green Christopher Garghan431.7Decrease2.svg 1.5
Majority
Turnout 2,504
Liberal Democrat gain from Labour Swing

Ward End

Ward End 2018 (1)
PartyCandidateVotes%±
Labour Mohammed Aikhlaq 1,663 54.2
Liberal Democrat Nazabit Ali90929.6
Independent Wajid Hussain33110.8
Conservative Joseph Hamblin1665.4
Majority754
Turnout
Labour win (new seat)

Yardley East

Yardley East 2018 (1)
PartyCandidateVotes%±
Liberal Democrat Neil Eustace 1,856 64.9
Labour Ann Wackett86330.2
Conservative Edwin Caldecott1404.9
Majority993
Turnout 2,869
Liberal Democrat win (new seat)

Yardley West & Stechford

Yardley West & Stechford 2018 (1)
PartyCandidateVotes%±
Liberal Democrat Baber Baz 1,505 51.5
Labour Basharat Dad1,28529.6
Conservative Ali Mothin1334.6
Majority
Turnout
Liberal Democrat win (new seat)

North of city centre

Castle Vale

Castle Vale 2018 (1)
PartyCandidateVotes%±
Conservative Suzanne Webb 731 50.8
Labour Lynda Clinton64044.4
Liberal Democrat Trevor Holtom352.4
TUSC Kris Sucilla O'Sullivan342.4
Majority91
Turnout 1,445
Conservative win (new seat)

Erdington

Erdington 2018 (2)
PartyCandidateVotes%±
Conservative Robert Alden 2,727
Conservative Gareth Moore 2,456
Labour Co-op Vic Hooper1,837
Labour Co-op Dee Smyth1,666
Green Rebecca Collins259
Liberal Democrat Callum Reilly132
Liberal Democrat Thomas Hunt126
Majority
Turnout
Conservative hold Swing

Gravelly Hill

Gravelly Hill 2018 (1)
PartyCandidateVotes%±
Labour Mick Brown 1,238 74.2
Conservative Luqmaan Nawaz29717.8
Liberal Democrat Philip Mills1338.0
Majority941
Turnout 1,668
Labour win (new seat)

Kingstanding

Kingstanding 2018 (2)
PartyCandidateVotes%±
Conservative Gary Sambrook 1,745
Conservative Ron Storer 1,577
Labour Des Hughes1,465
Labour Jane Jones1,459
Liberal Democrat Violaine Mendez97
Liberal Democrat James Perrott89
Majority
Turnout
Conservative win (new seat)

Oscott

Oscott 2018 (2)
PartyCandidateVotes%±
Labour Keith Linnecor 1,794
Labour Barbara Dring 1,705
Conservative Tom Coffey1,407
Conservative Leona Leung1,245
Liberal Democrat Andy Fullylove147
Green Harry Eyles132
Liberal Democrat Marcia Hunt131
Majority
Turnout
Labour hold Swing
Labour hold Swing

Perry Barr

Perry Barr 2018 (2)
PartyCandidateVotes%±
Liberal Democrat Jon Hunt 2,957
Liberal Democrat Morriam Jan 2,398
Labour Mohammed Hanif1,887
Labour Sukhi Kaur1,662
Conservative Janet Coffey361
Conservative Tariq Rashid190
TUSC Corinthia Ward78
Majority
Turnout
Liberal Democrat hold Swing

Perry Common

Perry Common 2018 (1)
PartyCandidateVotes%±
Conservative Bob Beauchamp 1,007 49.2
Labour Co-op Anita Ward95546.7
Liberal Democrat Stephen Allsopp844.1
Majority52
Turnout 2,056
Conservative win (new seat)

Pype Hayes

Pype Hayes 2018 (1)
PartyCandidateVotes%±
Labour Mike Sharpe 851 45.9
Conservative Clifton Welch83545.1
Liberal Democrat Ann Holtom1095.9
Green John Bentley583.1
Majority16
Turnout 1,856
Labour win (new seat)

Stockland Green

Stockland Green 2018 (2)
PartyCandidateVotes%±
Labour Penny Holbrook 2,536
Labour Josh Jones 2,259
Conservative Mohammad Kayani726
Conservative Asif Mehmood686
Liberal Democrat Joe Harmer238
Liberal Democrat Rizwan Syed149
TUSC Ted Woodley127
Majority
Turnout
Labour hold Swing
Labour hold Swing

South-east of city centre

Acocks Green

Acocks Green 2018 (2)
PartyCandidateVotes%±
Labour John O'Shea 2,249
Liberal Democrat Roger Harmer 1,857
Liberal Democrat Penny Wagg1,737
Labour Fiona Williams1,521
Conservative Wajad Ali525
Conservative Luke Watson329
Green Amanda Baker201
TUSC Eamonn Flynn71
Majority
Turnout
Labour hold Swing
Liberal Democrat hold Swing

Balsall Heath West

Balsall Heath West 2018 (1)
PartyCandidateVotes%±
Labour Zhor Malik 1,938 76.4
Liberal Democrat Islam Issa 2048.0
Birmingham WorkerSammi Ibrahem1566.2
Conservative Ali Fazel1395.5
Green Martin Guest983.9
Majority1,734
Turnout 2,570
Labour win (new seat)

Brandwood & King's Heath

Brandwood & King's Heath 2018 (2)
PartyCandidateVotes%±
Labour Lisa Trickett 3,395
Labour Mike Leddy 3,350
Conservative Gordon Franks1,122
Conservative Joshua Mackenzie-Lawrie829
Green Patrick Cox658
Liberal Democrat Chris Burgess479
Green Julie Kaya392
Liberal Democrat Rob Gilliam293
Birmingham WorkerKatherine Cremer95
TUSC Bill Murray78
Majority
Turnout
Labour win (new seat)

Druids Heath and Monyhull

Druids Heath & Monyhull 2018 (1)
PartyCandidateVotes%±
Green Julien Pritchard 1,201 45.48
Labour Victoria Quinn72527.45
Conservative Ben Brittain68826.05
Liberal Democrat Emily Cox271.02
Majority476
Turnout 2,646
Green win (new seat)

Hall Green North

Hall Green North 2018 (2)
PartyCandidateVotes%±
Labour Akhlaq Ahmed 2,989
Labour Lou Robson 2,922
Independent Bob Harvey1,098
Conservative Sohan Singh687
Conservative Tukeer Hussain529
Liberal Democrat Andy Spruce386
Liberal Democrat Stephanie Spruce345
Green Gareth Courage341
Majority
Turnout
Labour win (new seat)

Hall Green South

Hall Green South 2018 (1)
PartyCandidateVotes%±
Conservative Tim Huxtable 1,744 60.0
Labour Co-op Changese Khan85530.4
Liberal Democrat Jerry Evans1545.3
Green Ulla Grant1244.3
Majority859
Turnout 2,916
Conservative win (new seat)

Highter's Heath

Highter's Heath 2018 (1)
PartyCandidateVotes%±
Conservative Adam Higgs 1,362 61.7
Labour Barry Bowles70932.1
Green Clare Thomas793.6
Liberal Democrat Kirsty Jerome572.6
Majority653
Turnout 2,213
Conservative win (new seat)

Moseley

Moseley 2018 (2)
PartyCandidateVotes%±
Labour Kerry Jenkins 3,123 26.75
Labour Martin Straker-Welds 3,114 26.67
Liberal Democrat Izzy Knowles2,21118.94
Liberal Democrat David Farrow1,49412.80
Green Rachel Xerri-Brooks6085.21
Conservative John Turner5794.96
Conservative Dominic O'Callaghan5474.68
Majority
Turnout
Labour win (new seat)

Sparkbrook & Balsall Heath East

Sparkbrook & Balsall Heath East 2018 (2)
PartyCandidateVotes%±
Labour Mohammed Azim 4,257
Labour Shabrana Hussain 3,950
Conservative Abu Nowshed701
Conservative Mohammad Sweet665
Green Roxanne Green237
Liberal Democrat Joynal Abedin201
Liberal Democrat Satwinder Singh159
Labour hold Swing
Labour hold Swing

Sparkhill

Sparkhill 2018 (2)
PartyCandidateVotes%±
Labour Mohammed Fazal 3,140
Labour Nicky Brennan 2,971
Liberal Democrat Tanveer Choudhry1,295
Liberal Democrat Tassawer Hussain1,178
Conservative Murad Mohammed453
Conservative Mohammed Talukder440
Majority
Turnout
Labour win (new seat)

Tyseley & Hay Mills

Tyseley & Hay Mills 2018 (1)
PartyCandidateVotes%±
Labour Zafar Iqbal 1,361 66.6
Liberal Democrat Syed Ali30615.0
Conservative Shafayet Khan20810.2
Liberal Mike Sheridan1708.3
Majority
Turnout
Labour win (new seat)

South-west of city centre

Allens Cross

Allens Cross 2018 (1)
PartyCandidateVotes%±
Conservative Eddie Freeman 1,023 48.8
Labour Co-op Steve Bedser97444.6
Common Good Dick Rodgers723.3
Liberal Democrat Clare Fielden632.9
Green Peter Beck522.4
Majority49
Turnout 2,189
Conservative win (new seat)

Bartley Green

Bartley Green 2018 (2)
PartyCandidateVotes%±
Conservative Bruce Lines 2,627
Conservative John Lines 2,626
Labour Paul Preston1,296
Labour Joanne Shemmans1,197
Green James Robertson188
Liberal Democrat David Osborne113
Liberal Democrat Maureen Osborne110
Majority
Turnout
Conservative hold Swing

Billesley

Billesley 2018 (2)
PartyCandidateVotes%±
Labour Phil Davis 2,537
Labour Lucy Seymour-Smith 2,309
Conservative Tom Huxley2,037
Conservative Jane James2,035
Green Robert Grant232
Liberal Democrat Alan Morrow220
Green David Gaussen139
Liberal Democrat Phil Wagg110
Majority
Turnout
Labour hold Swing
Labour hold Swing

Bournbrook & Selly Park

Bournbrook & Selly Park 2018 (2)
PartyCandidateVotes%±
Labour Co-op Brigid Jones 1,884
Labour Co-op Karen McCarthy 1,773
Liberal Democrat Jake Calcutt476
Conservative Monica Hardie423
Liberal Democrat Sophie Thornton413
Conservative Angus Gillan411
Green Alice Kiff266
Green Benjamin Mabbett123
TUSC Sam Witts82
Majority
Turnout
Labour Co-op win (new seat)

Bournville & Cotteridge

Bournville & Cotteridge 2018 (2)
PartyCandidateVotes%±
Labour Liz Clements 2,809 26.56
Labour Fred Grindrod 2,505 23.68
Conservative Rob Sealey2,06519.52
Conservative Peter Douglas Osborn1,89917.95
Green Anna Masters4103.88
Green Claire Hammond3713.51
Liberal Democrat Dave Radcliffe2842.68
Liberal Democrat Tim Stimpson1941.83
TUSC Clive Walder410.39
Majority
Turnout
Labour win (new seat)

Frankley Great Park

Frankley Great Park 2018 (1)
PartyCandidateVotes%±
Conservative Simon Morrall 1,019 50.9
Labour Andrew Cartwright90445.2
Liberal Democrat Gerry Jerome783.9
Majority115
Turnout 2,012
Conservative win (new seat)

King's Norton North

King's Norton North 2018 (1)
PartyCandidateVotes%±
Labour Alex Aitken 1,341 49.77
Conservative Simon Jevon1,23745.91
Liberal Democrat Brian Peace953.52
Majority1043.86
Turnout 2,694
Labour win (new seat)

King's Norton South

King's Norton South 2018 (1)
PartyCandidateVotes%±
Labour Peter Griffiths 1,015 51.7
Conservative Barbara Wood84342.9
Liberal Democrat Peter Lloyd1065.4
Majority172
Turnout 1,970
Labour win (new seat)

Longbridge & West Heath

Longbridge & West Heath 2018 (2)
PartyCandidateVotes%±
Conservative Debbie Clancy 2,174 26
Labour Brett O'Reilly 1,925 23
Conservative Graham Knight1,91122.8
Labour Carmel Corrigan1,86322.3
Green Susan Pearce2903
Liberal Democrat Hugh Duffy1011
Liberal Democrat Jim Whorwood891
Majority
Turnout 8353
Conservative win (new seat)
Labour win (new seat)

Northfield

Northfield 2018 (1)
PartyCandidateVotes%±
Labour Olly Armstrong 1,635 53.5 Increase2.svg 11.6
Conservative Randal Brew1,25741.1Increase2.svg 2.6
Green Margaret Okole842.7Decrease2.svg 0.1
Liberal Democrat Andy Moles812.6Decrease2.svg 0.2
Majority378
Turnout 3064
Labour hold Swing

Rubery & Rednal

Rubery & Rednal 2018 (1)
PartyCandidateVotes%±
Conservative Adrian Delaney 969 53.4
Labour Carole Griffiths70638.9
Green Rob Ball894.9
Liberal Democrat Kevin Hannon522.9
Majority263
Turnout 1,819
Conservative win (new seat)

Stirchley

Stirchley 2018 (1)
PartyCandidateVotes%±
Labour Co-op Mary Locke 1,856 66.76
Conservative Owen Williams57620.7
Green Elly Stanton1555.57
Liberal Democrat Phil Banting1415.07
Birmingham WorkerReuben Lawrence451.61
Majority1,28046%
Turnout 2,780
Labour Co-op win (new seat)

Weoley & Selly Oak

Weoley & Selly Oak 2018 (2)
PartyCandidateVotes%±
Labour Julie Johnson 2,080
Labour Tristan Chatfield 2,035
Conservative Andrew Hardie1,885
Conservative Des Flood1,875
Green Eleanor Masters410
Liberal Democrat Trevor Sword329
Liberal Democrat Robert Wright274
TUSC Nick Hart77
Majority
Turnout
Labour win (new seat)

Sutton Coldfield

Sutton Four Oaks

Sutton Four Oaks 2018 (1)
PartyCandidateVotes%±
Conservative Maureen Cornish 1,957 77.1
Labour Roger Barley34013.4
Liberal Democrat David Willett1415.6
Green Fiona Nunan1003.9
Majority1,617
Turnout 2,558
Conservative hold Swing

Sutton Mere Green

Sutton Mere Green 2018 (1)
PartyCandidateVotes%±
Conservative Meirion Jenkins 2,062 71.8
Labour Ian Brindley46216.1
Liberal Democrat Jonny Mayner1946.8
Green David Ratcliff1535.3
Majority1,600
Turnout 2,890
Conservative win (new seat)

Sutton Reddicap

Sutton Reddicap 2018 (1)
PartyCandidateVotes%±
Conservative Charlotte Hodivala 1,008 56.7
Labour Judy Preston53730.2
Liberal Democrat Tim Cotterill1216.8
UKIP Stewart Cotterill1116.2
Majority471
Turnout 1,794
Conservative win (new seat)

Sutton Roughley

Sutton Roughley 2018 (1)
PartyCandidateVotes%±
Conservative Ewan Mackey 1,809 67.4
Labour Paul Tomlinson52119.4
Liberal Democrat Kate Potter2158.0
Green Will Greaves1405.2
Majority1,288
Turnout 2,695
Conservative hold Swing

Sutton Trinity

Sutton Trinity 2018 (1)
PartyCandidateVotes%±
Conservative David Pears 1,355 57.1
Labour Peter French59325.0
Liberal Democrat Jenny Wilkinson29912.6
Green Sean Madden1245.2
Majority
Turnout
Conservative hold Swing

Sutton Vesey

Sutton Vesey 2018 (2)
PartyCandidateVotes%±
Labour Rob Pocock 3,377 30.6
Labour Kath Scott 2,458 22.2
Conservative Janet Cairns2,35421.3
Conservative Louise Passey2,18219.7
Green Colin Marriott2972.7
Liberal Democrat Matthew Gibson2712.5
Liberal Democrat Mohammed Khalid1101.0
Majority
Turnout
Labour win (new seat)

Sutton Walmley & Minworth

Sutton Walmley & Minworth 2018 (2)
PartyCandidateVotes%±
Conservative David Barrie 2,445 35.0
Conservative Ken Wood 1,869 26.8
Labour Katy Coxall69610.0
Independent David O’Hagan6469.3
Labour Paul Finnegan5748.2
Green Ben Auton3364.8
Liberal Democrat David Cooke2363.4
Liberal Democrat James Garrington1792.6
Majority
Turnout
Conservative win (new seat)

Sutton Wylde Green

Sutton Wylde Green 2018 (1)
PartyCandidateVotes%±
Conservative Alex Yip 1,806 65.6
Labour Terry Johnson64423.4
Liberal Democrat Malcolm Spencer1625.9
Green Zoe Challenor1425.2
Majority
Turnout
Conservative win (new seat)

Related Research Articles

2006 United Kingdom local elections

Local government elections took place in England (only) on Thursday 4 May 2006. Polling stations were open between 7:00 and 22:00.

Politics of Bristol

The city of Bristol, England, is a unitary authority, represented by four MPs representing seats wholly within the city boundaries. As well as these, Filton and Bradley Stoke covers the northern urban fringe in South Gloucestershire and the north eastern urban fringe is in the Kingswood constituency. The overall trend of both local and national representation became left of centre, favouring the Labour Party and Liberal Democrats during the latter 20th century, but there was a shift to the right in the 2010 general election. The city has a tradition of local activism, with environmental issues and sustainable transport being prominent issues in the city.

Sefton Council Local government body in England

Sefton Council is the governing body for the Metropolitan Borough of Sefton in Merseyside, north-western England. The council was under no overall control from the 1980s until 2012 when the Labour Party took control. It is a constituent council of Liverpool City Region Combined Authority.

New Forest District Council in Hampshire, England is elected every four years.

2010 Solihull Metropolitan Borough Council election

The 2010 Solihull Metropolitan Borough Council election took place on 6 May 2010 to elect members of Solihull Metropolitan Borough Council in the West Midlands, England. One third of the council was up for election and the council stayed under no overall control.

2006 Solihull Metropolitan Borough Council election

The 2006 Solihull Metropolitan Borough Council election took place on 4 May 2006 to elect members of Solihull Metropolitan Borough Council in the West Midlands, England. One third of the council was up for election and the Conservative party stayed in overall control of the council.

2008 Pendle Borough Council election

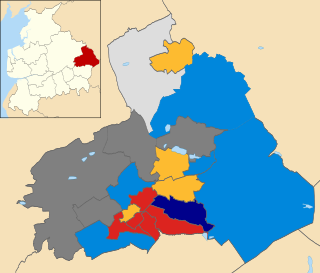
The 2008 Pendle Borough Council election took place on 1 May 2008 to elect members of Pendle Borough Council in Lancashire, England. One third of the council was up for election and the Liberal Democrats lost overall control of the council to no overall control.

2012 East Lothian Council election

Elections to East Lothian Council were held on 3 May 2012, on the same day as the other Scottish local government elections. The election used the 7 wards created as a result of the Local Governance (Scotland) Act 2004, with each ward electing three or four councillors using the single transferable vote system a form of proportional representation, with 23 councillors elected.

The 2012 City of Lincoln Council election took place on 3 May 2012 to elect one-third of the members of City of Lincoln Council in Lincolnshire, England, for a 4-year term of office. This was on the same day as other United Kingdom local elections, 2012.

2013 United Kingdom local elections

The 2013 United Kingdom local elections took place on Thursday 2 May 2013. Elections were held in 35 English councils: all 27 non-metropolitan county councils and eight unitary authorities, and in one Welsh unitary authority. Direct mayoral elections took place in Doncaster and North Tyneside. These elections last took place on the 4 June 2009 at the same time as the 2009 European Parliament Elections, except for County Durham, Northumberland and the Anglesey where elections last took place in 2008.

2013 Cumbria County Council election

An election to Cumbria County Council took place on 2 May013 as part of the United Kingdom local elections, 2013. All 84 councillors were elected from electoral divisions which returned one county councillor each by first-past-the-post voting for a four-year term of office. Following an electoral review carried out by the Local Government Boundary Commission for England, newly drawn electoral divisions were used without change in the number of county councillors.

2013 Cornwall Council election

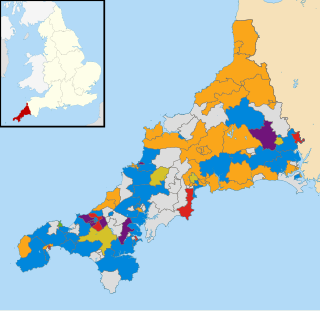
The Cornwall Council election, 2013, was an election for all 123 seats on the council. Cornwall Council is a unitary authority that covers the majority of the ceremonial county of Cornwall, with the exception of the Isles of Scilly which have an independent local authority. The elections took place concurrently with other local elections across England and Wales.

2017 Scottish local elections

The 2017 Scottish local elections were held on Thursday 4 May, in all 32 local authorities. The SNP retained its position as the largest party in terms of votes and councillors, despite suffering minor losses. The Conservatives made gains and displaced Labour as the second largest party, while the Liberal Democrats suffered a net loss of councillors despite increasing their share of the vote. Minor parties and independents polled well; and independent councillors retained majority control over the 3 island councils. For the first time since the local government reforms in 1995, all councils fell under no overall control.

2018 London local elections

Local government elections took place in London on 3 May 2018, as part of the wider local elections in England.

2017 United Kingdom local elections

The 2017 United Kingdom local elections were held on Thursday 4 May 2017. Local elections were held across Great Britain, with elections to 35 English local authorities and all councils in Scotland and Wales.

2017 Welsh local elections

Local elections were held in Wales on Thursday 4 May 2017 to elect members of all 22 local authorities, including the Isle of Anglesey, which was last up for election in 2013 due to having its elections delayed for a year. These local elections were held alongside local elections in Scotland and parts of England.

The 2017 Highland Council election was held on 4 May 2017 to elect members of Highland Council. The election used the 21 wards created under the Local Governance (Scotland) Act 2004; each ward elected three or four councillors using the single transferable vote system. A total of 74 councillors were elected, six less than in 2012.

Jeff Green (politician) politician

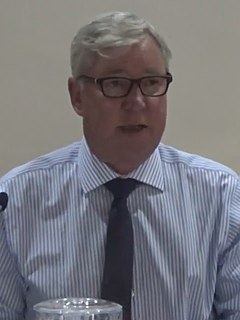
Jeffrey Edwin Green is a British Conservative politician and former leader of Wirral Council between 2010 and 2011 and in 2012. He was the first Conservative to hold the role in 24 years.

References

  1. "Local Government Boundary Review". Birmingham City Council. Retrieved 3 April 2017.
  2. "New Ward Maps". Birmingham City Council. Retrieved 3 April 2017.
  3. "The City of Birmingham (Electoral Changes) Order 2016". UK Government Legislation – The National Archives. Retrieved 4 April 2017.
  4. "Representation of the People Act 1983, Section 2". Legislation.gov.uk. Retrieved 29 January 2018.
  5. Electoral Commission. "I have two homes. Can I register at both addresses?". electoralcommission.org.uk. The Electoral Commission . Retrieved 29 January 2018.
  6. "Birmingham City Council Election 2018 Results". BBC . Retrieved 4 May 2018.
  7. Neil Elkes (10 May 2012). "Eight years of Conservative-Liberal Democrat rule in Birmingham". Birmingham Post. Retrieved 5 May 2018.