Sunderland City Council election, 2018

Last updated

Sunderland City Council election, 2018
Coat of arms of Sunderland City Council.png
  2016 3 May 2018 2019  

One third of 75 seats on Sunderland City Council
38 seats needed for a majority

 First partySecond partyThird party
 
Party Labour Conservative Liberal Democrat
Seats before6563
Seats won1753
Seats after6186
Seat changeDecrease2.svg4Increase2.svg2Increase2.svg3

 Fourth party
 
Party Independent
Seats before1
Seats won0
Seats after0
Seat changeDecrease2.svg1

Sunderland UK local election 2018 map.svg
Map of the 2018 Sunderland City Council election results. Labour in red, Conservatives in blue, and Liberal Democrats in yellow.

Majority party before election

Labour

Majority party after election

Labour

The 2018 Sunderland City Council election took place on 3 May 2018 to elect members of Sunderland City Council in England. [1] The election took place on the same day as other local elections.

Sunderland City Council Local government body in England

Sunderland City Council is the local authority of the City of Sunderland in Tyne and Wear, England. It is a metropolitan district council, one of five in Tyne and Wear and one of 36 in the metropolitan counties of England, and provides the majority of local government services in Sunderland.

Contents

Background

In the period since the previous local elections in 2016, the Liberal Democrats had won two seats from Labour in by-elections: in January 2017 in Sandhill ward, and February 2018 in Pallion ward. [2]

Liberal Democrats (UK) Political party in the United Kingdom

The Liberal Democrats are a liberal, centrist political party in the United Kingdom. They presently have 11 Members of Parliament in the House of Commons, 96 members of the House of Lords, and one member of the European Parliament. They also have five Members of the Scottish Parliament and a member each in the Welsh Assembly and London Assembly. The party reached the height of its influence in the early 2010s, forming a junior partner in a coalition government from 2010 to 2015. It is presently led by Vince Cable.

The Labour, Conservative and Green Parties all fielded 25 candidates in the election. The Liberal Democrats fielded 22 candidates, and there were 4 Independent candidates. UKIP did not field any candidates, despite taking 11% of the vote at the previous election. [3] The election saw a debut for the Populist Party and For Britain, which each fielded one candidate.

The Labour Party is a centre-left political party in the United Kingdom which has been described as an alliance of social democrats, democratic socialists and trade unionists. The party's platform emphasises greater state intervention, social justice and strengthening workers' rights. Labour is a full member of the Party of European Socialists and Progressive Alliance, and holds observer status in the Socialist International. As of 2017, the party was considered the "largest party in Western Europe" in terms of party membership, with more than half a million members.

Conservative Party (UK) Political party in the United Kingdom

The Conservative Party, officially the Conservative and Unionist Party, is a centre-right political party in the United Kingdom. Presently led by Theresa May, it has been the governing party since 2010. It presently has 314 Members of Parliament in the House of Commons, 249 members of the House of Lords, and 18 members of the European Parliament. It also has 31 Members of the Scottish Parliament, 12 members of the Welsh Assembly, eight members of the London Assembly and 9,008 local councillors. One of the major parties of UK politics, it has formed the government on 45 occasions, more than any other party.

Green Party of England and Wales Political party in England and Wales

The Green Party of England and Wales is a green, left-wing political party in England and Wales. Headquartered in London, since September 2018, its Co-Leaders are Siân Berry and Jonathan Bartley. The Green Party has one Member of Parliament in the House of Commons, one representative in the House of Lords, and three Members of the European Parliament. It has various councillors in UK local government and two members of the London Assembly.

Election results

The election saw Labour defend 16 seats and gain one seat, winning the Copt Hill ward from an Independent councillor. The Liberal Democrats took seats from Labour in Millfield, Pallion, and Sandhill. The Conservatives held the seats they were defending in Fulwell, St Michael's, and St Peter's, and gained from Labour in St Chad's and Barnes. [4]

An independent or nonpartisan politician is an individual politician not affiliated with any political party. There are numerous reasons why someone may stand for office as an independent.

Millfield, Tyne and Wear suburb of Sunderland, Tyne & Wear

Millfield is a suburb, civil parish and electoral ward of the City of Sunderland, in Tyne and Wear, England. Most of the buildings in the area were built after the Victorian Era and are mostly built up of large terraced houses built for working-class people of the 20th century. When first built Millfield was located near the heart of Sunderland City Centre, but now has expanded. It now links Pallion with the City Centre.

Fulwell, Sunderland area and former civil parish in the City of Sunderland, England

Fulwell is an affluent area and former civil parish in the City of Sunderland. The parish was abolished in 1928 as a result of the Sunderland Corporation Act 1927, and the area incorporated into the former County Borough of Sunderland. It borders Seaburn, Southwick, Monkwearmouth, and Roker, and the district border between Sunderland and South Tyneside. Fulwell ward, including South Bents and Seaburn, is the least socially deprived of the city's 25 wards.

The election result was the worst for the Labour Party in Sunderland since 2012. It was the Conservatives' best result since 2008, and the best result for the Liberal Democrats since 1982 (when they stood as the SDP/Liberal Alliance). [5]

SDP–Liberal Alliance

The SDP–Liberal Alliance was a centrist political and electoral alliance in the United Kingdom. Formed by the Social Democratic Party (SDP) and the Liberal Party, the Alliance was established in 1981, contesting the 1983 general election, 1984 European election and 1987 general election. The Alliance ceased to exist in 1988, when the two component parties merged to form the Social and Liberal Democrats, later renamed the Liberal Democrats.

The overall turnout was 32.9%

Sunderland Local Election Result 2018 [6]
PartySeatsGainsLossesNet gain/lossSeats %Votes %Votes+/−
  Labour 1715Decrease2.svg4684732,344Decrease2.svg7
  Conservative 520Increase2.svg22029.320,195Increase2.svg7.2
  Liberal Democrat 330Increase2.svg31612.18,342Increase2.svg5.1
  Green 000Steady2.svg006.14,196Increase2.svg2.1
  Independent 001Decrease2.svg104.12,820Increase2.svg3
  Populist 000Steady2.svg000.6414Increase2.svg0.6
  North East Party 000Steady2.svg000.5342Steady2.svg0.5
  For Britain 000Steady2.svg000.2156Increase2.svg0.2

This resulted in the following composition of the council:

PartyPrevious CouncilNew Council
Labour6561
Conservatives68
Liberal Democrats36
Independent10
Total7575
Working majority 55  47 

Ward by ward results

Asterisk denotes incumbent councillor.

Barnes Ward

Barnes Ward
PartyCandidateVotes%±
Conservative Antony Mullen† 1,560 45.1 Increase2.svg8.1
Labour Zaf Iqbal1,23835.8Decrease2.svg5
Liberal Democrat Timothy Ellis43212.5Increase2.svg8.6
Green Caroline Robinson2206.4Increase2.svg6.4
Rejected ballots60.2Decrease2.svg0.6
Majority3229.3Increase2.svg5.5
Turnout 3,45640.7Increase2.svg1.3
Registered electors 8,484
Conservative gain from Labour Swing Increase2.svg6.6

†Antony Mullen was suspended by the Conservative Party during the election, and was under investigation due to a series of offensive social media posts he has made about Sunderland and Labour MP Diane Abbott. He remained on the ballot as a Conservative candidate, and was reinstated after being elected. [7] [8]

Diane Abbott British Labour Party politician

Diane Julie Abbott is a British politician who has served as the Member of Parliament (MP) for Hackney North and Stoke Newington since 1987. She was the country's first black female MP. A member of the Labour Party, she has been characterised as being on its hard left. Having held various positions in successive Labour Shadow Cabinets, since 2016 she has been Shadow Home Secretary.

Castle Ward

Castle Ward
PartyCandidateVotes%±
Labour Doris MacKnight* 1,358 63 Increase2.svg7.1
Conservative James Doyle43920.1Increase2.svg12.6
Green Rebecca Lapping1788.3Increase2.svg8.3
Liberal Democrat Jack Stoker1748.1Increase2.svg5.7
Rejected ballots60.3Decrease2.svg0.5
Majority91942.6Increase2.svg23.2
Turnout 2,15525.7Decrease2.svg2
Registered electors 8,387
Labour hold Swing Increase2.svg17.4†

†Swing to the Labour candidate from UKIP, who had stood last time this seat was contested.

Copt Hill Ward

Copt Hill Ward
PartyCandidateVotes%±
Labour Jack Cunningham 1,400 48.6 Increase2.svg4.4
Independent Anthony Allen*94032.6Decrease2.svg13.8
Conservative Patricia Francis42814.8Increase2.svg6.8
Green Esme Featherstone1083.7Increase2.svg3.7
Rejected ballots70.2Decrease2.svg1.2
Majority46016Increase2.svg13.8
Turnout 2,88332.4Decrease2.svg2.4
Registered electors 8,889
Labour gain from Independent Swing Increase2.svg9.1

Doxford Ward

Doxford Ward
PartyCandidateVotes%±
Labour Elizabeth Gibson* 1,258 58.4 Increase2.svg11.4
Conservative George Brown1,19955.6Increase2.svg35
Green Alan Robinson2089.7Decrease2.svg3.1
Liberal Democrat Peter Walton1707.9Increase2.svg7.9
Rejected ballots60.3Decrease2.svg0.4
Majority592.1Decrease2.svg19.8
Turnout 2,15525.7Decrease2.svg9.6
Registered electors 8,387
Labour hold Swing Increase2.svg18.2†

†Swing to the Labour candidate from UKIP, who had stood last time this seat was contested.

Fulwell Ward

Fulwell Ward
PartyCandidateVotes%±
Conservative George Howe* 1,816 46.6 Increase2.svg3.3
Labour Christopher Harding1,28933.1Increase2.svg1.2
Liberal Democrat Malcolm Bond63116.2Increase2.svg13.4
Green Steven Murray1594.1Decrease2.svg0.3
Rejected ballots190.5Increase2.svg0.1
Majority52713.5Increase2.svg2.1
Turnout 3,91443.7Increase2.svg3.2
Registered electors 8,949
Conservative hold Swing Increase2.svg10.3†

†Swing to the Conservative candidate from UKIP, who had stood last time this seat was contested.

Hendon Ward

Hendon Ward
PartyCandidateVotes%±
Labour Barbara McClennan* 1,029 47.4 Decrease2.svg2.7
Conservative Syed Ali42119.4Increase2.svg6.9
North East Party Kris Brown34215.7Increase2.svg15.7
Green Richard Bradley23911Increase2.svg4.2
Liberal Democrat Anthony Usher1346.2Increase2.svg6.2
Rejected ballots80.4Decrease2.svg0.5
Majority60828Increase2.svg5.6
Turnout 2,17327.6Decrease2.svg0.3
Registered electors 7,870
Labour hold Swing Decrease2.svg4.8

Hetton Ward

Hetton Ward
PartyCandidateVotes%±
Labour Claire Rowntree 1,480 53.3 Increase2.svg5.6
Independent David Geddis79928.8Increase2.svg28.8
Conservative Douglas Middlemiss35812.9Increase2.svg6.8
Green Rachel Lowe742.7Increase2.svg2.7
Liberal Democrat Diana Matthew541.9Decrease2.svg0.5
Rejected ballots120.4Decrease2.svg0.5
Majority68124.5Increase2.svg20.7
Turnout 2,77730.8Decrease2.svg4.2
Registered electors 9,029
Labour hold Swing Increase2.svg24.7†

†Swing to the Labour candidate from UKIP, who had stood last time this seat was contested.

Houghton Ward

Houghton Ward
PartyCandidateVotes%±
Labour Neil MacKnight 1,630 54.2 Increase2.svg11.6
Independent Linda Wood73724.5Increase2.svg24.5
Conservative Craig Morrison46015.3Increase2.svg10.4
Liberal Democrat Susan Sterling973.2Increase2.svg3.2
Green Graham Martin792.6Decrease2.svg2.6
Rejected ballots40.1Decrease2.svg0.4
Majority89329.7Increase2.svg20.5
Turnout 3,00732Decrease2.svg3.5
Registered electors 9,409
Labour hold Swing Increase2.svg22.5†

†Swing to Labour from an Independent candidate, who had stood last time this seat was contested.

Millfield Ward

Millfield Ward
PartyCandidateVotes%±
Liberal Democrat Andrew Wood 1,522 58 Increase2.svg25.4
Labour Iain Kay*87133.2Decrease2.svg3.1
Conservative Gwennyth Gibson1555.9Decrease2.svg0.7
Green Billy Howells732.8Decrease2.svg1
Rejected ballots40.2Decrease2.svg0.1
Majority65124.8Increase2.svg21
Turnout 2,62536.7Increase2.svg4.8
Registered electors 7,156
Liberal Democrat gain from Labour Swing Increase2.svg14.3

Pallion Ward

Pallion Ward
PartyCandidateVotes%±
Liberal Democrat George Smith 1,461 60.1 Increase2.svg57
Labour Elise Thompson71429.4Decrease2.svg18.4
Conservative Grant Shearer1787.3Decrease2.svg7
Green Craig Hardy763.1Decrease2.svg1.7
Rejected ballots30.1Decrease2.svg0.8
Majority74730.7Increase2.svg13.2
Turnout 2,43232.7Increase2.svg2.6
Registered electors 7,445
Liberal Democrat gain from Labour Swing Increase2.svg37.7

A by-election had been held in one of the other seats in Pallion Ward in February 2018 following the death of the incumbent Labour councillor. The by-election was won by the Liberal Democrats. [9]

Redhill Ward

Redhill Ward
PartyCandidateVotes%±
Labour Paul Stewart* 1,168 60.1 Increase2.svg1.4
Independent Heather Fagan34417.7Increase2.svg11.8
Conservative Neville Chamberlin34317.6Increase2.svg11.7
Green Rafal Marzec854.4Increase2.svg4.4
Rejected ballots50.6Decrease2.svg0.4
Majority82442.4Increase2.svg11.8
Turnout 1,94524.2Decrease2.svg1.7
Registered electors 8,039
Labour hold Swing Increase2.svg14.7†

†Swing to the Labour candidate from UKIP, who had stood last time this seat was contested.

Ryhope Ward

Ryhope Ward
PartyCandidateVotes%±
Labour Michael Essl 1,286 50.7 Increase2.svg3.7
Conservative Paula Wilkinson79731.4Increase2.svg17.5
Green Emma Robson29011.4Increase2.svg8
Liberal Democrat Keith Townsend1495.9Increase2.svg3.1
Rejected ballots130.5Decrease2.svg0.2
Majority48919.3Increase2.svg5.3
Turnout 2,53531Decrease2.svg3.1
Registered electors 8,169
Labour hold Swing Increase2.svg18.3†

†Swing to the Labour candidate from UKIP, who had stood last time this seat was contested.

Sandhill Ward

Sandhill Ward
PartyCandidateVotes%±
Liberal Democrat Lynn Appleby 1,025 45.1 Increase2.svg34.9
Labour Dave Allan*82036Decrease2.svg29.6
Conservative Michael Leadbitter31713.9Decrease2.svg10.3
Green John Appleton1104.8Increase2.svg4.8
Rejected ballots30.1Decrease2.svg2.9
Majority2059Decrease2.svg31.1
Turnout 2,27529Increase2.svg1.1
Registered electors 7,858
Liberal Democrat gain from Labour Swing Increase2.svg32.3

A by-election had been held in one of the other seats in Sandhill Ward in January 2017 following the disqualification of the incumbent Labour councillor for non-attendance. The by-election was won by the Liberal Democrats. [10]

Shiney Row Ward

Shiney Row Ward
PartyCandidateVotes%±
Labour Mel Speding* 1,704 54.4 Increase2.svg2.2
Conservative Sally Oliver74223.7Increase2.svg8.7
Populist Tony Morrow41413.2Increase2.svg13.2
Green Neil Shaplin1474.7Increase2.svg4.7
Liberal Democrat Nana Boddy1284.1Increase2.svg0.8
Rejected ballots70.2Decrease2.svg0.4
Majority96230.6Increase2.svg7.9
Turnout 3,14232.2Decrease2.svg0.1
Registered electors 9,747
Labour hold Swing Increase2.svg15.8†

†Swing to the Labour candidate from UKIP, who had stood last time this seat was contested.

Silksworth Ward

Silksworth Ward
PartyCandidateVotes%±
Labour Phil Tye* 1,417 52.4 Decrease2.svg0.2
Conservative Bryan Reynolds88032.6Increase2.svg16.3
Liberal Democrat Thomas Crawford2037.5Increase2.svg7.5
Green Chris Crozier2027.5Increase2.svg7.5
Rejected ballots70.3Decrease2.svg0.7
Majority53719.8Increase2.svg1.5
Turnout 2,70933.5Increase2.svg0.2
Registered electors 8,090
Labour hold Swing Decrease2.svg8.3

Southwick Ward

Southwick Ward
PartyCandidateVotes%±
Labour Alex Samuels 1,307 54.6 Increase2.svg3.1
Conservative Clair Hall62726.2Increase2.svg13
Liberal Democrat Bill Meeks31513.2Increase2.svg10.6
Green Anna Debska1395.8Increase2.svg5.8
Rejected ballots70.3Decrease2.svg0.5
Majority68028.4Increase2.svg8.8
Turnout 2,39529.7Decrease2.svg0.4
Registered electors 8,071
Labour hold Swing Increase2.svg17.4†

†Swing to the Labour candidate from UKIP, who had stood last time this seat was contested.

St Anne's Ward

St Anne's Ward
PartyCandidateVotes%±
Labour Karen Wood 1,062 51.2 Increase2.svg3.2
Conservative Gavin Wilson62029.9Increase2.svg15.8
Liberal Democrat Emma Neale26012.5Increase2.svg12.5
Green Gary Ogle1225.9Increase2.svg1.6
Rejected ballots100.5Decrease2.svg0.1
Majority44221.3Decrease2.svg12.7
Turnout 2,07426.2Increase2.svg1.2
Registered electors 7,926
Labour hold Swing Increase2.svg18.1†

†Swing to the Labour candidate from UKIP, who had stood last time this seat was contested.

St Chad's Ward

St Chad's Ward
PartyCandidateVotes%±
Conservative William Blackett 1,268 44.9 Increase2.svg10
Labour Gillian Galbraith*1,20342.6Decrease2.svg2
Liberal Democrat Margaret Crosby2619.3Increase2.svg6.2
Green Helmut Izaks893.2Increase2.svg3.2
Rejected ballots00Decrease2.svg0.5
Majority652.3Decrease2.svg3.4
Turnout 2,82137.6Increase2.svg0.7
Registered electors 7,506
Conservative gain from Labour Swing Increase2.svg6

St Michael's Ward

St Michael's Ward
PartyCandidateVotes%±
Conservative Michael Dixon* 1,958 58.3 Increase2.svg13.7
Labour Steve Hansom99029.5Increase2.svg3.8
Green Robert Welsh2206.6Decrease2.svg0.8
Liberal Democrat Julia Potts1845.5Increase2.svg1.6
Rejected ballots40.1Decrease2.svg0.2
Majority96828.8Increase2.svg9.9
Turnout 3,35640Increase2.svg1.2
Registered electors 8,395
Conservative hold Swing Increase2.svg15.9†

†Swing to the Conservative candidate from UKIP, who had stood last time this seat was contested.

St Peter's Ward

St Peter's Ward
PartyCandidateVotes%±
Conservative Shirley Leadbitter* 1,457 43.3 Increase2.svg6.9
Labour Ken Richardson1,25637.3Increase2.svg3.9
Liberal Democrat John Lennox41812.4Increase2.svg12.4
Green Rachel Featherstone2367.6Increase2.svg3.1
Rejected ballots70.2Decrease2.svg0.8
Majority2016Increase2.svg3
Turnout 3,37441.6Increase2.svg6.8
Registered electors 8,111
Conservative hold Swing Increase2.svg14.4†

†Swing to the Conservative candidate from UKIP, who had stood last time this seat was contested.

Washington Central Ward

Washington Central Ward
PartyCandidateVotes%±
Labour Linda Williams* 1,800 60.6 Increase2.svg7.2
Conservative Anna Snell90730.5Increase2.svg19.2
Green Michal Chantkowski2518.5Increase2.svg8.5
Rejected ballots110.4Decrease2.svg0.1
Majority89330.1Increase2.svg7.7
Turnout 2,96934.6Increase2.svg0.2
Registered electors 8,578
Labour hold Swing Increase2.svg19.1†

†Swing to the Labour candidate from UKIP, who had stood last time this seat was contested.

Washington East Ward

Washington East Ward
PartyCandidateVotes%±
Labour Tony Taylor* 1,561 50.1 Increase2.svg8.8
Conservative Hilary Johnson1,12336Increase2.svg10.1
Liberal Democrat Siobhán Kelleher2337.5Increase2.svg2.7
Green Josh Flynn1886Increase2.svg6
Rejected ballots120.4Decrease2.svg0.4
Majority43814.1Decrease2.svg1
Turnout 3,11734.4Increase2.svg0.1
Registered electors 9,063
Labour hold Swing Increase2.svg17.5†

†Swing to the Labour candidate from UKIP, who had stood last time this seat was contested.

Washington North Ward

Washington North Ward
PartyCandidateVotes%±
Labour Jill Fletcher* 1,514 62.9 Increase2.svg4.2
Conservative Carol Groombridge44318.4Increase2.svg10.7
Green June Bradley1707.1Increase2.svg7.1
For Britain Andrew Cox1566.5Increase2.svg6.5
Liberal Democrat Carlton West1205Increase2.svg2.5
Rejected ballots50.2Decrease2.svg0.7
Majority1,07144.5Increase2.svg17
Turnout 2,40829.7Decrease2.svg0.9
Registered electors 8,106
Labour hold Swing Increase2.svg17.6†

†Swing to the Labour candidate from UKIP, who had stood last time this seat was contested.

Washington South Ward

Washington South Ward
PartyCandidateVotes%±
Labour Graeme Miller* 1,292 47.2 Increase2.svg2.3
Conservative Martin Talbot97835.7Increase2.svg14.4
Green Dominic Armstrong2549.3Increase2.svg9.3
Liberal Democrat Sean Terry2067.5Increase2.svg2.4
Rejected ballots80.3Decrease2.svg0.3
Majority31411.5Decrease2.svg6.5
Turnout 2,73835.1Increase2.svg1
Registered electors 7,794
Labour hold Swing Increase2.svg15.6†

†Swing to the Labour candidate from UKIP, who had stood last time this seat was contested.

Washington West Ward

Washington West Ward
PartyCandidateVotes%±
Labour Dorothy Trueman* 1,697 59.2 Increase2.svg2.2
Conservative Olwyn Bird72125.2Increase2.svg10.5
Green Paul Leonard2749.5Increase2.svg9.5
Liberal Democrat Kevin Morris1655.8Increase2.svg1.4
Rejected ballots90.3Decrease2.svg0.3
Majority97625.2Decrease2.svg7.7
Turnout 2,86632.1Decrease2.svg0.3
Registered electors 8,924
Labour hold Swing Increase2.svg13.1†

†Swing to the Labour candidate from UKIP, who had stood last time this seat was contested.

Related Research Articles

2007 Sedgefield by-election

The Sedgefield by-election, 2007 was a by-election held on 19 July 2007 for the British House of Commons constituency of Sedgefield in County Durham. The Ealing Southall by-election was also held on 19 July.

2008 Woking Borough Council election

The 2008 Woking Council election took place on 1 May 2008 to elect members of Woking Borough Council in Surrey, England. One third of the council was up for election and the Conservative party stayed in overall control of the council.

2006 Sunderland City Council election

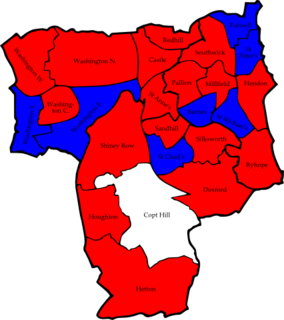
The 2006 Sunderland Council election took place on 4 May 2006 to elect members of Sunderland City Council in Tyne and Wear, England. One third of the Council was up for election and the Labour party stayed in overall control.

2007 Sunderland City Council election

The 2007 Sunderland Council election took place on 3 May 2007 to elect members of Sunderland Metropolitan Borough Council in Tyne and Wear, England. One third of the council was up for election and the Labour party stayed in overall control of the council.

2010 Sunderland City Council election

The 2010 Sunderland Council election took place on 6 May 2010 to elect members of Sunderland Metropolitan Borough Council in Tyne and Wear, England. One third of the council was up for election and the Labour party stayed in overall control of the council. The election took place on the same day as the 2010 General Election.

2011 South Norfolk District Council election

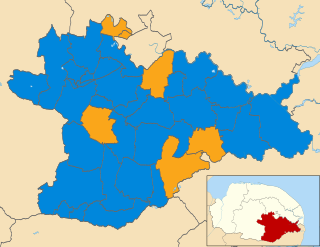
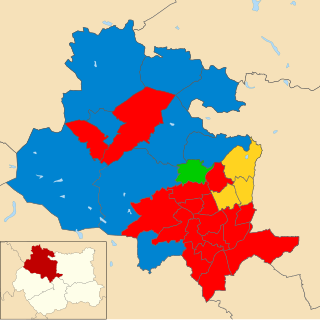
The elections to South Norfolk District Council were held on Thursday 5 May 2011 along with various other local elections around England, elections to the Scottish Parliament, National Assembly of Wales and Northern Ireland Assembly, and a referendum on whether to adopt the Alternative Vote electoral system for elections to the House of Commons. All 46 council seats were up for election. The previous council was controlled by the Conservatives, with the Liberal Democrats being the only opposition.

The 2011 council elections in Guildford saw the Conservatives retain control over Guildford Borough Council with an increased majority of 20 seats. Full results for each ward can be found at Guildford Council election, full results, 2011.

2011 Sunderland City Council election

The 2011 Sunderland Council election took place on 5 May 2011 to elect members of Sunderland Metropolitan Borough Council in Tyne and Wear, England. One third of the council was up for election and the Labour party stayed in overall control of the council.

2012 Sunderland City Council election

The 2012 Sunderland Council election took place on 3 May 2012 to elect members of Sunderland City Council in England. It was held on the same day as other United Kingdom local elections, 2012.

2012 North East Lincolnshire Council election

The 2012 North East Lincolnshire Council election took place on 3 May 2012 to elect members of North East Lincolnshire Council in England. This was on the same day as other United Kingdom local elections, 2012.

2014 Calderdale Metropolitan Borough Council election

The 2014 Calderdale Metropolitan Borough Council election took place on 22 May 2014 to elect members of Calderdale Metropolitan Borough Council in England. This was on the same day as local elections across the United Kingdom and a European election. One councillor was elected in each of the 17 wards for a four-year term. There are three councillors representing each ward elected on a staggered basis so one third of the councillor seats were up for re-election. The seats had previously been contested in 2010 which was held in conjunction with a general election. The turnout was significantly lower in 2014 than in 2010 which is not unusual when comparing local elections that coincide with general elections to ones that do not. Prior to the election Labour was the largest party in the council with 21 out of 51 seats, 5 seats short of an overall majority. After the election there was no overall control of the council. Labour had 25 seats, only one short of a majority and so Labour continued to operate a minority administration.

2014 North East Lincolnshire Council election

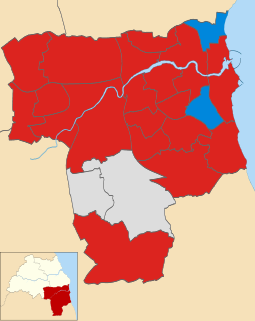
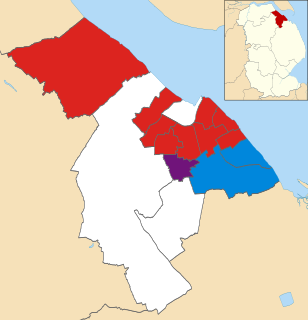
The 2014 North East Lincolnshire Council election took place on 22 May 2014 to elect members of North East Lincolnshire Council in England. This was on the same day as other local elections. These elections saw UKIP making significant gains largely at the expense of Labour, and stripping them of their majority on the council.

2015 City of Bradford Metropolitan District Council election

The 2015 City of Bradford Metropolitan District Council election took place on 7 May 2015. This was on the same day as other local elections and a general election. One councillor was elected in each ward for a four-year term so the councillors elected in 2015 last stood for election in 2011. Each ward is represented by three councillors, the election of which is staggered, so only one third of the councillors were elected in this election. Labour retained overall control of the council.

2016 Calderdale Metropolitan Borough Council election

The 2016 Calderdale Metropolitan Borough Council election took place on 5 May 2016 to elect members of Calderdale Metropolitan Borough Council in England. This was on the same day as other local elections. One councillor was elected in each ward for a four-year term so the councillors elected in 2016 last stood for election in 2012. Each ward is represented by three councillors, the election of which is staggered, so only one third of the councillors was elected in this election. Before the election there was no overall control with a minority Labour administration. After the election there was still no overall control so the minority Labour administration continued.

2016 Sunderland City Council election

The 2016 Sunderland City Council election took place on 5 May 2016 to elect one-third of the members of Sunderland City Council in England. This was on the same day as other local elections held across the United Kingdom.

2016 North East Lincolnshire Council election

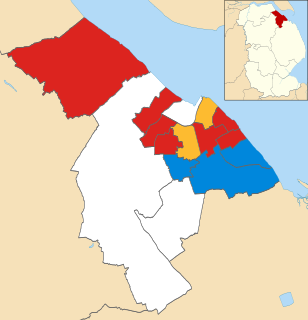
The 2016 North East Lincolnshire Council election took place on 5 May 2016 to elect members of North East Lincolnshire Council in England. This was on the same day as other local elections.

2018 Calderdale Metropolitan Borough Council election

The 2018 Calderdale Metropolitan Borough Council election took place on 3 May 2018 to elect members of Calderdale Metropolitan Borough Council in England. This was on the same day as other local elections. One councillor was elected in each ward for a four-year term so the councillors elected in 2018 last stood for election in 2014. Each ward is represented by three councillors, the election of which is staggered, so only one third of the councillors were elected in this election. Before the election there was no overall control with a minority Labour administration. Following the election Labour, having gained one councillor, was still two councillors away from a majority so it remained no overall control.

Elections to Cannock Chase District Council took place on 3 May 2018 on the same day as other local elections in England. A third of the council was up for election, meaning a total of 13 councillors were elected from all but two of the council's wards.

2018 City of Bradford Metropolitan District Council election

The 2018 City of Bradford Metropolitan District Council took place on 3 May 2018 to elect members of Bradford District Council in England. This was on the same day as other local elections. One councillor was elected in each ward for a four-year term so the councillors elected in 2018 last stood for election in 2014. Each ward is represented by three councillors, the election of which is staggered, so only one third of the councillors were elected in this election. Before the election there was a Labour majority and afterwards Labour had increased their majority.

References

Preceded by
Sunderland City Council election, 2016
Sunderland City Council elections Succeeded by
Sunderland City Council election, 2019